Most Requested Symbols

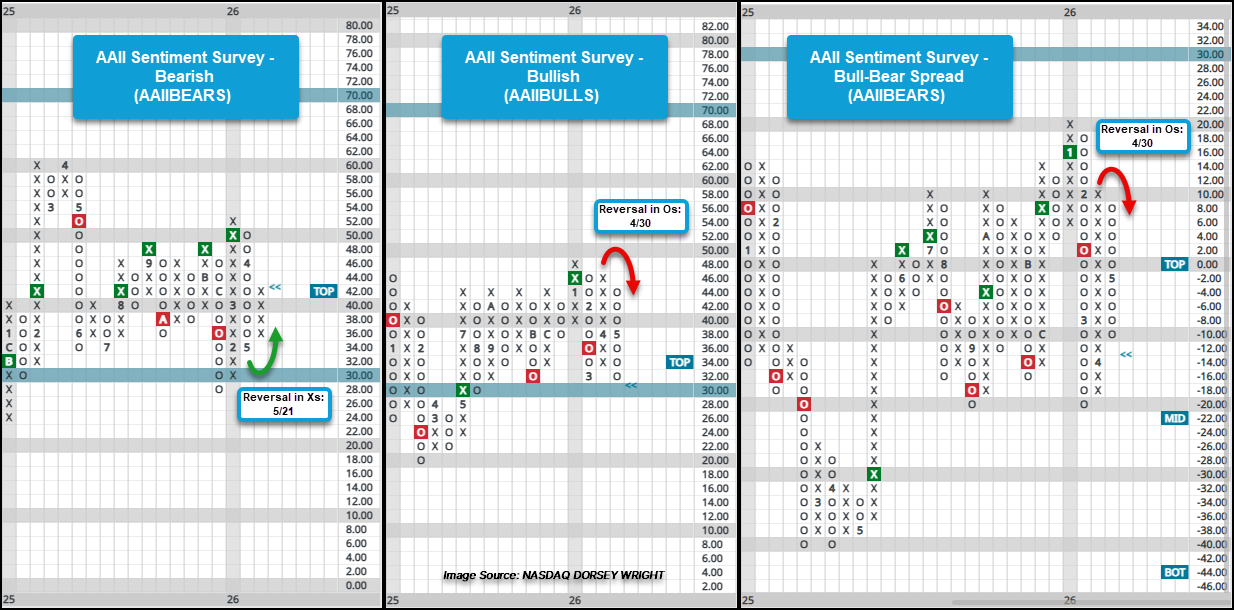
Prior to U.S. equity indices capping off with rallies to new highs, investor sentiment indicators witnessed notable action with bearish sentiment increasing and bullish sentiment dropping.
Semiconductors now take up almost half of technology's weight within the S&P 500 and are now larger than 10 of the 11 broad sectors.
Weekly Rundown Video – May 20, 2026
Weekly rundown with NDW analyst team covering all major asset classes.
Weekly rundown with NDW analyst team covering all major asset classes.
Last week’s action capped off with U.S. equity indices rallying to or near recent all-time highs. Prior to that, earlier in the week though, investor sentiment indicators witnessed notable action with bearish sentiment increasing and bullish sentiment dropping.
The investment sentiment indicators discussed plot the weekly American Association of Individual Investors (AAII) Sentiment Survey data on a point and figure chart and can be found by going to the Securities tab and selecting Chart Lists. Once on the Chart Lists page, click on Economic Indicator Charts under the Special Reports section on the lower left of the list box located on the left-hand side of the page. For those not familiar with the AAII Sentiment Survey, it offers insight into individual investor sentiment and simply asks whether investors think the market is heading within the next six months. The survey is taken weekly, updated on Thursdays, and these indicator charts – along with the longer-term 4-week averages – can be found near the top of the list of economic indicators.
Following last week’s survey, the bearish sentiment camp increased to 43% from 36% the prior week, leading the AAII Sentiment Survey – Bearish (^AAIIBEARS) chart to reverse back into a column of Xs after having been in a column of Os since early April. The Bullish (^AAIBULL) reversed down into Os in late April, but this week’s action brought bullish sentiment down to 31% and the chart down to its lowest level since March. Consequently, the Bull-Bear Spread (^AAIISPREAD) reached double digits in favor of the bears camp for the first time since early April.
While bearish sentiment hasn’t quite reached the 50% levels seen since late March, bullish sentiment has fallen to its lowest since that time. The neutral camp still remains below the 30% mark on the chart that has been somewhat of a line in the sand since early 2025.
Over the weekend, geopolitical tensions within the middle east have shifted further towards a peace settlement. Given these developments and the tensions being the primary driver of near-term action in the recent months, it will be worth monitoring whether sentiment sees an uptick in bullish sentiment and decrease in bearish sentiment or if last week’s divergence in sentiment continues.

Technology has been a growing sector within the S&P 500 over a decade. At the end of 2016, Information Technology made up just 13.53% of the S&P 500, as of the end of April this year it now makes up 34.97% of the index. Within Information Technology, there are four GICS industries: Semiconductors, Software, Technology Hardware Storage & Peripherals, and Electronic Equipment Instruments & Components. A decade ago, software, hardware, and semis each made up 3-4% of the overall S&P 500. Through second half of the 2010s and first four years of the 2020s, software was the biggest gainer, moving from 3.99% to over 10% by the end of 2023. Both hardware and semis followed suit albeit to a lesser extent. Starting in 2022, semis began a consistent ascendancy, more than tripling their size within the S&P 500 in less than four years, going from 5.05% to 16.67%. If semiconductors were their own broad sector, it would be larger than every other sector except for technology. Furthermore, semiconductors make up more of the S&P 500 than the energy, consumer staples, utilities, real estate, basic materials, and communications combined. With our data through the end of April, semis are even larger than displayed in the chart below. The iShares Semiconductor ETF (SOXX) is up 15.37% (not including the 5% intraday gain during the time of this writing) in May while the SPX is up just 3.37%.

Drilling further into the weight of each industry in the information technology sector, we can see how dominant semis have become within the broader sector. Semiconductors now make up just under half of the technology sector, more than doubling since the launch of OpenAI’s ChatGPT at the end of 2022. Besides an increase from software’s share of the technology sector in 2018, the four industry groups had been in balance until 2022. While semis have increased their intrasector weighting significantly, software and tech hardware have been the biggest losers. Electronic equipment, by far the smallest portion of the tech sector, has stayed at roughly the same level over the last decade.
*Note that the weightings do not add up to 100% due to lack of industry level data for some stocks*

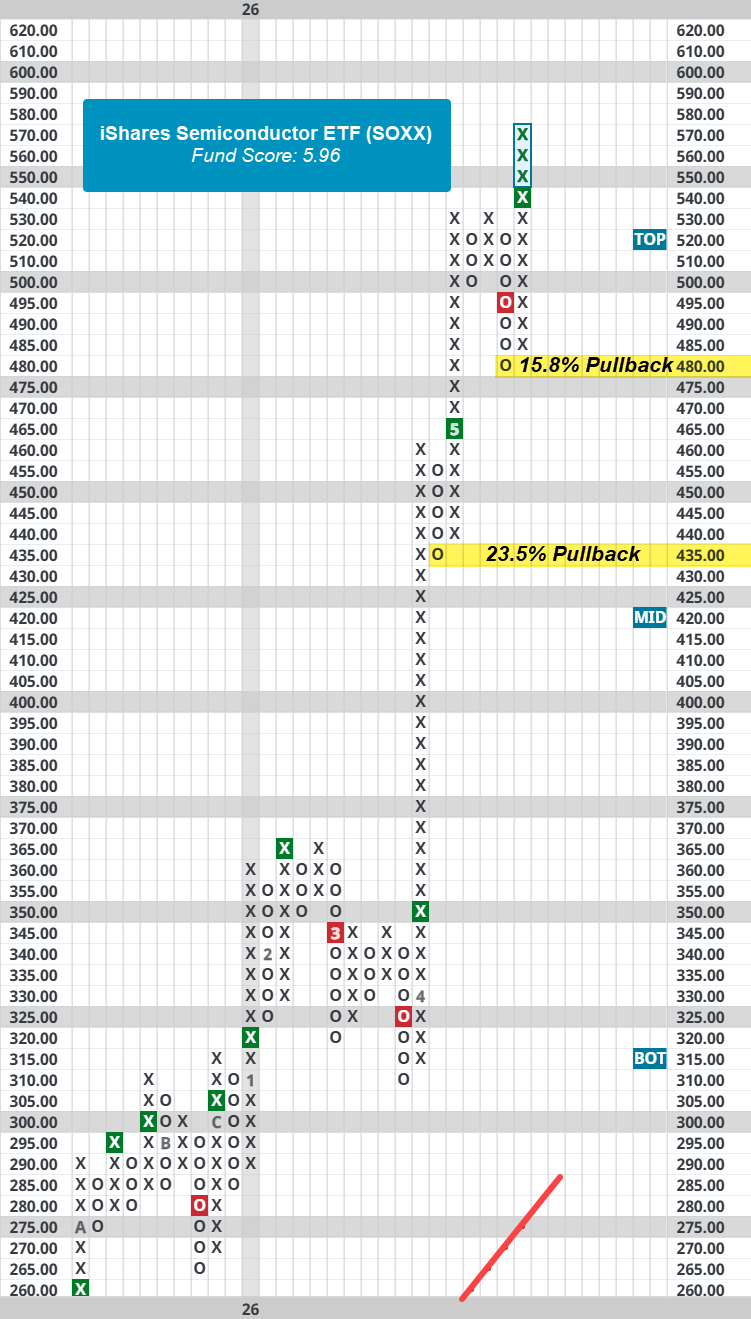
In short, semiconductors are in the driver’s seat for the technology sector and have a greater impact on the market than every other broad sector. Looking at semis’ technical picture via the iShares Semiconductor ETF (SOXX), the fund has a near-perfect 5.96 fund score, recently completed a shakeout pattern, and reached a new all-time high today. With today’s move, SOXX has an intraday weekly overbought/oversold reading of almost 150%, near the highest level ever. To say price action is frothy in the short term would be an understatement. Nonetheless, with a near-perfect fund score, it’s hard to be bearish on SOXX except for the possibility of a pullback in a greater uptrend. However, a pullback could be uncomfortable as the fund is about 15% away from its nearest support level which was established last week. In any case, it would be prudent to look through any direct exposure to the sector via ETFs like SOXX or individual equity names to consider trimming exposure or putting in some stops so a large pullback won’t be detrimental to unrealized gains.
Average Level
29.68
| < - -100 | -100 - -80 | -80 - -60 | -60 - -40 | -40 - -20 | -20 - 0 | 0 - 20 | 20 - 40 | 40 - 60 | 60 - 80 | 80 - 100 | 100 - > |
|---|---|---|---|---|---|---|---|---|---|---|---|
|
Buy signalGCC
|
|||||||||||
|
Buy signaldvy
|
|||||||||||
|
Buy signalicf
|
|||||||||||
|
Sell signalshy
|
Buy signalhyg
|
Buy signalijr
|
Buy signalSPY
|
||||||||
|
Sell signaltlt
|
Sell signaldx/y
|
Buy signalEEM
|
Buy signaliwm
|
Buy signalXLG
|
|||||||
|
Sell signalagg
|
Buy signalfxe
|
Buy signalGSG
|
Buy signalefa
|
Buy signalrsp
|
Buy signalVOOV
|
Buy signalONEQ
|
|||||
|
Sell signalief
|
Sell signalgld
|
Sell signallqd
|
Sell signalUSO
|
Buy signalIJH
|
Sell signaldia
|
Buy signalVOOG
|
Buy signalQQQ
|
||||
| < - -100 | -100 - -80 | -80 - -60 | -60 - -40 | -40 - -20 | -20 - 0 | 0 - 20 | 20 - 40 | 40 - 60 | 60 - 80 | 80 - 100 | 100 - > |
| AGG | iShares US Core Bond ETF |
| USO | United States Oil Fund |
| DIA | SPDR Dow Jones Industrial Average ETF |
| DVY | iShares Dow Jones Select Dividend Index ETF |
| DX/Y | NYCE U.S.Dollar Index Spot |
| EFA | iShares MSCI EAFE ETF |
| FXE | Invesco CurrencyShares Euro Trust |
| GLD | SPDR Gold Trust |
| GSG | iShares S&P GSCI Commodity-Indexed Trust |
| HYG | iShares iBoxx $ High Yield Corporate Bond ETF |
| ICF | iShares Cohen & Steers Realty ETF |
| IEF | iShares Barclays 7-10 Yr. Tres. Bond ETF |
| LQD | iShares iBoxx $ Investment Grade Corp. Bond ETF |
| IJH | iShares S&P 400 MidCap Index Fund |
| ONEQ | Fidelity Nasdaq Composite Index Track |
| QQQ | Invesco QQQ Trust |
| RSP | Invesco S&P 500 Equal Weight ETF |
| IWM | iShares Russell 2000 Index ETF |
| SHY | iShares Barclays 1-3 Year Tres. Bond ETF |
| IJR | iShares S&P 600 SmallCap Index Fund |
| SPY | SPDR S&P 500 Index ETF Trust |
| TLT | iShares Barclays 20+ Year Treasury Bond ETF |
| GCC | WisdomTree Continuous Commodity Index Fund |
| VOOG | Vanguard S&P 500 Growth ETF |
| VOOV | Vanguard S&P 500 Value ETF |
| EEM | iShares MSCI Emerging Markets ETF |
| XLG | Invesco S&P 500 Top 50 ETF |

| Symbol | Company | Sector | Current Price | Action Price | Target | Stop | Notes |
|---|---|---|---|---|---|---|---|
| BPOP | Popular, Inc. | Banks | $150.50 | hi 130s - low 150s | 200 | 120 | 5 for 5'er, 18 of 174 in favored BANK sector matrix, LT pos peer & mkt RS, triple top, good R-R, 2% yield |
| GRMN | Garmin Ltd. | Leisure | $240.71 | mid 230s - mid 260s | 364 | 196 | 5 TA rating, LT pos trend and mkt RS buy, top 33% of LEIS sector matrix, buy-on-pullback |
| SBUX | Starbucks Corporation | Restaurants | $103.11 | hi 90s - mid 100s | 129 | 85 | 4 for 5'er, top 20% of REST sector matrix, mkt RS reversal to Xs, triple top, 2.35% yield |
| OSW | OneSpaWorld Holdings Ltd. | Leisure | $23.99 | 22 - 24 | 30.50 | 19 | 5 for 5'er, top half of LEIS sector matrix, LT pos peer & mkt RS, spread quintuple top |
| IMO | Imperial Oil Limited | Oil | $133.19 | mid 120s to mid 130s | 164 | 112 | 5 for 5'er; top quartile of Oil matrix; long term mkt and peer RS; Pos. Trend since May '25. |
| SKT | Tanger Inc. | Real Estate | $35.50 | mid-to-hi 30s | 48 | 31 | 5 for 5'er, top 25% of REAL sector matrix, LT pos peer & mkt RS, R-R~2.0, 3.2% yield |
| IBOC | International Bancshares Corporation | Banks | $72.78 | low-to-mid 70s | 93 | 63 | 4 for 5'er, favored BANK sector, LT pos peer & mkt RS, bearish signal reversal, R-R~2.0, 1.95% yield |
| MSGE | Madison Square Garden Entertainment Corp. | Leisure | $69.64 | 63 to 69 | 98 | 53 | 5 for 5'er since Nov. 2025; Top Decile of Leisure Matrix; Pos. Trend since May 2025; ATH 5/7. |
| LYV | Live Nation Entertainment Inc. | Leisure | $165.55 | low 160s to mid 170s | 202 | 142 | 4 for 5'er; Pos. Trend; Top Half of Leisure Matrix; Within one box of ATH. |
| MO | Altria Group Inc. | Food Beverages/Soap | $73.90 | low-to-mid 70s | 91 | 62 | 4 for 5'er, top quartile of FOOD sector matrix, one box from RS buy, bullish triangle, 5.9% yield |
| MPC | Marathon Petroleum Corp. | Oil Service | $254.65 | 240 - 260 | 360 | 208 | 4 for 5'er, pos. trend, top third of Oil Services matrix, pos. L-T Mkt and Peer RS. |
| CGNX | Cognex Corp | Electronics | $66.09 | low-to-mid 50s | 75 | 52 | 4 for 5'er, top half of favored ELEC sector matrix, one box from mkt RS buy, buy on pullback |
| CELC | Celcuity Inc. | Biomedics/Genetics | $138.07 | low $130 - low $140 | 216 | 116 | 5/5'er since Oct. '25, pos. trend, top quintile of Biom. matrix, R-R > 5. |
| VLO | Valero Energy Corp | Oil Service | $246.96 | mid 230s - hi 250s | 328 | 212 | 4 TA rating, top 50% of OILS sector matrix, LT pos trend, buy-on-pullback |
| C | Citigroup, Inc. | Banks | $125.09 | low 120s - low 130s | 188 | 102 | 5 for 5'er since July '25; top decile of Banks matrix; pos. trend since May '25. |
| Symbol | Company | Sector | Current Price | Action Price | Target | Stop | Notes |
|---|
| Comment | |||||||
|---|---|---|---|---|---|---|---|
|
|
|||||||
C Citigroup, Inc. R ($125.44) - Banks - Citigroup has been at least a 3 technical attribute rating for more than 12 months and maintained a 5 TA rating since July of last year. C has maintained positive long-term RS versus the market since January 2025 and peer group since July 2025, while currently ranking within the top decile of the Banks sector matrix. On the trend chart, C has maintained a positive trend for more than 12 months and returned to a buy signal in early April this year as shares rallied multi-year highs at $134. After pulling back from those rally highs down to $120, last week’s trading brought the chart back into a column of Xs. Okay to consider in the low $120 to low $130 range. The bullish price objective of $188 will be utilized as our price target and the initial stop loss point will be $102.
| 26 | |||||||||||||||||||||||||||||
| 134.00 | X | 134.00 | |||||||||||||||||||||||||||
| 132.00 | X | O | 132.00 | ||||||||||||||||||||||||||
| 130.00 | X | O | 130.00 | ||||||||||||||||||||||||||
| 128.00 | X | O | 128.00 | ||||||||||||||||||||||||||
| 126.00 | X | 5 | X | 126.00 | |||||||||||||||||||||||||
| 124.00 | 1 | X | X | O | X | 124.00 | |||||||||||||||||||||||
| 122.00 | X | O | X | O | X | O | X | Mid | 122.00 | ||||||||||||||||||||
| 120.00 | X | O | 2 | O | X | O | 120.00 | ||||||||||||||||||||||
| 118.00 | X | O | X | O | X | 118.00 | |||||||||||||||||||||||
| 116.00 | X | O | X | O | X | X | X | X | 116.00 | ||||||||||||||||||||
| 114.00 | X | O | X | O | X | O | X | O | X | O | 4 | 114.00 | |||||||||||||||||
| 112.00 | X | O | O | X | O | X | O | X | O | X | 112.00 | ||||||||||||||||||
| 110.00 | X | O | O | X | O | X | O | X | 110.00 | ||||||||||||||||||||
| 108.00 | X | O | 3 | X | O | 108.00 | |||||||||||||||||||||||
| 106.00 | C | O | X | 106.00 | |||||||||||||||||||||||||
| 104.00 | X | O | 104.00 | ||||||||||||||||||||||||||
| 102.00 | O | X | B | X | X | X | Bot | 102.00 | |||||||||||||||||||||
| 100.00 | O | X | X | O | X | O | X | O | X | O | X | 100.00 | |||||||||||||||||
| 99.00 | A | X | O | X | O | X | X | O | X | O | X | O | X | 99.00 | |||||||||||||||
| 98.00 | O | X | O | X | O | X | O | X | O | O | X | O | X | 98.00 | |||||||||||||||
| 97.00 | O | O | X | O | X | O | X | O | O | X | 97.00 | ||||||||||||||||||
| 96.00 | O | X | O | O | X | O | 96.00 | ||||||||||||||||||||||
| 95.00 | O | X | O | 95.00 | |||||||||||||||||||||||||
| 94.00 | O | • | 94.00 | ||||||||||||||||||||||||||
| 26 |
| AMR Alpha Metallurgical Resources Inc. ($190.35) - Oil - After giving two consecutive sell signals, AMR returned to a buy signal and a positive trend Tuesday. The outlook for the stock remains unfavorable, however, as even with the positive trend change, AMR is an unfavorable 1 for 5'er. The stock now sits against resistance at $192; meanwhile, support can be found at $172. |
| AMT American Tower REIT ($186.29) - Real Estate - AMT shares moved higher today to break a double top at $186 to mark its first buy signal and enter a positive trend. This 1 for 5' er has been on an RS sell signal versus the market since October 2022. AMT shares are trading near the middle of their ten-week trading band with a weekly overbought/oversold reading of 22%. From here, support is offered at $168. |
| AZO Autozone, Inc. ($3,022.47) - Autos and Parts - AZO broke a double bottom at $3264 as shares fell to $3008 on the chart, marking the lowest chart level since late 2024. This will cause the peer RS chart to reverse back into Os, dropping the stock down to a 2 for 5'er that ranks within the bottom half of the Autos and Parts sector matrix. Long-term support resides at current chart levels, while additional can be found in the mid $2700 to low $2800 range. |
| BP BP plc (United Kingdom) ADR ($42.32) - Oil - BP gave an initial sell signal Tuesday when it broke a double bottom at $43, where it now sits against support. The outlook for the stock remains positive as BP is a 4 for 5'er. However, beyond the current support at $43, BP shows no additional support on its chart until $34. |
| CENX Century Aluminum Co ($67.43) - Metals Non Ferrous - CENX returned to a buy signal and a positive trend Tuesday when it broke a double top at $66. The positive trend change will promote the stock to an acceptable 3 for 5'er and CENX ranks in the top third of the non-ferrous metals sector matrix. From here, the next level of overhead resistance sits at $68, a multi-year high. |
| F Ford Motor Company ($15.32) - Autos and Parts - F broke a spread quadruple top at $15 as shares rallied to $15.50, marking a third buy signal and the highest chart level since 2022. F has increased to a 4 for 5'er in technical attribute rating with the market RS chart reversing into Xs and the peer RS chart shifting to an RS buy signal in recent weeks. This break places the stock in overbought terrritory, so those seeking exposure to the stock would be better served considering on a pullback to the $14 range. Initial support lies at $13, while the bullish support line resides at $11.50. |
| HCC Warrior Met Coal Inc ($93.48) - Oil - HCC returned to a buy signal and a positive trend Tuesday when it broke a double top at $91. The positive trend change will promote the stock to an acceptable 3 for 5'er. From here, the next level of overhead resistance sits at $96. Meanwhile, support can be found at $82. |
| HWKN Hawkins Chemical Inc ($153.68) - Chemicals - After giving two consecutive sell signals, HWKN returned to a buy signal Tuesday when it broke a double top at $156. Tuesday's move adds to an already positive technical picture as HWKN is a 4 for 5'er that ranks in the top half of the chemicals sector matrix. From here, the next test for the stock is prior resistance and its bearish resistance line at $162. Meanwhile, support can be found at $148. |
| MU Micron Technology, Inc. ($911.73) - Semiconductors - Shares of MU rocketed higher after UBS more than tripled its price target its stock, allowing it to break a double top at $816 a set all-time highs. The 5 for 5'er continues to be one of the strongest names in the market, but it is currently in heavily overbought territory. Those without current exposure should wait for pullback or consolidation before adding. Initial support lies a $656, but previous resistance in the low $800s could also serve as support. |
| SNOW Snowflake, Inc. Class A ($178.38) - Software - Shares of SNOW broke a spread triple top at $178 for its fourth consecutive buy signal. The 3 for 5'er returned to a positive trend in the past couple weeks. However, the name still lacks long-term market relative strength and near-term peer relative strength, keeping it in hold territory for now. Heavy resistance also lies at $184, with the next resistance found at $188. |
| UPS United Parcel Service, Inc. ($102.05) - Transports/Non Air - UPS returned to a buy signal and positive trend with today's action, but the stock will remain a poor attribute name as we move into June. Furthermore, there is still plenty of resistance ahead of current levels, ranging all the way up to the 2026 highs around $122. With that in mind, continue to avoid UPS for now- it wouldn't be out of the question to head back to around recent lows at $94. |

The option suggestions featured here are pulled from the NDW Options Ideas tool. These are just a sample of the ideas that can be found there. The Options Idea tool contains numerous additional income and speculative plays. It also offers relative strength-based screens targeting the highest (and lowest) relative strength stocks and ETFs that have recently moved counter to their longer-term trend. To access or subscribe to the Options Ideas tool click here.
Call
Gilead Sciences Inc (GILD) Aug. 21 $130 Call

| Additional Data: | |
| Bid/Ask Spread | 3.83% |
| Delta | 65.05 |
| Gamma | 1.96 |
| Implied Volatility | 30.33% |
| Expiry Days | 87 |
| Earnings Date | 8/6/2026 |
Put
The Trade Desk Inc (TTD) Sep 18 $22.50 Put

| Additional Data: | |
| Bid/Ask Spread | 2.86% |
| Delta | -43.17 |
| Gamma | 4.55 |
| Implied Volatility | 71.60% |
| Expiry Days | 115 |
| Earnings Date | 8/6/2026 |
Income (Short Put)
Philip Morris International (PM) June 26 $170 Put

| Additional Data: | |
| Bid/Ask Spread | 54.55% |
| Delta | 21.02 |
| Gamma | -1.71 |
| Implied Volatility | 28.41% |
| Expiry Days | 31 |
| Earnings Date | 7/22/2026 |
Daily Equity & Market Analysis
Loading, Please Wait...

