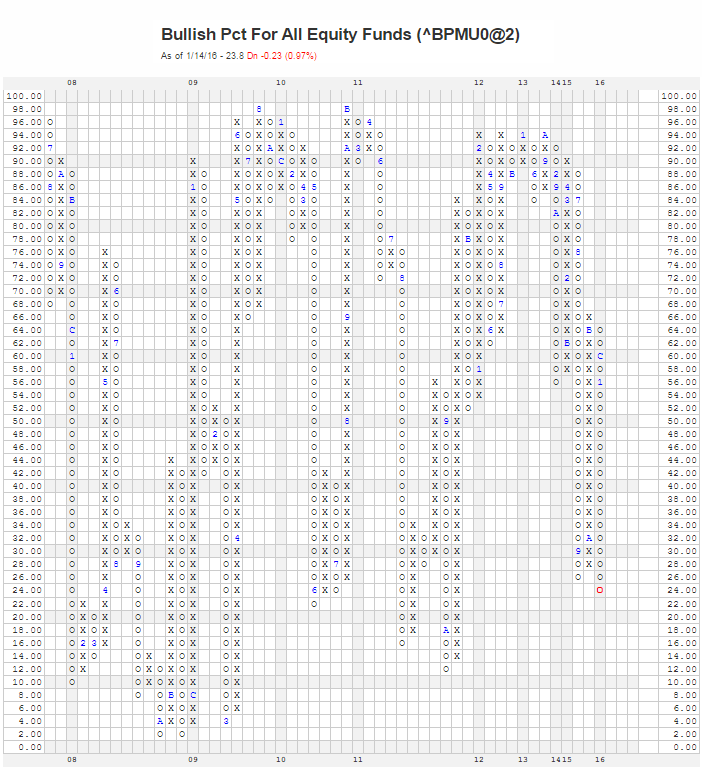
The Intermediate All Equity Funds bullish percent is moving through the bottom third and into the bottom quarter of the field position on the chart. Major turbulence occurs at the lower section of a bullish percent's field position, and you will want to brace your allocation for the potential of higher turbulence, while we see where the advance of sell signals bottoms out.
The Intermediate All Equity Funds bullish percent is moving through the bottom third and into the bottom quarter of the field position on the chart. This indicator measures the default intermediate charts for every mutual fund and ETF related to equity anywhere in the world markets. Major turbulence occurs at the lower section of a bullish percent’s field position, and you will want to brace your allocation for the potential of higher turbulence, while we see where the advance of sell signals bottoms out. We have not seen these levels in this bullish percent since 2011, and with several years of not having to face this type of action, you have to prepare yourself to navigate this situation now, in 2016.
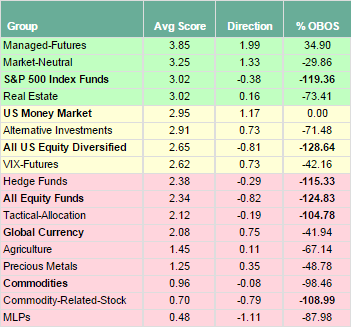
Alternative assets scores have surged recently, in context to a longer term modest rise in Group Score over the last couple years. The last surge was in the summer of 2015 and then it abated. Now the Alternatives universe is back close to the 3 score line.
Alternatives mean alternatives to basic long equity or basic long fixed income. Real Estate is often a “go to” place for investors historically. Here Real Estate does have a respectable score. But Managed Futures lead scoring among these groups now with a 3.85 as it shows the strongest positive Score Direction in this landscape. The near term is the wrong time to go contrarian and seek exposure to low relative strength ALTS. Commodities and such remain dangerous in this context until further notice. So for those concerned about equity exposures, you choices are to raise quality in equity towards larger cap exposures, along with a mixture of cash, Real Estate and Managed Futures can help your allocation behave more neutral while the market is in this period of turbulence.

Fixed Income is a very important piece to any allocation that is designed to work in bad weather. But make no mistake, if your aim is protect against equity erosion, then you can maintain exposure to High Yield. US High Yield as well as Global High Yield has at least a 0.7 correlation or higher to the S&P 500 equity benchmark. So the raising quality aspect to playing defense includes raising quality in fixed income for sure. The below score plot shows you the relative strength difference between US Government related funds versus US High Yield exposures. Each of these Score Lines include any mutual fund or ETF that trades in these respective spaces. High Yield funds trade on average just below 2 points and maintain a declining score path. US Government funds are trading above 3.50 score mark. At present there is no contest between the 2 groups and so you should continue to migrate to the Highest Quality at your disposal.