Most Requested Symbols

With yields rising and fears over long-term inflation, TIPS can benefit a fixed income allocation.
Micron went from an impressive $500 billion market cap to over $1 trillion at record pace. Today, we examine other instances of companies joining the "trillion club"
Weekly Rundown Video – May 27, 2026
Weekly rundown with NDW analyst team covering all major asset classes.
Weekly rundown with NDW analyst team covering all major asset classes.
Treasury yields have perked up recently with the US Treasury 30YR Yield Index (TYX) hitting 5.15% last week, its highest level since 2007. Investors are still worried about long-term inflationary pressures, particularly further than 10 years out. The market yield on US Treasury securities at 30-year constant maturity, inflation-indexed is 2.77%. This represents the yield above inflation, otherwise called the real yield. The defining feature of US Treasury inflation-protected securities or TIPS for short is that the principal is protected against inflation. For example, if an investor bought a $1000 par TIP at issuance and inflation was 2% for the year, then the year end principal value would be $1020. On top of that, the TIP would pay interest on the value of the adjusted principal (2.77% if one purchased a 30YR TIP today). If held to maturity, the investor would receive coupons that grew with inflation each period as well as the greater value of either the original principal or the inflation adjusted principal amount. In the graph below, we can see that the 30YR TIP yield is at its highest level since they were brought back in 2010.

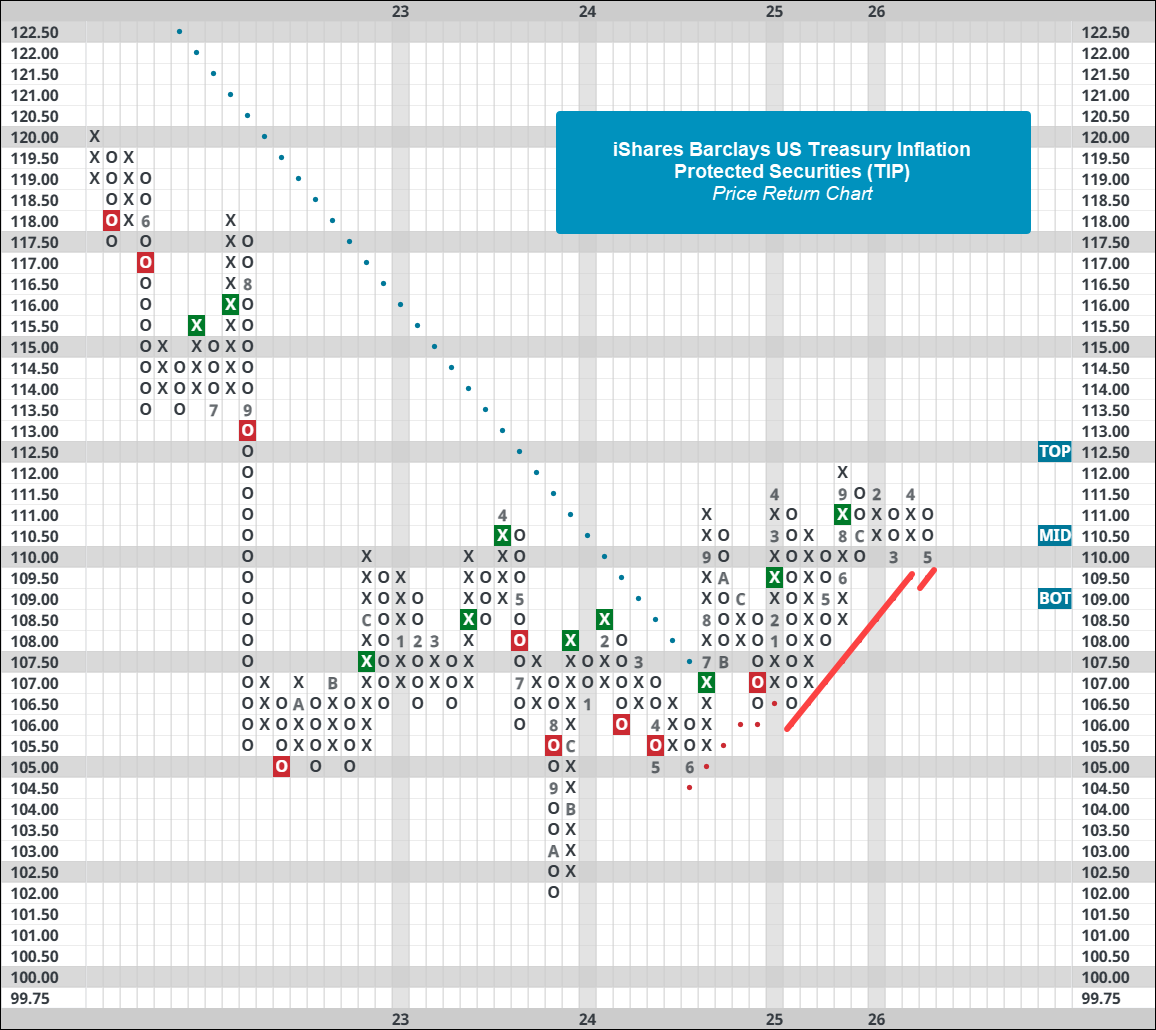
TIPS aren’t for everyone, but for those that need income and are at or near retirement they could fit in nicely with their current yields. One key aspect is that investors need to keep in mind is that TIPS ETFs are not holding these securities until maturity and are usually targeting exposure to a specific area of the yield curve. Therefore, it will often be better to go out and buy the bonds themselves for clients based on their needs with the expectation of letting them mature. However, if an exchange traded vehicle is preferred, the iShares Barclays US Treasury Inflation Protected Securities ETF (TIP) could be considered. While it has a poor fund score of 1.08, it has been in a positive trend since 2024 and trades on two consecutive buy signals. Fixed income has been at the bottom of our asset class rankings for years, but it is still a necessary part of many portfolios. With the inflation protection feature and yields at high levels, TIPS could fit nicely into a portfolio given the right circumstances.

The appreciation of semiconductors has been dizzying, a topic which we have touched on heavily over the last few months’ worth of daily equity reports. What has been less featured, however, are attempts to quantify just how rapid the acceleration has been. Most often, the NDW analyst team will utilize our weekly OBOS values to judge where a name sits in relation to its respective 50-day moving average… with higher values suggesting an asset is more overbought. Outside of that, the astute chartist will utilize a whole host of tools, whether that be performance spreads over some benchmark, other fundamental price justification models/metrics, or maybe even just a “gut” feeling. Today’s feature will utilize market capitalization growth to quantify how semiconductor leader Micron has appreciated relative to other 1 trillion dollar US-listed companies. As of 5/22/2026, Micron joined the “1-trillion dollar club”, the company of 11 other US companies (listed below) that have ever seen their market cap close above 1 trillion dollars. Before a deeper analysis into the rapid uptick in strength for MU, we will offer a brief technical comment on the name for those of you lucky enough to have been a part of this historical right-tail run for the computer memory manufacturer. Up over 210% so far in 2026, MU has obviously been a point of high RS, even when compared to an extraordinarily strong semiconductors sector. It goes without saying that the name lies in heavily overbought territory…. But as evidenced during this run overbought assets are often quite good at getting even more overbought. All that to say, be tactical with adding to new positions, but don’t feel a particular rush in exiting current holdings if you don’t need to reallocate. Momentum is built on harnessing extreme right tail events.
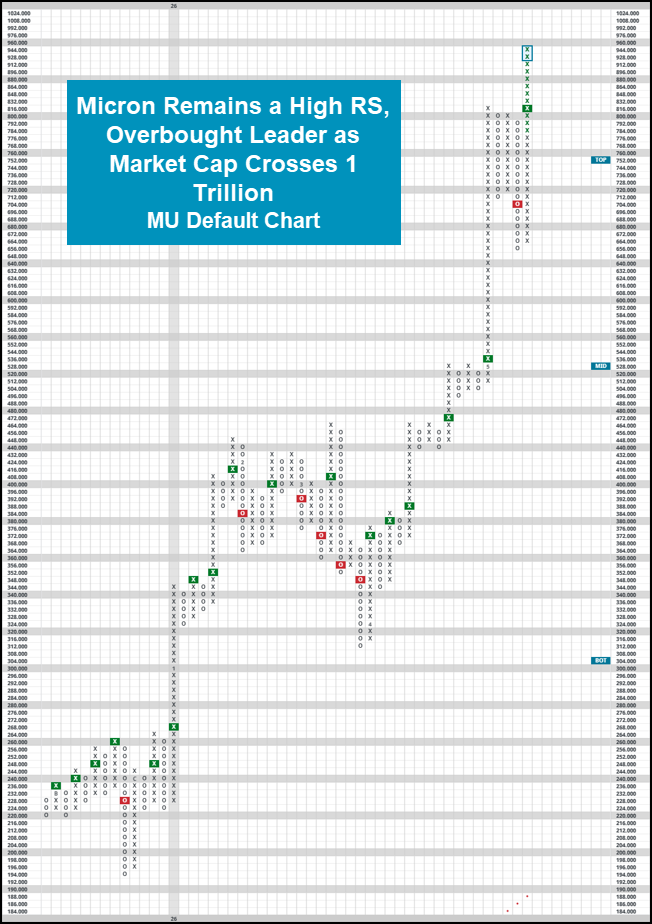
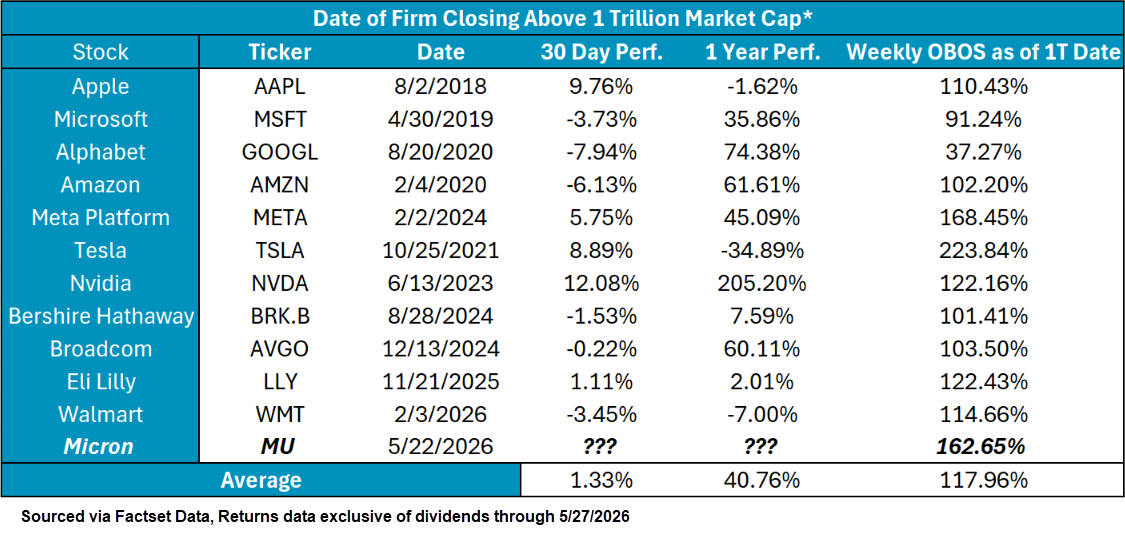
Getting back to the speed at which Micron (and largely semiconductors) have accelerated, we can journey back to our market cap conversation with the table below. The dataset (sourced via FactSet closing data) breaks down each of the 12 companies that have breached the $1 trillion market cap mark over time. From there, we calculated the 30-day and 1-year performance following each company’s close above that point. On average, it is interesting to note that in most circumstances, forward performance continues to accelerate, seeing our 1T club members gain another ~40% in the following year on average (~36% median) and 1.33% in the next 30-days. While Micron is on what we would consider the higher end of each firm’s observed weekly OBOS reading, it isn’t the highest…. That crown goes to TSLA from late 2021. All this to say, history doesn’t suggest that crossing $1,000,000,000,000 means an immediate slowdown is in store. Do note, that the timing of our dataset is admittedly quite narrow- all instances come over the last ten years which for the most part have been quite kind to domestic markets.
That isn’t to say that Micron’s assent to stardom has been “normal” by any means. The next question quickly becomes- how quickly did each of the companies included above move from another notable landmark- say, 500 billion- to 1 trillion in overall market cap? The chart below looks to quantify that, simply by counting the number of trading days it took for each firm to move from one point to the next. You’ll notice companies all along the spectrum up to the 1,670-trading day gap for (BRK.B). Before Micron, previously mentioned TSLA held the record, having moved from one metric to the next in a comparatively minuscule 230 trading days from November 2020-October 2021. Then, enter the March 17-May 22 run for MU- all in 2026 alone. For those not counting, that’s a mere 48 trading days. For context, to move from one mark to the next, MU had to gain over 10b in overall market cap per day on average, not too bad for roughly two months of trading days. Put this way, a slowdown in upside feels almost inevitable.
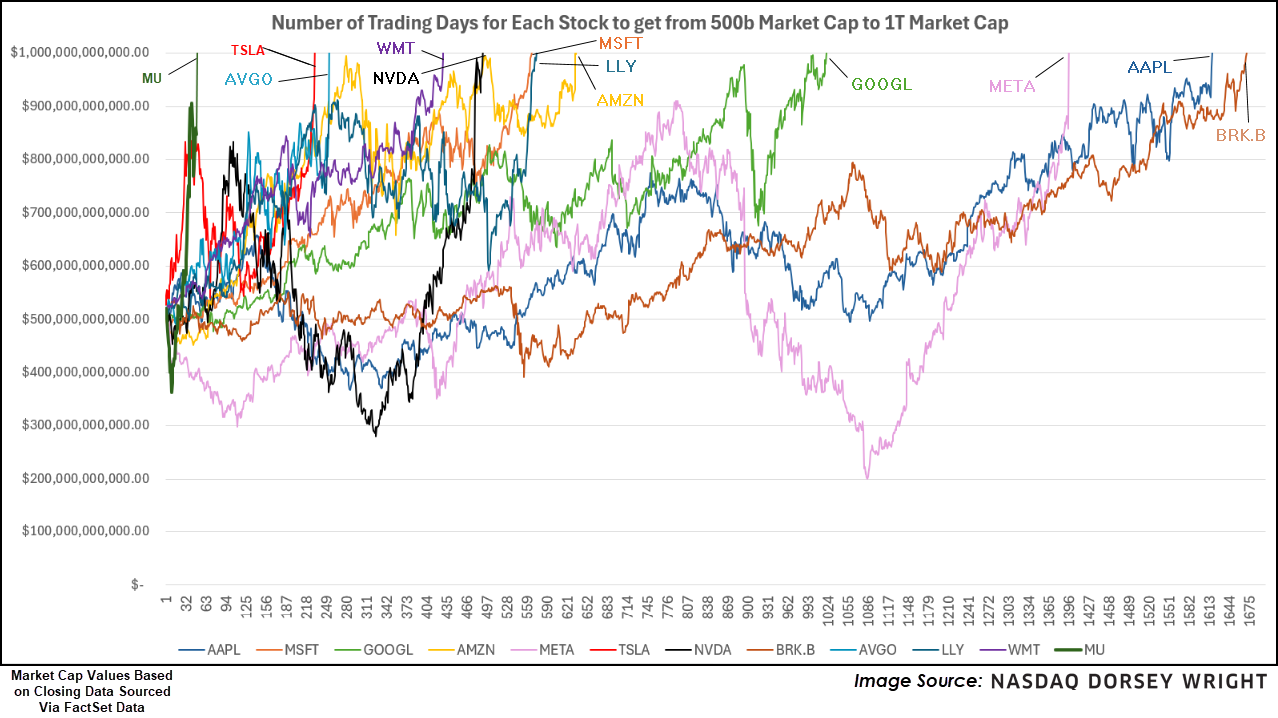
Of course, just because it “feels” as such, doesn’t mean that a pullback is required by any means. Markets can stay irrational for much longer than you can typically stay solvent betting on a turnaround in strength. In fact, most of momentum’s winners have similar return profiles, just not to the magnitude of absolute value created from a market cap perspective. All that to say, continue to watch the charts for signs of slowdown. Price will clue us in as to when things have gotten too extreme and will guide our hand with current allocation… after all, at this rate a $2T valuation is only 48 trading days away.
Each week the analysts at NDW review and comment on all major asset classes in the global markets. Shown below is the summary or snapshot of the primary technical indicators we follow for multiple areas. Should there be changes mid-week we will certainly bring these to your attention via the report.
| Universe | BP Col & Level (actual) | BP Rev Level | PT Col & Level (actual) | PT Rev Level | HiLo Col & Level (actual) | HiLo Rev Level | 10 Week Col & Level (actual) | 10 Week Rev Level | 30 Week Col & Level (actual) | 30 Week Rev Level |
|---|---|---|---|---|---|---|---|---|---|---|
| ALL |
|
46% |
|
42% |
|
58% |
|
46% |
|
48% |
| NYSE |
|
52% |
|
48% |
|
60% |
|
50% |
|
48% |
| OTC |
|
36% |
|
38% |
|
58% |
|
44% |
|
46% |
| World |
|
44% |
|
40% |
|
|
|
48% |
|
48% |

Remember, these are technical comments only. Just as you must be aware of fundamental data for the stocks we recommend based on technical criteria in the report, so too must you be aware of important data regarding delivery, market moving government releases, and other factors that may influence commodity pricing. We try to limit our technical comments to the most actively traded contracts in advance of delivery, but some contracts trade actively right up to delivery while others taper off well in advance. Be sure you check your dates before trading these contracts. For questions regarding this section or additional coverage of commodities email james.west@nasdaq.com.
Data represented in the table below is through 5/26/26:
| Symbol | Name | Price | PnF Trend | RS Signal | RS Col. | 200 Day MA | Weekly Mom |
|---|---|---|---|---|---|---|---|
| CL/ | Crude Oil Continuous | 93.89 | Positive | Sell | X | 71.54 | - 8W |
| DBLCIX | Deutsche Bank Liquid Commodities Index | 468.52 | Positive | Sell | O | 460.74 | - 46W |
| DWACOMMOD | NDW Continuous Commodity Index | 1199.10 | Positive | Buy | X | 1078.55 | - 1W |
| GC/ | Gold Continuous | 4502.30 | Positive | Buy | O | 4355.22 | - 3W |
| HG/ | Copper Continuous | 6.37 | Positive | Sell | X | 5.41 | + 7W |
| ZG/ | Corn (Electronic Day Session) Continuous | 457.50 | Positive | Sell | O | 434.55 | + 4W |

Average Level
36.80
| < - -100 | -100 - -80 | -80 - -60 | -60 - -40 | -40 - -20 | -20 - 0 | 0 - 20 | 20 - 40 | 40 - 60 | 60 - 80 | 80 - 100 | 100 - > |
|---|---|---|---|---|---|---|---|---|---|---|---|
|
Buy signalEEM
|
|||||||||||
|
Sell signalief
|
Sell signalagg
|
Buy signalefa
|
Buy signalrsp
|
Buy signalXLG
|
|||||||
|
Sell signalgld
|
Buy signalfxe
|
Sell signaldx/y
|
Buy signalicf
|
Buy signalijr
|
Buy signalVOOG
|
||||||
|
Sell signaltlt
|
Buy signalGSG
|
Sell signalUSO
|
Buy signalGCC
|
Buy signalIJH
|
Buy signalVOOV
|
Buy signalSPY
|
|||||
|
Sell signalshy
|
Sell signallqd
|
Buy signalhyg
|
Buy signaldvy
|
Sell signaldia
|
Buy signaliwm
|
Buy signalONEQ
|
Buy signalQQQ
|
||||
| < - -100 | -100 - -80 | -80 - -60 | -60 - -40 | -40 - -20 | -20 - 0 | 0 - 20 | 20 - 40 | 40 - 60 | 60 - 80 | 80 - 100 | 100 - > |
| AGG | iShares US Core Bond ETF |
| USO | United States Oil Fund |
| DIA | SPDR Dow Jones Industrial Average ETF |
| DVY | iShares Dow Jones Select Dividend Index ETF |
| DX/Y | NYCE U.S.Dollar Index Spot |
| EFA | iShares MSCI EAFE ETF |
| FXE | Invesco CurrencyShares Euro Trust |
| GLD | SPDR Gold Trust |
| GSG | iShares S&P GSCI Commodity-Indexed Trust |
| HYG | iShares iBoxx $ High Yield Corporate Bond ETF |
| ICF | iShares Cohen & Steers Realty ETF |
| IEF | iShares Barclays 7-10 Yr. Tres. Bond ETF |
| LQD | iShares iBoxx $ Investment Grade Corp. Bond ETF |
| IJH | iShares S&P 400 MidCap Index Fund |
| ONEQ | Fidelity Nasdaq Composite Index Track |
| QQQ | Invesco QQQ Trust |
| RSP | Invesco S&P 500 Equal Weight ETF |
| IWM | iShares Russell 2000 Index ETF |
| SHY | iShares Barclays 1-3 Year Tres. Bond ETF |
| IJR | iShares S&P 600 SmallCap Index Fund |
| SPY | SPDR S&P 500 Index ETF Trust |
| TLT | iShares Barclays 20+ Year Treasury Bond ETF |
| GCC | WisdomTree Continuous Commodity Index Fund |
| VOOG | Vanguard S&P 500 Growth ETF |
| VOOV | Vanguard S&P 500 Value ETF |
| EEM | iShares MSCI Emerging Markets ETF |
| XLG | Invesco S&P 500 Top 50 ETF |

| Symbol | Company | Sector | Current Price | Action Price | Target | Stop | Notes |
|---|---|---|---|---|---|---|---|
| BPOP | Popular, Inc. | Banks | $152.09 | hi 130s - low 150s | 200 | 120 | 5 for 5'er, 18 of 174 in favored BANK sector matrix, LT pos peer & mkt RS, triple top, good R-R, 2% yield |
| GRMN | Garmin Ltd. | Leisure | $238.53 | mid 230s - mid 260s | 364 | 196 | 5 TA rating, LT pos trend and mkt RS buy, top 33% of LEIS sector matrix, buy-on-pullback |
| SBUX | Starbucks Corporation | Restaurants | $101.42 | hi 90s - mid 100s | 129 | 85 | 4 for 5'er, top 20% of REST sector matrix, mkt RS reversal to Xs, triple top, 2.35% yield |
| OSW | OneSpaWorld Holdings Ltd. | Leisure | $24.31 | 22 - 24 | 30.50 | 19 | 5 for 5'er, top half of LEIS sector matrix, LT pos peer & mkt RS, spread quintuple top |
| IMO | Imperial Oil Limited | Oil | $129.01 | mid 120s to mid 130s | 164 | 112 | 5 for 5'er; top quartile of Oil matrix; long term mkt and peer RS; Pos. Trend since May '25. |
| SKT | Tanger Inc. | Real Estate | $35.93 | mid-to-hi 30s | 48 | 31 | 5 for 5'er, top 25% of REAL sector matrix, LT pos peer & mkt RS, R-R~2.0, 3.2% yield |
| IBOC | International Bancshares Corporation | Banks | $73.04 | low-to-mid 70s | 93 | 63 | 4 for 5'er, favored BANK sector, LT pos peer & mkt RS, bearish signal reversal, R-R~2.0, 1.95% yield |
| MSGE | Madison Square Garden Entertainment Corp. | Leisure | $70.56 | 63 to 69 | 98 | 53 | 5 for 5'er since Nov. 2025; Top Decile of Leisure Matrix; Pos. Trend since May 2025; ATH 5/7. |
| LYV | Live Nation Entertainment Inc. | Leisure | $166.52 | low 160s to mid 170s | 202 | 142 | 4 for 5'er; Pos. Trend; Top Half of Leisure Matrix; Within one box of ATH. |
| MO | Altria Group Inc. | Food Beverages/Soap | $72.37 | low-to-mid 70s | 91 | 62 | 4 for 5'er, top quartile of FOOD sector matrix, one box from RS buy, bullish triangle, 5.9% yield |
| MPC | Marathon Petroleum Corp. | Oil Service | $248.05 | 240 - 260 | 360 | 208 | 4 for 5'er, pos. trend, top third of Oil Services matrix, pos. L-T Mkt and Peer RS. |
| CELC | Celcuity Inc. | Biomedics/Genetics | $134.25 | low $130 - low $140 | 216 | 116 | 5/5'er since Oct. '25, pos. trend, top quintile of Biom. matrix, R-R > 5. |
| VLO | Valero Energy Corp | Oil Service | $241.45 | mid 230s - hi 250s | 328 | 212 | 4 TA rating, top 50% of OILS sector matrix, LT pos trend, buy-on-pullback |
| C | Citigroup, Inc. | Banks | $126.86 | low 120s - low 130s | 188 | 102 | 5 for 5'er since July '25; top decile of Banks matrix; pos. trend since May '25. |
| AMAT | Applied Materials, Inc. | Semiconductors | $454.89 | 420s - low 450s | 576 | 376 | 4 for 5'er, favored SEMI sector matrix, LT pos peer & mkt RS, shakeout --> triple top, good R-R |
| Symbol | Company | Sector | Current Price | Action Price | Target | Stop | Notes |
|---|
| Symbol | Company | Sector | Current Price | Action Price | Target | Stop | Notes |
|---|---|---|---|---|---|---|---|
| CGNX | Cognex Corp | Electronics | $68.35 | low-to-mid 50s | 75 | 52 | CGNX has moved into heavily overbought territory. OK to hold here. Raise stop to $59. |
| Comment | |||||||
|---|---|---|---|---|---|---|---|
|
|
|||||||
AMAT Applied Materials, Inc. R ($444.78) - Semiconductors - AMAT is a 4 for 5'er that that belongs to the favored semiconductors matrix and has been on peer and market RS buy signals since 2016 and 2023, respectively. In Tuesday's trading, AMAT completed a shakeout pattern when it broke a triple top at $456. Long exposure may be added in the $420s to low $450s and we will set our initial stop at $376, a potential spread triple bottom break on AMAT's chart. We will use the bullish price objective, $576, as our target price, giving us a reward-to-risk ratio approaching 2.0.
| 456.00 | X | 456.00 | |||||||||||||||||||||||||||
| 448.00 | X | X | X | 448.00 | |||||||||||||||||||||||||
| 440.00 | X | O | X | O | X | 440.00 | |||||||||||||||||||||||
| 432.00 | X | X | O | X | O | X | 432.00 | ||||||||||||||||||||||
| 424.00 | X | O | X | O | O | X | 424.00 | ||||||||||||||||||||||
| 416.00 | X | X | O | X | O | X | 416.00 | ||||||||||||||||||||||
| 408.00 | X | O | X | O | O | X | 408.00 | ||||||||||||||||||||||
| 400.00 | X | X | O | 5 | O | 400.00 | |||||||||||||||||||||||
| 396.00 | X | O | X | O | X | 396.00 | |||||||||||||||||||||||
| 392.00 | X | X | O | X | O | X | Mid | 392.00 | |||||||||||||||||||||
| 388.00 | X | O | X | O | X | O | X | 388.00 | |||||||||||||||||||||
| 384.00 | X | O | X | O | X | O | X | 384.00 | |||||||||||||||||||||
| 380.00 | X | O | X | O | O | 380.00 | |||||||||||||||||||||||
| 376.00 | X | X | O | X | X | 376.00 | |||||||||||||||||||||||
| 372.00 | X | O | X | O | X | O | X | 372.00 | |||||||||||||||||||||
| 368.00 | X | O | X | O | X | O | X | 368.00 | |||||||||||||||||||||
| 364.00 | X | O | X | 3 | X | O | X | 364.00 | |||||||||||||||||||||
| 360.00 | X | O | X | O | X | O | X | 360.00 | |||||||||||||||||||||
| 356.00 | X | O | X | O | X | X | O | X | X | 356.00 | |||||||||||||||||||
| 352.00 | X | O | X | O | X | X | O | X | O | X | O | X | 352.00 | ||||||||||||||||
| 348.00 | X | O | O | X | O | X | O | X | O | X | O | X | 348.00 | ||||||||||||||||
| 344.00 | X | X | O | X | O | X | O | X | O | 4 | O | X | 344.00 | ||||||||||||||||
| 340.00 | O | X | O | X | O | X | O | X | O | O | X | O | 340.00 | ||||||||||||||||
| 336.00 | O | X | O | X | O | X | O | O | X | 336.00 | |||||||||||||||||||
| 332.00 | O | X | O | X | O | X | O | X | 332.00 | ||||||||||||||||||||
| 328.00 | O | X | O | O | X | O | X | 328.00 | |||||||||||||||||||||
| 324.00 | O | X | O | X | O | 324.00 | |||||||||||||||||||||||
| 320.00 | 2 | X | O | 320.00 | |||||||||||||||||||||||||
| 316.00 | O | X | 316.00 | ||||||||||||||||||||||||||
| 312.00 | O | X | 312.00 | ||||||||||||||||||||||||||
| 308.00 | O | X | 308.00 | ||||||||||||||||||||||||||
| 304.00 | O | X | 304.00 | ||||||||||||||||||||||||||
| 300.00 | O | X | 300.00 | ||||||||||||||||||||||||||
| 296.00 | O | X | 296.00 | ||||||||||||||||||||||||||
| 292.00 | O | X | Bot | 292.00 | |||||||||||||||||||||||||
| 288.00 | O | • | 288.00 |
| BSX Boston Scientific Corporation ($50.35) - Healthcare - BSX moved lower to complete a double bottom break at $52, marking its third consecutive sell signal. The 2 for 5'er ranks near the bottom of the healthcare sector matrix. The weekly OBOS indicates that the stock is in oversold territory, so wait for a pullback before selling your position. Initial strong resistance is at $58, with additional resistance at $66. |
| DVN Devon Energy Corporation ($44.73) - Oil - DVN fell to a sell signal Wednesday when it broke a double bottom at $44, where it now sits against its bullish support line. The outlook for the stock remains positive, however, as DVN is a 4 for 5'er that ranks in the top half of the favored oil sector matrix. Multiple levels of overhead resistance exist between $50 and $52. |
| DY Dycom Industries Inc ($538.29) - Building - DY reversed into Xs and broke a double top at $456 as shares rallied to an all-time chart high at $560. The stock has been a 5 for 5'er since May of 2025 and currently ranks within the top quartile of the Building sector matrix. Given the extension into overbought territory, those seeking exposure to the stock will look for consolidation and a normalization of the 10-week trading band before considering. Prior resistance at $464 may be seen as initial support, while additional lies at $400. |
| MUR Murphy Oil Corp ($35.88) - Oil - MUR fell to a sell signal and a negative trend Wednesday when it completed a bearish triangle at $36, where it now sits against support, Wednesday's move adds to an already weak technical picture as the negative trend change will drop MUR to a 1 for 5'er. |
| SCHW The Charles Schwab Corporation ($85.95) - Wall Street - SCHW shares fell today to break a triple bottom at $87 to mark its first sell signal. This 3 for 5'er entered a negative trend in April but remains on an RS buy signal versus the market since May 2025. SCHW shares are trading below the middle of the ten-week trading band with a weekly overbought/oversold reading of -25%. From here, support is offered at $74. |
| TGT Target Corporation ($129.12) - Retailing - TGT broke a double top at $128 for a third buy signal as shares rallied to $130. The stock has been a 3 for 5'er since February of this year and currently ranks within the top quartile of the Retailing sector matrix. From here, a move to the mid $130s would mark the highest chart level since early 2025. |
The option suggestions featured here are pulled from the NDW Options Ideas tool. These are just a sample of the ideas that can be found there. The Options Idea tool contains numerous additional income and speculative plays. It also offers relative strength-based screens targeting the highest (and lowest) relative strength stocks and ETFs that have recently moved counter to their longer-term trend. To access or subscribe to the Options Ideas tool click here.
Call
Merck & Co (MRK) Aug. 21 $120 Call

| Additional Data: | |
| Bid/Ask Spread | 1.97% |
| Delta | 56.97 |
| Gamma | 2.30 |
| Implied Volatility | 30.68% |
| Expiry Days | 86 |
| Earnings Date | 8/4/2026 |
Put
Servicenow (NOW) Aug 21 $105 Put

| Additional Data: | |
| Bid/Ask Spread | 3.08% |
| Delta | -45.46 |
| Gamma | 1.26 |
| Implied Volatility | 63.95% |
| Expiry Days | 86 |
| Earnings Date | 7/22/2026 |
Income (Covered Call)
The TJX Companies (TJX) Jul $165 Covered Call

| Additional Data: | |
| Bid/Ask Spread | 11.90% |
| Delta | 70.49 |
| Gamma | -2.77 |
| Implied Volatility | 21.48% |
| Expiry Days | 51 |
| Earnings Date | 8/19/2026 |
Daily Equity & Market Analysis
Loading, Please Wait...

