We take look at one chart that stood out after this recent volatility over the past week and also cover information and registration for the DWA State of the Market Webinar and the Spring 2016 Point & Figure Institute.
Spring 2016 Point & Figure Institute | Las Vegas, NV | April 21st & 22nd | Event Agenda | Registration |

DWA State of the Market & Q1 2016 Update Webinar
On Thursday, January 21st at 12:00PM EST, Dorsey Wright will conduct a webinar to discuss the current state of the market as we begin Q1 2016. The relative strength strategies behind the growing line of products that follow DWA indexes and models will also be covered, as well as practical implementation ideas for using these products. We like to hold these calls at the beginning of each quarter, as that is when we reconstitute our Technical Leaders Indexes, which are tracked by the 14 PowerShares ETFs. Tammy DeRosier, President of DWA, and John Lewis, Vice President and Portfolio Manager, will host the discussion. There is no cost to attend the webinar, but space is limited and registration is required. A replay will be made available to all registrants.
Click here to reserve your spot today! The password is: pnfpnf
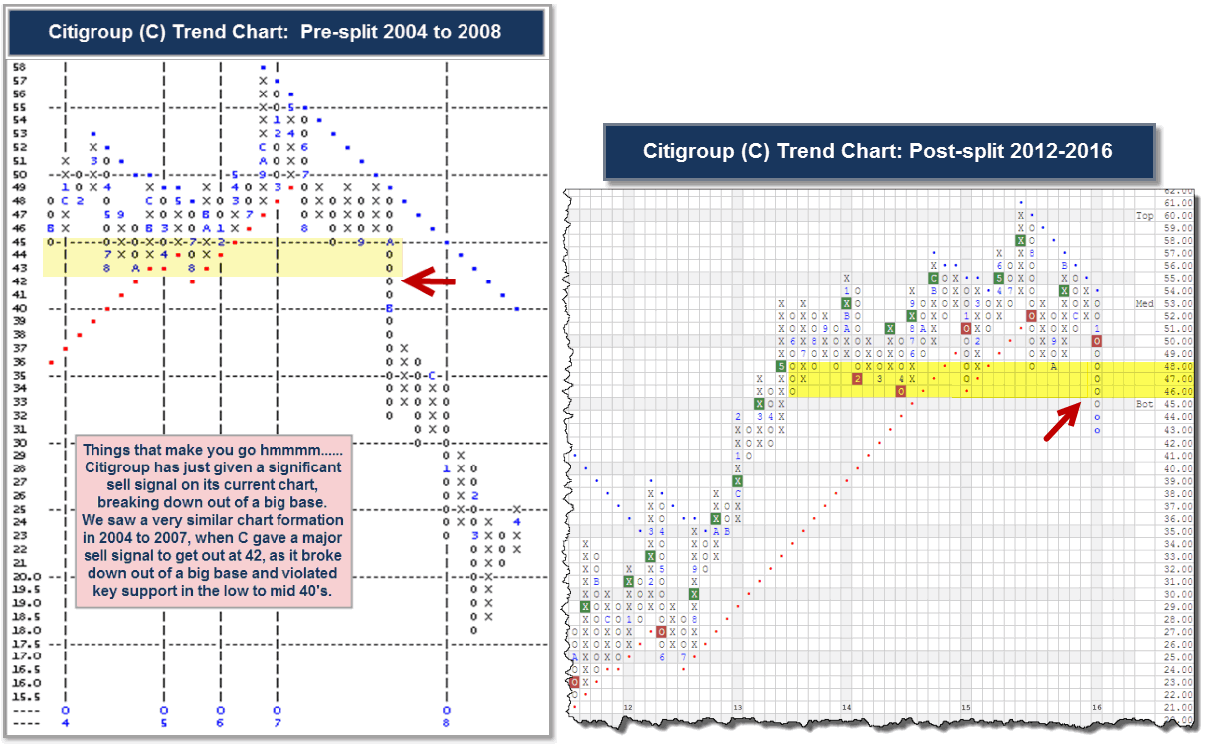
While looking through the charts the other day, reviewing the aftermath of this past week's volatility, one chart ominously stood out - Citigroup, Inc. C. During the recent market rout, C manged to stay out of the headlines, unlike the 2008 financial crisis and market meltdown. So why bring it up today? Well, if you look at C's chart today, which features a recent trendline violation and big base breakdown, and compare it to C's 2007 collapse, the two charts from the two different periods look quite similar. Between 2004 and 2007, we saw C forming a big base before ultimately breaking down in late 2007. C peaked in December 2006, before trading lower, and then broke through the trendline at $48 (pre-split price levels) before falling to the low 40's. It was around this region where considerable support had formed, going back to 2004. Ultimately, we know what happened, C broke through all of the support, starting with a triple bottom break in October 2008 at $44, then a violation of the 2004-2005 support lows with the move to $42. Fast-forward eight years, the chart is set up in almost the exact same manner, which does not leave one with a warm fuzzy feeling. After peaking in July 2015, C began to work down from the top, trading lower and violating its bullish support line. C managed to regain some demand, rallied up to the trendline, just like it did back in 2007, but failed to penetrate the bearish resistance line (just like it did back in 2007, sorry for the repetition). All the while, it was forming a big base that dates back to 2013. With the recent market action, C fell even further, violating support in the 46 to 48 region, echoing the 2007 breakdown (sidebar: the breakdown also occurred around similar price levels). The charts below show you exactly how and where the breakdowns occurred. As you can see, the charts look similar. Hopefully this isn't a major tell for the market and is rather just some coincidence, but it certainly makes you go, "Hmmmmm...."