Most Requested Symbols


There are no changes within any of the Dorsey Wright State Street Models this week, as each of the current holdings continue to maintain positive relative strength within their respective universes.
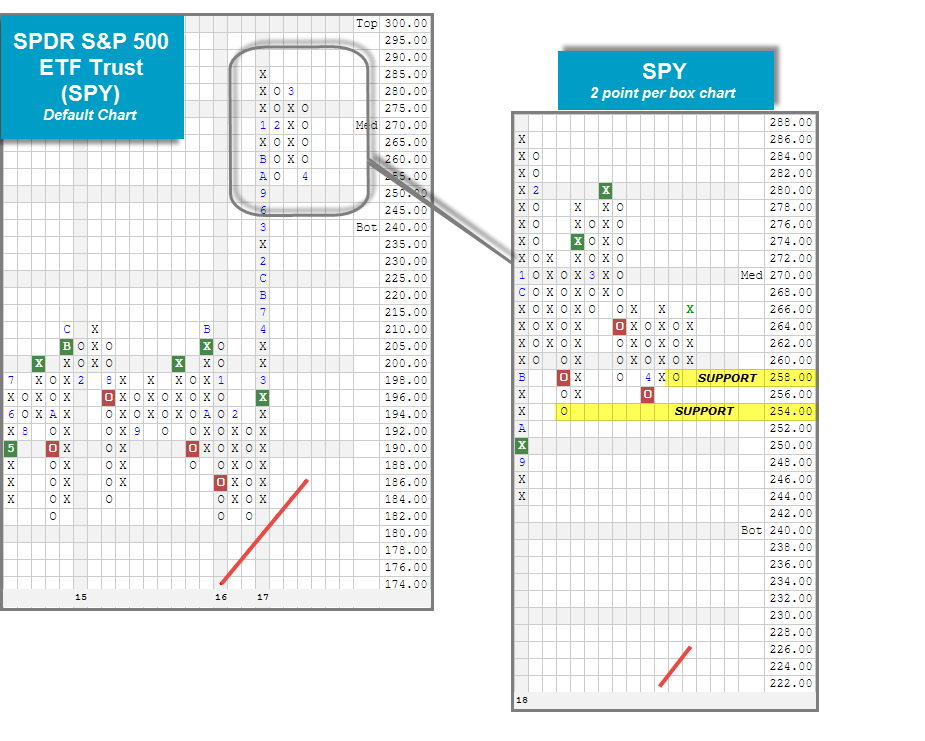
After a seemingly volatility-free year for equities in 2017, volatility has returned with a roar as the VIX now sits in the mid 20’s after averaging around 12 just last year. As a result, we have seen a majority of the major market ETFs, such as the SPDR S&P 500 ETF Trust SPY, undergo pullbacks to or close to their respective February correction lows. Today we wanted to remind users of the importance of identifying and monitoring support levels using Point & Figure charts. Identifying support levels is important because it provides guidance when assessing these funds moving forward, and helps with developing a plan of action. Remember, if we want to get a closer look at the near-term action, we can always utilize a more sensitive scale to give us a different perspective of what is happening. Looking to the default trend chart below, we find that SPY has pulled back to its February low of $255 with last week’s market action. This left it just one box away from a potential sell signal, which would mark the first in over two years. However, when we examine the more sensitive 2 point per box chart, we can see that SPY has in fact has broken down in the near term; however, the selling pressure hasn’t yet pushed the fund to its February low levels. In fact, after Tuesday's (4/10) market action, SPY is just one box from a triple top buy signal which would come with a move to $268, and would mark the first buy signal on the 2 point chart since falling to a sell signal on March 22nd. From here, a move to $256 would mark the third consecutive sell signal while a move to $252 would take out all near-term support. We will continue to monitor these key support levels going forward and encourage those of you with exposure to take advantage of the alerts on the platform to stay up to date!

Like a radar screen, the Weekly Activity Summary gives you a snap shot view of any technical changes to the State Street universe of ETFs. Included in the summary below are both long term technical changes and intermediate term technical changes.
| Symbol | Name | Price | Score | 30 Day Rtn | 90 Day Rtn | YTD Rtn |
|---|---|---|---|---|---|---|
| XOP | SPDR S&P Oil & Gas Exploration & Production ETF | 36.170 | 2.4245 | 4.026 | -6.003 | -2.717 |
| Symbol | Name | Price | Score | 30 Day Rtn | 90 Day Rtn | YTD Rtn |
|---|---|---|---|---|---|---|
| XTL | SPDR S&P Telecom ETF | 70.840 | 3.0327 | -3.409 | 2.563 | 3.689 |
| Symbol | Name | Price | Score | 30 Day Rtn | 90 Day Rtn | YTD Rtn |
|---|---|---|---|---|---|---|
| HYMB | SPDR Nuveen S&P High Yield Municipal Bond ETF | 55.670 | 1.8297 | 0.906 | 0.000 | 0.018 |
| QGBR | SPDR MSCI United Kingdom StrategicFactors ETF | 55.390 | 3.5688 | 3.836 | 2.367 | 2.860 |
| Symbol | Name | Price | Score | 30 Day Rtn | 90 Day Rtn | YTD Rtn |
|---|---|---|---|---|---|---|
| BIL | SPDR Bloomberg Barclays 1-3 Month T-Bill ETF | 91.460 | 1.7110 | 0.000 | 0.011 | 0.066 |
| EBND | SPDR Bloomberg Barclays Emerging Markets Local Bond ETF | 29.930 | 3.3189 | -0.763 | -0.664 | 0.842 |
| KCE | SPDR S&P Capital Markets ETF | 58.227 | 4.3537 | -6.672 | -2.188 | 0.496 |
| KRE | SPDR S&P Regional Banking ETF | 60.490 | 5.0202 | -6.981 | -1.257 | 2.787 |
| XLE | Energy Select Sector SPDR Fund | 69.910 | 2.3797 | 2.133 | -6.960 | -3.252 |
| XPH | SPDR S&P Pharmaceuticals ETF | 42.020 | 1.6745 | -3.954 | -6.163 | -3.402 |
| Symbol | Name | Price | Score | 30 Day Rtn | 90 Day Rtn | YTD Rtn |
|---|---|---|---|---|---|---|
| XLE | Energy Select Sector SPDR Fund | 69.910 | 2.3797 | 2.133 | -6.960 | -3.252 |
| XBI | SPDR S&P Biotech ETF | 88.470 | 4.5291 | -8.274 | -0.135 | 4.242 |
| XES | SPDR S&P Oil & Gas Equipment & Services ETF | 15.520 | 0.3246 | -0.385 | -16.244 | -9.399 |
| Symbol | Name | Price | Score | 30 Day Rtn | 90 Day Rtn | YTD Rtn |
|---|---|---|---|---|---|---|
| XTL | SPDR S&P Telecom ETF | 70.840 | 3.0327 | -3.409 | 2.563 | 3.689 |
| Symbol | Name | Price | Score | 30 Day Rtn | 90 Day Rtn | YTD Rtn |
|---|---|---|---|---|---|---|
| GLD | SPDR Gold Trust | 127.120 | 3.5254 | 1.259 | 1.672 | 2.806 |
| BWX | SPDR Bloomberg Barclays International Treasury Bond ETF | 29.470 | 3.9204 | 1.063 | 3.186 | 3.658 |
| GNR | SPDR S&P Global Natural Resources ETF | 49.420 | 4.2525 | 0.366 | -2.965 | 0.713 |
| SJNK | SPDR Bloomberg Barclays Capital Short Term High Yield Bond ETF | 27.390 | 0.7980 | -0.255 | -0.904 | -0.617 |
| SRLN | SPDR Blackstone / GSO Senior Loan ETF | 47.300 | 1.4407 | 0.021 | -0.106 | 0.254 |
| WDIV | The SPDR S&P Global Dividend ETF | 69.080 | 2.7443 | -1.299 | -2.594 | -2.498 |
| Symbol | Name | Price | Score | 30 Day Rtn | 90 Day Rtn | YTD Rtn |
|---|---|---|---|---|---|---|
| BIL | SPDR Bloomberg Barclays 1-3 Month T-Bill ETF | 91.460 | 1.7110 | 0.000 | 0.011 | 0.066 |
| KIE | SPDR S&P Insurance ETF | 30.800 | 3.9586 | -3.690 | 0.195 | 0.326 |
| PSK | SPDR Wells Fargo Preferred Stock ETF | 42.940 | 2.1048 | -0.946 | -1.963 | -2.498 |
| SLYV | SPDR S&P 600 Small Cap Value ETF | 125.240 | 2.7861 | -2.049 | -1.587 | -0.390 |
| SMLV | SPDR SSGA US Small Cap Low Volatility Index ETF | 89.373 | 3.3121 | -1.647 | -2.046 | -2.164 |
The distribution curve places each ETF on a bell curve according to their respective degrees of overbought or oversold status using a 10-week distribution. ETFs that are statistically oversold will appear on the left-hand side of the bell curve, while those that have become statistically overbought will appear on the right-hand side of the bell curve. Perhaps the most useful attribute of this feature is that it displays the entire universe on the curve at one time with an "average level" to give us a general picture of whether the State Street ETF universe is generally overbought on a near-term basis, or generally oversold. Our best opportunities are to buy strong market ETFs that have regressed back toward mean conditions based on market weakness, or have become oversold based upon extreme market weakness.
Weekly Distribution is a short-term gauge that is most helpful in timing entry and exit points, while the longer-term information of trend and relative strength is a more controlling factor in the decision of whether to buy or sell. The Distribution Curve below displays those ETFs with positive RS in uppercase letters and those ETFs with poor RS versus the market in lowercase letters. As well, those ETFs that are on a Point & Figure Buy signal appear in Green letters, while those on Sell signals can appear in Red letters.
The average Bullish Percent reading this week is 45.56% up 1.89% from the previous week
| -100--80 | -80--60 | -60--40 | -40--20 | -20-0 | 0-20 | 20-40 | 40-60 | 60-80 | 80-100 | 100-> | ||||
 | ||||||||||||||

The DWA Matrix uses a Point & Figure relative strength comparison of each index to one another to identify the strongest and the weakest among the universe used. The ETFs with the most relative strength buy signals (suggesting outperformance) versus the others in the group are listed at the top. These ETFs should be overweighted in the portfolio. Those ETFs with the least amount of relative strength buy signals versus the others in the group are listed at the bottom. These ETFs should be underweighted in the portfolio.
| Ticker | Name | Buys | Xs | Tech Attribute/ Score |
|---|---|---|---|---|
| MDYG | SPDR S&P 400 Mid Cap Growth ETF | 14 | 11 | 4.24 |
| SPYG | SPDR S&P 500 Growth ETF | 13 | 16 | 5.27 |
| DIA | SPDR Dow Jones Industrial Average ETF Trust | 12 | 14 | 3.55 |
| MDY | SPDR S&P MIDCAP 400 ETF Trust | 12 | 11 | 4.53 |
| SLYG | SPDR S&P 600 Small Cap Growth ETF | 12 | 8 | 4.32 |
| SLY | SPDR S&P 600 Small Cap ETF | 10 | 6 | 4.32 |
| SPLG | SPDR Portfolio Large Cap ETF | 9 | 11 | 2.88 |
| SPTM | SPDR Portfolio Total Stock Market ETF | 9 | 8 | 2.94 |
| MDYV | SPDR S&P 400 Mid Cap Value ETF | 9 | 4 | 3.47 |
| SPY | SPDR S&P 500 ETF Trust | 7 | 13 | 2.55 |
| SPMD | SPDR Portfolio Mid Cap ETF | 5 | 5 | 3.20 |
| SLYV | SPDR S&P 600 Small Cap Value ETF | 4 | 2 | 2.79 |
| SDY | SPDR S&P Dividend ETF | 4 | 0 | 2.05 |
| SPYV | SPDR S&P 500 Value ETF | 3 | 1 | 1.99 |
| CWI | SPDR MSCI ACWI ex-US ETF | 2 | 10 | 3.32 |
| DGT | SPDR DJ Global Titans ETF | 1 | 10 | 2.69 |
| GLD | SPDR Gold Trust | 0 | 6 | 3.53 |
Ticker
Name
Buys
Xs
Tech
Attribute/
Score
GXC
SPDR S&P China ETF
15
15
5.28
DIA
SPDR Dow Jones Industrial Average ETF Trust
14
12
3.55
GMF
SPDR S&P Emerging Asia Pacific ETF
13
14
5.38
GWX
SPDR S&P International Small Cap ETF
11
9
4.32
SPY
SPDR S&P 500 ETF Trust
11
9
2.55
SPEM
SPDR Portfolio Emerging Markets ETF
9
12
5.35
EWX
SPDR S&P Emerging SmallCap
7
11
5.15
DGT
SPDR DJ Global Titans ETF
7
8
2.69
SPDW
SPDR Portfolio Developed World ex-US ETF
7
7
4.14
CWI
SPDR MSCI ACWI ex-US ETF
7
5
3.32
GII
The SPDR FTSE/Macquarie Global Infrastructure 100
5
2
2.02
FEZ
SPDR EURO STOXX 50 ETF
4
8
4.22
RWO
SPDR DJ Wilshire Global Real Estate
4
0
1.96
RWX
SPDR DJ Wilshire International Real Estate ETF
2
1
3.45
FEU
SPDR STOXX Europe 50 ETF
1
4
2.71
DWX
SPDR S&P International Dividend
0
2
1.98
| Ticker | Name | Buys | Xs | Tech Attribute/ Score |
|---|---|---|---|---|
| XNTK | SPDR NYSE Technology ETF | 28 | 23 | 5.25 |
| XBI | SPDR S&P Biotech ETF | 27 | 13 | 4.53 |
| XAR | SPDR S&P Aerospace & Defense ETF | 26 | 26 | 5.71 |
| KRE | SPDR S&P Regional Banking ETF | 25 | 22 | 5.02 |
| XSD | SPDR S&P Semiconductor ETF | 24 | 10 | 3.95 |
| XME | SPDR S&P Metals & Mining ETF | 24 | 7 | 4.57 |
| XSW | SPDR S&P Software & Services ETF | 23 | 26 | 5.70 |
| KBE | SPDR S&P Bank ETF | 23 | 18 | 4.47 |
| XLK | Technology Select Sector SPDR Fund | 22 | 20 | 5.29 |
| XTN | SPDR S&P Transportation ETF | 21 | 14 | 4.57 |
| XHE | SPDR S&P Health Care Equipment ETF | 20 | 23 | 5.76 |
| XLF | Financial Select Sector SPDR Fund | 19 | 18 | 4.97 |
| KCE | SPDR S&P Capital Markets ETF | 18 | 25 | 4.35 |
| XLI | Industrial Select Sector SPDR Fund | 18 | 14 | 3.06 |
| KIE | SPDR S&P Insurance ETF | 18 | 13 | 3.96 |
| XLY | Consumer Discretionary Select Sector SPDR Fund | 17 | 21 | 4.05 |
| XTL | SPDR S&P Telecom ETF | 13 | 16 | 3.03 |
| XLB | Materials Select Sector SPDR Fund | 13 | 5 | 2.98 |
| XLV | Health Care Select Sector SPDR Fund | 12 | 10 | 3.74 |
| XHB | SPDR S&P Homebuilders ETF | 11 | 8 | 4.44 |
| XHS | SPDR S&P Health Care Services ETF | 9 | 19 | 3.79 |
| GLD | SPDR Gold Trust | 7 | 25 | 3.53 |
| XLU | Utilities Select Sector SPDR Fund | 7 | 19 | 2.14 |
| XLE | Energy Select Sector SPDR Fund | 7 | 5 | 2.38 |
| XPH | SPDR S&P Pharmaceuticals ETF | 7 | 5 | 1.67 |
| XES | SPDR S&P Oil & Gas Equipment & Services ETF | 7 | 1 | 0.32 |
| XRT | SPDR S&P Retail ETF | 6 | 14 | 3.93 |
| XLP | Consumer Staples Select Sector SPDR Fund | 5 | 4 | 1.15 |
| XOP | SPDR S&P Oil & Gas Exploration & Production ETF | 3 | 21 | 2.42 |
| RWO | SPDR DJ Wilshire Global Real Estate | 2 | 11 | 1.96 |
| RWR | SPDR Dow Jones REIT ETF | 1 | 9 | 0.40 |
| Ticker | Name | Buys | Xs | Tech Attribute/ Score |
|---|---|---|---|---|
| IBND | SPDR Bloomberg Barclays International Corporate Bond ETF | 19 | 18 | 3.74 |
| EBND | SPDR Bloomberg Barclays Emerging Markets Local Bond ETF | 19 | 12 | 3.32 |
| BWX | SPDR Bloomberg Barclays International Treasury Bond ETF | 18 | 18 | 3.92 |
| WIP | SPDR Citi International Government Inflation-Protected Bond ETF | 18 | 14 | 4.00 |
| BWZ | SPDR Bloomberg Barclays Short Term International Treasury Bond ETF | 16 | 18 | 3.87 |
| JNK | SPDR Bloomberg Barclays High Yield Bond ETF | 13 | 9 | 1.22 |
| SPLB | SPDR Portfolio Long Term Corporate Bond ETF | 13 | 1 | 0.71 |
| CWB | SPDR Bloomberg Barclays Convertible Bond ETF | 13 | 0 | 2.50 |
| TFI | SPDR Nuveen Bloomberg Barclays Municipal Bond ETF | 11 | 11 | 1.59 |
| IPE | SPDR Bloomberg Barclays TIPS ETF | 10 | 7 | 0.67 |
| PSK | SPDR Wells Fargo Preferred Stock ETF | 8 | 17 | 2.10 |
| BIL | SPDR Bloomberg Barclays 1-3 Month T-Bill ETF | 8 | 12 | 1.71 |
| SPIB | SPDR Portfolio Intermediate Term Corporate Bond ETF | 8 | 9 | 1.21 |
| FLRN | SPDR Bloomberg Barclays Investment Grade Floating Rate ETF | 7 | 13 | 1.26 |
| SPSB | SPDR Portfolio Short Term Corporate Bond ETF | 7 | 9 | 2.12 |
| SHM | SPDR Nuveen Bloomberg Barclays Short Term Municipal Bond ETF | 7 | 8 | 1.94 |
| SRLN | SPDR Blackstone / GSO Senior Loan ETF | 6 | 13 | 1.44 |
| SPAB | SPDR Portfolio Aggregate Bond ETF | 4 | 5 | 0.22 |
| ITE | SPDR Bloomberg Barclays Intermediate Term Treasury ETF | 4 | 4 | 0.50 |
| SPTL | SPDR Portfolio Long Term Treasury ETF | 1 | 16 | 0.71 |
| MBG | SPDR Bloomberg Barclays Mortgage Backed Bond ETF | 1 | 2 | 1.34 |
The State Street ETF Model Portfolios are designed to identify major leadership themes within a market, doing so through the use of Point and Figure relative strength tools. Each of the State Street Models are evaluated weekly and guided by a rules-based investment methodology. The construction of the State Street Sector ETF Portfolio is done through an analysis of the each State Street Sector ETF relative strength chart versus the S&P 500, while the Global Sector Rotation model employs a relative strength matrix ranking of the model's inventory. In either case, those with strong relative strength make the cut and are eligible to be included in the portfolio, while those that aren't, will sit upon the sideline. For more information on the portfolio construction and back testing please see the information files on the Models Page. To enter a portfolio amount and see shares to be purchased as well as modify the portfolio to your specifications, click here. (Note: All State Street ETF Models are updated Wednesday mornings by 9:30 am EST)
| ETF Name | Symbol | DWA Suggested Weighting | Yield | Date Added |
|---|---|---|---|---|
| SPDR NYSE Technology ETF | XNTK | 6.250% | 0.5430 | 03/11/2009 |
| SPDR S&P Bank ETF | KBE | 6.250% | 1.4500 | 11/15/2016 |
| SPDR S&P Capital Markets ETF | KCE | 6.250% | 1.8950 | 12/05/2017 |
| SPDR S&P Insurance ETF | KIE | 6.250% | 3.0630 | 03/19/2013 |
| SPDR S&P Regional Banking ETF | KRE | 6.250% | 1.4140 | 11/15/2016 |
| Financial Select Sector SPDR Fund | XLF | 6.250% | 1.5470 | 11/15/2016 |
| Industrial Select Sector SPDR Fund | XLI | 6.250% | 1.8310 | 05/04/2010 |
| Technology Select Sector SPDR Fund | XLK | 6.250% | 1.3440 | 02/25/2009 |
| Health Care Select Sector SPDR Fund | XLV | 6.250% | 1.5150 | 01/28/2014 |
| Consumer Discretionary Select Sector SPDR Fund | XLY | 6.250% | 1.2140 | 02/24/2010 |
| SPDR S&P Semiconductor ETF | XSD | 6.250% | 0.6100 | 02/25/2014 |
| SPDR S&P Biotech ETF | XBI | 6.250% | 0.2720 | 11/15/2016 |
| SPDR S&P Transportation ETF | XTN | 6.250% | 0.7240 | 11/15/2016 |
| SPDR S&P Health Care Equipment ETF | XHE | 6.250% | 0.0240 | 09/20/2016 |
| SPDR S&P Aerospace & Defense ETF | XAR | 6.250% | 0.7230 | 10/25/2011 |
| SPDR S&P Software & Services ETF | XSW | 6.250% | 0.1800 | 10/25/2011 |
* - Model Inception:1/17/2007
* - Model Inception:10/28/2008
State Street Targeted Sector Rotation Model SSTARGETSECTOR
ETF Name
Symbol
DWA Suggested Weighting
Yield
Date Added
SPDR NYSE Technology ETF
XNTK
20.000%
0.5430
10/25/2016
SPDR S&P Bank ETF
KBE
20.000%
1.4500
05/09/2017
SPDR S&P Regional Banking ETF
KRE
20.000%
1.4140
02/28/2017
SPDR S&P Semiconductor ETF
XSD
20.000%
0.6100
11/10/2015
SPDR S&P Aerospace & Defense ETF
XAR
20.000%
0.7230
07/15/2014
* - Model Inception: 07/28/2010
State Street Fixed Income Model SSFIXED
ETF Name
Symbol
DWA Suggested Weighting
Yield
Date Added
SPDR Bloomberg Barclays Convertible Bond ETF
CWB
25.000%
4.1110
08/23/2016
SPDR Bloomberg Barclays Emerging Markets Local Bond ETF
EBND
25.000%
2.9860
08/29/2017
SPDR Bloomberg Barclays International Corporate Bond ETF
IBND
25.000%
0.5000
02/06/2018
SPDR Citi International Government Inflation-Protected Bond ETF
WIP
25.000%
1.6660
02/13/2018
* - Model Inception: 04/27/2011
State Street (Wed.)
Loading, Please Wait...
