There are no changes within any of the Dorsey Wright State Street Models this week, as each of the current holdings continue to maintain positive relative strength within their respective universes. Today we review the near-term support levels on the chart of the SPDR S&P 500 Trust ETF (SPY).
There are no changes within any of the Dorsey Wright State Street Models this week, as each of the current holdings continue to maintain positive relative strength within their respective universes.
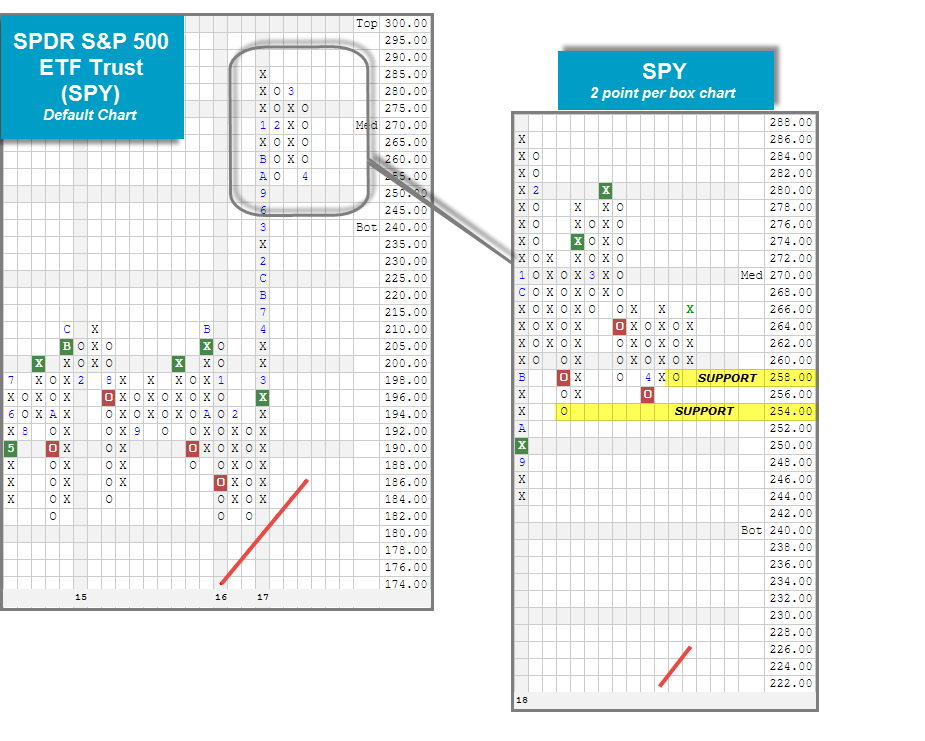
After a seemingly volatility-free year for equities in 2017, volatility has returned with a roar as the VIX now sits in the mid 20’s after averaging around 12 just last year. As a result, we have seen a majority of the major market ETFs, such as the SPDR S&P 500 ETF Trust SPY, undergo pullbacks to or close to their respective February correction lows. Today we wanted to remind users of the importance of identifying and monitoring support levels using Point & Figure charts. Identifying support levels is important because it provides guidance when assessing these funds moving forward, and helps with developing a plan of action. Remember, if we want to get a closer look at the near-term action, we can always utilize a more sensitive scale to give us a different perspective of what is happening. Looking to the default trend chart below, we find that SPY has pulled back to its February low of $255 with last week’s market action. This left it just one box away from a potential sell signal, which would mark the first in over two years. However, when we examine the more sensitive 2 point per box chart, we can see that SPY has in fact has broken down in the near term; however, the selling pressure hasn’t yet pushed the fund to its February low levels. In fact, after Tuesday's (4/10) market action, SPY is just one box from a triple top buy signal which would come with a move to $268, and would mark the first buy signal on the 2 point chart since falling to a sell signal on March 22nd. From here, a move to $256 would mark the third consecutive sell signal while a move to $252 would take out all near-term support. We will continue to monitor these key support levels going forward and encourage those of you with exposure to take advantage of the alerts on the platform to stay up to date!