Most Requested Symbols

The near‑term positive action for equities has led to improvements in short‑term indicators after deteriorating to their lowest levels in roughly 12 months.
In addition to providing one of the most dependable sporting events from a pure entertainment perspective, The Masters, which tees off on April 9th, provides a useful platform from which you can better communicate what it is you provide as an advisor.
Weekly Rundown Video – April 1, 2026
Weekly rundown with NDW analyst team covering all major asset classes.
Weekly rundown with NDW analyst team covering all major asset classes.
NDW is pleased to present our “Weight of the Evidence” heading into the second quarter of 2026. The document, approved for financial professionals and non-professionals alike, details key technical changes markets brought our way during the first quarter. Click here to download the report.
Trading from last week’s action into Monday has seen major U.S. equity indices move back into positive territory, ending streaks of negative weekly performance that began in the latter half of February. The Nasdaq‑100 (NDX) and Nasdaq Composite (NASD) have led the charge, each up 4.5% since 3/27, while the S&P 500 Index (SPX) has gained 3.82%.
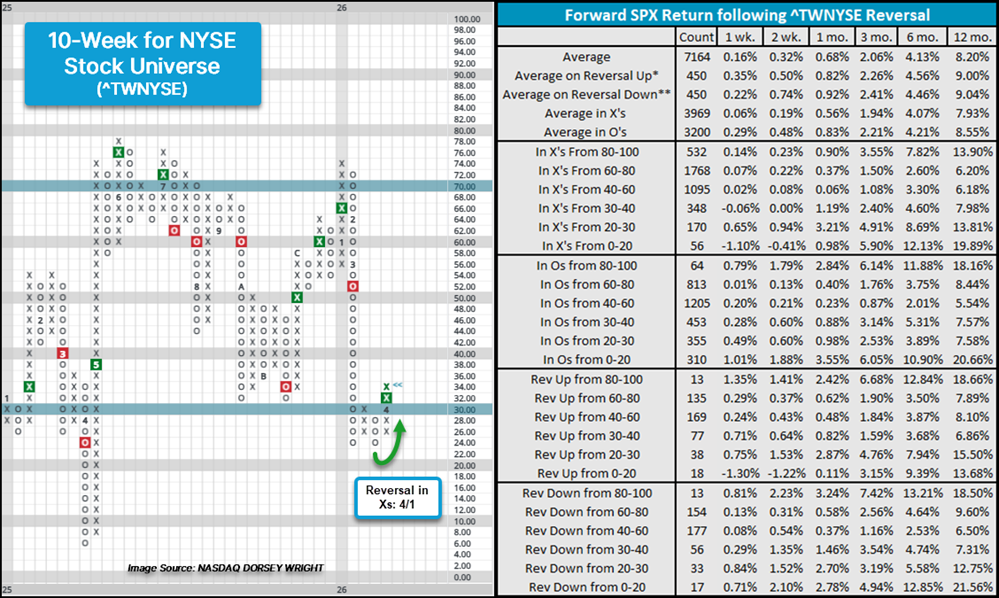
The near‑term positive action for equities has led to improvements in short‑term indicators after deteriorating to their lowest levels in roughly 12 months in most cases. Along with weekly momentum indicators—which measure the percentage of stocks maintaining positive weekly momentum (short‑term 1‑week MA above the 5‑week MA)—10‑week indicators have returned to Xs on their charts or found near‑term consolidation and shifted back to bull alert or bull confirmed status. Perhaps the most notable 10‑week indicator to return to bull confirmed status is the 10‑week for the NYSE universe (^TWNYSE), which consolidated during the final weeks of March and returned to bull confirmed status to kick off April.
The recent reversals for ^TWNYSE occur within one of the better‑performing buckets for forward returns, lagging only when the indicator falls to extreme lows (<20%) before rising to elevated territory (>80%). From here, investors will monitor whether the indicator can continue to improve—climbing to 50% or higher—or if the recent move proves to be a head fake before challenging lower, washed‑out levels (<20%) last visited 12 months ago.
In addition to the NYSE 10‑week indicator’s positive developments, the 10‑week indicators for broader market universes—All Stock (^10ALL), OTC Stocks (^TWOTC), Optionable (^TWOPTI), and World (^TWWORLD)—also reversed higher, moving above 30% after falling into the 20%–30% range.

While not all NDW 40 sectors experienced deterioration to washed‑out levels, a majority saw similar drawdowns into the 20%–30% range before rebounding. A handful—precious metals (^TWPREC), machinery and tools (^TWMACH), real estate (^TWREAL), autos and parts (^TWAUTO), and software (^TWSOFT)—fell below 20% and have since reversed higher.
As with the broader NYSE 10‑week indicator, investors will watch which sectors continue to build on these positive developments and whether the distribution curve begins to normalize from its current slight left skew.


In addition to providing one of the most dependable sporting events from a pure entertainment perspective, The Masters, which tees off on April 9th, provides a useful platform from which you can better communicate what it is you provide as an advisor. Some analogies prove to be more useful than others in this business, depending on your client base, but golf and football are fairly ubiquitous in this country. One need not have a single-digit handicap to understand the difference in the probabilities of hitting a green from 120 yards out in calm conditions, versus hitting the same green from 180 yards out, over water, and into the wind. In both cases, a golf swing is required, but that is perhaps the only thing similar between the two scenarios.
A Lesson From Augusta National Golf Club (ANGC), It's Never All Roses
If the 13th hole at ANGC, home of the Masters, isn't the perfect golf hole, it is close. If it isn't the most strategic hole at ANGC, it is close. And if a hole that is aptly named "Azalea" isn't the most scenic on the golf course come early April each year, you need to have a long talk with the course superintendent. ANGC is unique as a golf course in many ways, and this is the time of year that avid golf fans can do a little more than just sit back and watch in awe. The par 5's at Augusta, of which the 13th hole is one, are among the easiest holes on the course based upon scoring averages, and they are often the only holes that play under par. The 12th hole, by contrast, is the shortest hole on the course (listed at 155 yards) and is typically played over par by "the field." In fact, the historical stroke average for this hole is above par at 3.27. It is sometimes among the most difficult holes on the course relative to par. But it is that first step off the slippery 12th green that concerns us today and will concern the best golfers in the world later this week, as this is when they head up to the final hole of what is affectionately referred to as "Amen Corner," the aforementioned 13th.
In terms of coming in under par, the 13th at Augusta is among the "easiest" holes, if not the easiest, on the course, historically speaking. On average, the scoring on the 13th is under par at 4.77. But that doesn't mean there aren't some scary moments for the pros. When players get to the 13th at Augusta in today's composite-fused, over-sized, extra-long, super-stiff, NASA-approved driver world, it isn't the length of the hole that is daunting - almost every player in the field is capable of reaching the 510ish yard par-5 in two strokes. Rather, it is the combination of distance, a steeply sloping fairway, enough pine straw to choke a rake, and the most famous creek in golf (Rae's) protecting a green that makes the Rockies look flat, that makes the 13th one of the most strategic holes in golf.
On the one hand, the green is easily reachable in two for a scratch golfer (distance-wise), if played well. On the other hand, some of the best golfers in the world have putted a ball off the green and into the creek (Tiger Woods in 2005). Before putting comes into play, a good tee shot is mandatory for a golfer to even think about the aggressive second shot that could ultimately lead to an eagle on the 13th. A wayward drive that lands in the trees or the pine needles makes going for the green a treacherous proposition with a low probability for success (just don't tell Phil Mickelson). And even with a good tee shot, the second shot is one of pure strategy, a point-driven home like a John Daly slap-shot back in 2007. That same year, Tiger Woods had a remarkable eagle at 13 in the final round after hitting the green in two and caused perhaps the loudest roars of the tournament that year. Meanwhile, the eventual winner, Zach Johnson, chose not to attempt to reach the green in two shots a single time in the tournament, and as the sunset on Master's Sunday, he was the one slipping on a new green blazer. Or who could forget when Bubba Watson, back in 2014, went on to claim his second green jacket after gaining plenty of momentum on 13. He blasted his drive over the trees and onto the fairway, then pulled out a sand wedge to plop it over Rae's Creek and onto the green in two. He then birdied the hole. As you can see, number 13 at Augusta is quite simply a remarkable risk-reward hole that offers many ways to play it and many ways to fail.

Evaluating the "Lie"
If you work in this business long enough, you will encounter all types of markets. The worst thing to do is to abandon your game plan. Focus. It's not unlike golf. The front nine could go flawlessly, and at the turn, you hit an errant tee shot on 10, put the approach in the trap, and then three-putt for a bogey. If you play long enough, these types of holes will happen. The question is how do you handle the adversity? Focus. Focus on the fundamentals. Focus on the current shot, not the next eight holes.
When we look at the market indicators today, we see the equivalent of what PGA tour professionals (and a handful of amateurs) will see at the "Azalea" hole if they hit a reasonably good tee shot. We find a challenging second shot, but one in which there are many "right" answers thanks to the outcome of our good first shot off the tee. The S&P 500 (SPX) is coming off its third strong year in a row. However, stocks have stumbled recently with domestic equities dropping in the DALI asset class rankings. And technology, which had been the go-to “club”, has been out of favor over the short-term. However, there are opportunities as six of the eleven broad sectors are in the green this year-to-date (through 4/6) and international equities have continued to show strength.
From an economic perspective, the war in Iran and potential effects of higher energy prices remain a concern. So, in golf terms, we could be in store for shifting weather conditions that make the course more challenging to navigate.

While there are many factors in our favor, it doesn't make the shot in front of us a cinch. There are still risks, so instead of being dead set on an eagle, be willing to accept a birdie or par when that’s all the course (or the market) is offering. It is critical to maintain perspective on what our "lie" is today to properly evaluate what the realistic options are for the next shot. One of the great additions to network coverage of golf on TV over the past few years has been the ability to eavesdrop on conversations between players and their caddies. It provides a great deal of insight into all of the factors that professionals at this level of the sport analyze before each swing of the club. Some caddies are more vocal and assertive than others.
This is the role of tools like DALI and the Asset Class Group Scores – as a capable caddie that complements your knowledge and experience. These tools won’t swing the club for you, but they will give you meaningful information about the playing conditions in the investment world and where our odds of success are greatest. Like a good caddie, the tools on the NDW platform offer guidance, advising you toward logical club selections based on present conditions, while you remain the ultimate decision-maker (and star of the show).

There will always be those investors who want to wait until everything in the market lines up before putting money to work. They want to open the Wall Street Journal and see the headline, "All Roses", at the top of the front page. They want to see representatives on the floor of Congress holding hands and singing "Kumbayah," a US economy that looks like someone put rocket fuel in the gas tank, and all G20 heads of state participating in one big group hug. The problem is, first, this isn't going to happen and, second, if it did it would probably represent a top in the market rather than an opportune entry point. Some investors have learned the futility of playing golf with no practice or training. Others would just as soon spend years on the range getting their game "right" before venturing onto an actual course. In both cases, opportunity and/or money is sacrificed. An evaluation of the market environment will never yield "all roses," but rather something more similar to the picture from the "Azalea" fairway at Augusta - a tough shot with several potential right answers. You may choose to lay up here, which is fine, that approach has won the Masters before. But now is not the time to stare at this market with your knees knocking, too scared to pull something, anything, out of the bag.
If you start each workday with the feeling that you are lost, unprepared, or lacking confidence in your own decisions, it may just be time to consider taking the advice of your caddie a little more seriously. You will never have tomorrow's Wall Street Journal; therefore, you must find a methodology that gives you the confidence to swing the club. In golf, great players hit the occasional bad shots and lousy players will hit enough good shots to at least give them hope for the future. Those who ultimately win, however, are inevitably those who consistently hone their skills, put in a ton of effort, and utilize solid course management. How you go about developing such skills in this business is up to you; we have a process that allows the advisor to make logical, disciplined investment decisions in a repeatable fashion. This process can't make azaleas bloom until December, or Rae's Creek run dry for your next shot, and it surely won't get you a Monday morning tee time at Augusta. But it will keep you on the course, it will help you make sound decisions, and we think it is a process that can be effectively conveyed to clients. As you are enjoying the "tradition unlike any other," perhaps we'll see another iconic moment like Bubba's rocket over the trees. It will be something to talk about for weeks to come with your clients who share an interest in the game, and perhaps also an opportunity to explain your brand to others along the way.
Average Level
-12.49
| < - -100 | -100 - -80 | -80 - -60 | -60 - -40 | -40 - -20 | -20 - 0 | 0 - 20 | 20 - 40 | 40 - 60 | 60 - 80 | 80 - 100 | 100 - > |
|---|---|---|---|---|---|---|---|---|---|---|---|
|
Sell signaldia
|
|||||||||||
|
Sell signallqd
|
|||||||||||
|
Buy signaltlt
|
|||||||||||
|
Sell signalXLG
|
|||||||||||
|
Buy signalgld
|
|||||||||||
|
Buy signalSPY
|
|||||||||||
|
Buy signalEEM
|
|||||||||||
|
Buy signalrsp
|
|||||||||||
|
Buy signalhyg
|
|||||||||||
|
Buy signalVOOV
|
|||||||||||
|
Sell signalVOOG
|
Buy signaliwm
|
||||||||||
|
Sell signalagg
|
Sell signalONEQ
|
Buy signalIJH
|
|||||||||
|
Sell signalief
|
Sell signalQQQ
|
Buy signalijr
|
Buy signalGSG
|
||||||||
|
Buy signalshy
|
Buy signalfxe
|
Buy signalefa
|
Buy signaldvy
|
Buy signalicf
|
Buy signalGCC
|
Buy signaldx/y
|
Buy signalUSO
|
||||
| < - -100 | -100 - -80 | -80 - -60 | -60 - -40 | -40 - -20 | -20 - 0 | 0 - 20 | 20 - 40 | 40 - 60 | 60 - 80 | 80 - 100 | 100 - > |
| AGG | iShares US Core Bond ETF |
| USO | United States Oil Fund |
| DIA | SPDR Dow Jones Industrial Average ETF |
| DVY | iShares Dow Jones Select Dividend Index ETF |
| DX/Y | NYCE U.S.Dollar Index Spot |
| EFA | iShares MSCI EAFE ETF |
| FXE | Invesco CurrencyShares Euro Trust |
| GLD | SPDR Gold Trust |
| GSG | iShares S&P GSCI Commodity-Indexed Trust |
| HYG | iShares iBoxx $ High Yield Corporate Bond ETF |
| ICF | iShares Cohen & Steers Realty ETF |
| IEF | iShares Barclays 7-10 Yr. Tres. Bond ETF |
| LQD | iShares iBoxx $ Investment Grade Corp. Bond ETF |
| IJH | iShares S&P 400 MidCap Index Fund |
| ONEQ | Fidelity Nasdaq Composite Index Track |
| QQQ | Invesco QQQ Trust |
| RSP | Invesco S&P 500 Equal Weight ETF |
| IWM | iShares Russell 2000 Index ETF |
| SHY | iShares Barclays 1-3 Year Tres. Bond ETF |
| IJR | iShares S&P 600 SmallCap Index Fund |
| SPY | SPDR S&P 500 Index ETF Trust |
| TLT | iShares Barclays 20+ Year Treasury Bond ETF |
| GCC | WisdomTree Continuous Commodity Index Fund |
| VOOG | Vanguard S&P 500 Growth ETF |
| VOOV | Vanguard S&P 500 Value ETF |
| EEM | iShares MSCI Emerging Markets ETF |
| XLG | Invesco S&P 500 Top 50 ETF |

| Symbol | Company | Sector | Current Price | Action Price | Target | Stop | Notes |
|---|---|---|---|---|---|---|---|
| WBS | Webster Financial Corporation | Banks | $70.22 | hi 60s - low 70s | 91 | 58 | 4 for 5'er, top 25% of BANK sector matrix, one box from peer RS buy, buy on pullback, 2.2% yield, Earn. 4/30 |
| CGON | CG Oncology, Inc. | Biomedics/Genetics | $67.55 | hi 50s - low 60s | 80 | 50 | 5 for 5'er, 18 of 162 in BIOM sector matrix, bullish catapult, good R-R |
| BRX | Brixmor Property Group Inc | Real Estate | $28.90 | hi 20s - lo 30s | 38 | 24 | 4 for 5'er, top third of REAL sector matrix, LT pos peer & mkt RS, LT pos trend, bullish triangle, 4% yield, Earn. 4/27 |
| CNX | CNX Resources Corp | Oil | $39.69 | hi 30s - mid 40s | 71 | 33 | 5 TA rating, top 50% of OIL sector matrix, LT RS buy and pos trend, consec buy signals, Earn. 4/30 |
| FFIV | F5 Inc. | Internet | $307.64 | 280s - 290s | 344 | 256 | 4 for 5'er, top third of INET sector matrix, LT pos peer RS, spread quad top, Earn. 4/27 |
| INVA | Innoviva, Inc | Drugs | $23.02 | lo-mid 20s | 32.50 | 18.50 | 5 TA rating, top half of drugs sector RS matrix, LT pos trend, LT RS buy, buy-on-pullback, Earn. 5/6 |
| ARCB | ArcBest Corp. | Transports/Non Air | $103.62 | low-to-mid 90s | 113 | 79 | 4 for 5'er, one box from market RS buy, top half of favored TRAN sector matrix, good R-R, Earn. 4/28 |
| GSK | GlaxoSmithKline Plc. (United Kingdom) ADR | Drugs | $56.37 | hi 40s - mid 50s | 67 | 42 | 5 TA rating, top 25% of DRUG sector matrix, LT pos trend, yield > 3%, buy-on-pullback, Earn. 4/29 |
| ADI | Analog Devices, Inc. | Semiconductors | $327.36 | 310s - 330s | 380 | 268 | 4 for 5'er, top half of favored SEMI sector matrix, LT pos market RS, return to buy signal |
| CSCO | Cisco Systems, Inc. | Computers | $80.44 | Upper 70s to lower 80s | 96 | 70 | 5 for 5'er; top quintile of Computers matrix; Pos. Trend since Sept. '24; Bull Triangle on 3/25. |
| CAT | Caterpillar, Inc. | Machinery and Tools | $721.24 | 680s - 720s | 848 | 592 | 5 for 5'er, top 10% in favored MACH sector matrix, LT pos peer & mkt RS, buy on pullback, Earn. 4/30 |
| DBD | Diebold Nixdorf Inc | Finance | $77.98 | low-to-mid 70s | 99 | 63 | 5 for 5'er, #3 of 77 in FINA sector matrix, LT pos peer RS, bearish signal reversal, R-R>2.0, Earn. 5/6 |
| NI | Nisource, Inc. | Gas Utilities | $47.14 | mid-hi 40s | 78 | 38 | 5 TA rating, LT pos trend, LT mkt RS buy, consec buy signals, Earn. 5/6 |
| GLW | Corning Incorporated | Electronics | $146.50 | hi 130s - 140s | 196 | 120 | 5 for 5'er, #2 of 66 in ELEC sector matrix, quad top breakout, R-R>2.5, Earn. 4/28 |
| FHI | Federated Hermes Inc | Wall Street | $57.54 | 54-hi 50s | 91 | 46 | 5 TA rating, top 25% of WALL sector RS matrix, LT pos trend and mkt RS buy, consec buy signals, good R-R, Earn. 4/23 |
| CRS | Carpenter Technology Corporation | Steel/Iron | $394.82 | hi 370s - low 400s | 500 | 320 | 5 for 5'er, top third of STEE sector matrix, LT pos peer & mkt RS, spread quintuple top, buy on pullback, Earn. 4/29 |
| COST | Costco Wholesale Corporation | Retailing | $1018.55 | 944-1050s | 1296 | 832 | 4 TA rating, top 33% of retail sector matrix, LT mkt RS buy, LT pos trend, consec buy signals |
| Symbol | Company | Sector | Current Price | Action Price | Target | Stop | Notes |
|---|---|---|---|---|---|---|---|
| CPRT | Copart Incorporated | Autos and Parts | $32.84 | hi 30s | 28 | 42 | 1 TA rating, bottom 50% of AUTO sector matrix, NT and mkt RS sell last month, consec sell signals |
| Comment | |||||||
|---|---|---|---|---|---|---|---|
|
|
|||||||
COST Costco Wholesale Corporation ($1,010.77) R - Retailing - COST has a 4 for 5 TA rating and sits in the top third of the retailing sector RS matrix. The stock has maintained an RS buy signal against the market since 2007 and been in a positive trend since 2023. We have seen COST give two consecutive buy signals this year, highlighting the consistent improvement. Exposure may be considered from $944 to the $1050s. Our initial stop will be positioned at $832, which would violate multiple support levels. The bullish price objective of $1296 will serve as our price target.
| 25 | 26 | ||||||||||||||||||||||||||||
| 1072.00 | X | 1072.00 | |||||||||||||||||||||||||||
| 1056.00 | X | O | 6 | 1056.00 | |||||||||||||||||||||||||
| 1040.00 | X | O | X | O | 1040.00 | ||||||||||||||||||||||||
| 1024.00 | X | O | X | O | X | 1024.00 | |||||||||||||||||||||||
| 1008.00 | X | X | 3 | 5 | O | X | O | 1008.00 | |||||||||||||||||||||
| 992.00 | C | O | 2 | O | X | X | X | X | O | X | X | 2 | O | 992.00 | |||||||||||||||
| 976.00 | X | O | X | O | X | O | X | O | X | O | X | O | 8 | O | X | O | X | 3 | Mid | 976.00 | |||||||||
| 960.00 | X | X | O | X | O | X | O | X | O | X | O | X | 7 | X | O | A | X | O | X | 960.00 | |||||||||
| 944.00 | X | O | X | O | X | O | X | 4 | X | O | O | O | X | O | X | O | X | O | 944.00 | ||||||||||
| 928.00 | B | O | X | O | X | O | X | O | X | O | 9 | X | O | X | 928.00 | ||||||||||||||
| 912.00 | X | O | 1 | O | X | O | X | O | O | X | 912.00 | ||||||||||||||||||
| 896.00 | X | X | O | O | X | B | 1 | 896.00 | |||||||||||||||||||||
| 880.00 | 7 | O | X | O | O | X | 880.00 | ||||||||||||||||||||||
| 864.00 | X | O | X | C | X | Bot | 864.00 | ||||||||||||||||||||||
| 848.00 | X | O | X | O | 848.00 | ||||||||||||||||||||||||
| 832.00 | 6 | O | X | 832.00 | |||||||||||||||||||||||||
| 816.00 | X | O | X | 816.00 | |||||||||||||||||||||||||
| 800.00 | X | 8 | 800.00 | ||||||||||||||||||||||||||
| 792.00 | X | 792.00 | |||||||||||||||||||||||||||
| 784.00 | X | 784.00 | |||||||||||||||||||||||||||
| 776.00 | X | • | 776.00 | ||||||||||||||||||||||||||
| 768.00 | X | • | 768.00 | ||||||||||||||||||||||||||
| 760.00 | X | • | 760.00 | ||||||||||||||||||||||||||
| 752.00 | X | • | 752.00 | ||||||||||||||||||||||||||
| 744.00 | X | • | 744.00 | ||||||||||||||||||||||||||
| 736.00 | X | 5 | • | 736.00 | |||||||||||||||||||||||||
| 728.00 | X | O | X | • | 728.00 | ||||||||||||||||||||||||
| 720.00 | X | O | X | • | 720.00 | ||||||||||||||||||||||||
| 712.00 | X | O | X | • | 712.00 | ||||||||||||||||||||||||
| 704.00 | O | • | 704.00 | ||||||||||||||||||||||||||
| 25 | 26 |
| COO The Cooper Companies, Inc. ($69.14) - Healthcare - COO completed a double bottom sell signal at $69, marking its fourth consecutive sell signal. The 1 for 5'er moved down from a 2 with its latest move, after reversing back into Os against the market. The weekly OBOS indicates that the stock is in oversold territory, so wait for the 10-week trading band to normalize before selling your position. Initial resistance is at $73, with additional resistance at $76. |
| ORCL Oracle Corporation ($143.32) - Software - ORCL fell Tuesday to break a double bottom at $140, marking a second consecutive sell signal. This 1 for 5 TA stock sits in the bottom half of the unfavored software sector RS matrix and has been on an RS sell signal against the market since February. The weight of the evidence is decidedly negative and weakening. Note that further support sits at $138 and $136. Overhead resistance may be seen initially at $148, with more notable resistance seen at $170. |
| PDS Precision Drilling Corporation ($95.28) - Oil Service - PDS returned to a buy signal Tuesday when it broke a double top at $97. Tuesday's move adds evidence to an already positive technical picture as PDS is a 4 for 5'er that ranks in the top quintile of the favored oil service sector matrix. From here, support sits at $93 while overhead resistance can be found at $102,. |
| PSX Phillips 66 ($173.58) - Oil Service - PSX fell to a sell signal Tuesday when it broke a double bottom at $172, where it now sits against support. The outlook for the stock remains modestly positive as PSX is a 3 for 5'er that ranks in the top half of the oil service sector matrix. |

| Name | Option Symbol | Action | Stop Loss |
|---|---|---|---|
| eBay Inc. - $96.51 | O: 26G95.00D17 | Buy the July 95.00 calls at 8.75 | 87.00 |
| Name | Option | Action |
|---|---|---|
| Cisco Systems, Inc. ( CSCO) | Jul. 77.50 Calls | Initiate an option stop loss of 5.25 (CP: 7.25) |
| Apple Inc. ( AAPL) | Jul. 260.00 Calls | Stopped at 13.45 (CP: 12.50) |
| Name | Option Symbol | Action | Stop Loss |
|---|---|---|---|
| Robinhood Markets, Inc. Class A - $69.62 | O: 26Q70.00D15 | Buy the May 70.00 puts at 6.60 | 75.00 |
| Name | Option | Action |
|---|---|---|
| Kimberly-Clark Corporation ( KMB) | Apr. 100.00 Puts | Initiate an option stop loss of 4.20 (CP: 6.20) |
| Tractor Supply Company ( TSCO) | Apr. 55.00 Puts | Raise the option stop loss to 7.60 (CP: 9.60) |
| Apollo Global Management Inc. ( APO) | May. 115.00 Puts | Raise the option stop loss to 9.60 (CP: 11.60) |
| Oracle Corporation ( ORCL) | Jul. 150.00 Puts | Initiate an option stop loss of 17.90 (CP: 19.90) |
| Name | Option Sym. | Call to Sell | Call Price | Investment for 500 Shares | Annual Called Rtn. | Annual Static Rtn. | Downside Protection |
|---|---|---|---|---|---|---|---|
| Devon Energy Corporation $ 49.65 | O: 26E50.00D15 | May. 50.00 | 2.69 | $ 23,893.20 | 34.45% | 43.49% | 4.33% |
| Name | Action |
|---|---|
| Fortinet Inc. ( FTNT) - 82.29 | Sell the May 85.00 Calls. |
| Palantir Technologies Inc. Class A ( PLTR) - 147.93 | Sell the July 150.00 Calls. |
| Dell Technologies Inc Class C ( DELL) - 173.18 | Sell the May 170.00 Calls. |
| Exxon Mobil Corporation ( XOM) - 163.37 | Sell the July 165.00 Calls. |
| CF Industries Holdings, Inc. ( CF) - 130.98 | Sell the May 135.00 Calls. |
| Name | Covered Write |
|---|---|
|
|
|
Daily Equity & Market Analysis
LISTEN TO PODCAST
Apr 02, 2026
Loading, Please Wait...
