
Despite larger exhales for major markets throughout the first quarter, momentum strategies were able to put together productive opening to the year in comparison to broader benchmarks.
Despite larger exhales for major markets throughout the first quarter, momentum strategies were able to put together productive opening to the year in comparison to broader benchmarks. This was particularly evident for large cap equities which were able to post postive results for the calendar quarter (12/31/25-3/31/26). Small cap momentum strategies, while still positive for the year, posted outperformance of a smaller magnitude against major benchmarks.
The performance table below compares the price return of the Invesco Dorsey Wright Momentum ETF (PDP) and the Invesco Dorsey Wright SmallCap Momentum ETF (DWAS) to their respective benchmarks through the first quarter, while the two bottom tables zoom out to broader, full year calendar year performance throughout history as well as updated performance so far in 2026 (through 4/7/2026).

Our approach toward momentum through relative strength analysis looks to capitalize on consistent trends across the market. Changing trends cause the portfolios to readjust to maintain exposure to the strongest areas. Underperformance is typical during those environments as areas that had demonstrated relative strength fall in our rankings. The most important step in our approach comes next – those areas that have declined in strength are sold to make room for the new leaders. Any investment process is going to produce a portfolio of winners and losers. Relative strength analysis gives us a systematic way to cull the losers and constantly push the portfolio toward the strongest areas of the market.
In the most recent quarter, we saw 45 changes (out of 100 holdings) in PDP and 95 changes (out of 200 holdings) in DWAS, repositioning both portfolios toward areas of leadership as we enter the second quarter. Those metrics sit roughly on par with the number of changes each strategy saw last quarter,.
Below you'll find an update about the specific changes made in both strategies with the most recent index reconstitution. Keep in mind that removed positions likely no longer maintain characteristics of superior relative strength; meanwhile, additions have improved to a place of leadership and could be ideas to consider.
Invesco DWA Momentum ETF (PDP)
The stock-selection process behind the Invesco Dorsey Wright Momentum ETF (PDP) is simple yet robust. Every quarter, we apply the Relative Strength process to compare approximately 1,000 large and mid-cap US stocks and select the strongest 100 names. The quarterly reconstitution process's goal is to weed out the weak names and realign the portfolio toward strength. As mentioned before, with this most recent reconstitution and rebalance, we removed 45 stocks and added 45 new stocks, which we've compiled in the tables below. Several observations:
- Industrials stocks were a major standout in the first quarter, resulting to the largest increase in allocation of any major sector.
- Technology saw inconsistent leadership as more growth focused areas struggled to open the year. While the sector did pick up several new additions this quarter, it also saw lots of overall removals. Keep this in mind then looking for points of strength.
- Energy stocks also saw a large uptick in additions as unrest in the Middle East saw the energy complex (and energy focused equities) move higher throughout the opening to 2026.
- For the second consecutive quarter, consumer cyclical stocks marked one of the largest declines in overall allocation. Other points of weakness included rotation away from financials and rotation within technology (mentioned previously.)


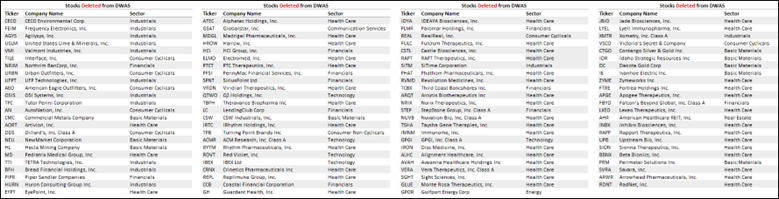
Invesco DWA SmallCap Momentum ETF (DWAS)
The stock-selection process used in DWAS is like PDP. Every quarter, we apply the Relative Strength process to compare approximately 2,000 US-listed small-cap stocks and select the strongest 200 names. With this most recent reconstitution and rebalance we pushed the portfolio towards strength by removing 95 stocks and adding 95 new stocks, which we've outlined in the table below. However, and perhaps unique to DWAS, not all stocks that were removed are technically weak. We have received this question in the past, so we want to address it here.
One reason for these removals is due to stocks exceeding the market cap filter. High-momentum stocks should, ideally, increase in market cap which means that sometimes a name will exceed the small-cap maximum at the end of a quarter. This is not the norm, but worth keeping in mind when reviewing the changes. Several takeaways:
- Similar to large cap options, industrials saw the largest proportion of overall additions over the last quarter. Energy excelled as further unrest in the Middle East continued in Q1, seeing the second largest increase in absolute additions to open 2026.
- After seeing the past few quarters see the sector pick up large proportions of healthcare, the sector was the area with the most rotation. Several healthcare stocks emerged as points of relative weakness, with only a handful of those spots being replaced by additional healthcare stocks.
- Technology managed to put together a somewhat productive quarter, seeing more additions than removals.
- Points of low allocation in the previous quarters (besides energy) didn’t see meaningful upticks in strength. We consider this a tailwind for momentum focused strategies which can excel if overall leadership remains consistent.

Disclosures:
This article is intended for Financial Professional Use Only.
Management and other expenses can have a material impact on performance when compounded over time. Past performance, hypothetical or actual, does not guarantee future results. In all securities trading there is a potential for loss as well as profit. It should not be assumed that recommendations made in the future will be profitable or will equal the performance as shown.
Click here for more information from Invesco on the Invesco DWA Momentum ETF (PDP): https://www.invesco.com/us/financial-products/etfs/product-detail?audienceType=Investor&ticker=PDP
Click here for more information from Invesco on the Invesco DWA SmallCap Momentum ETF (DWAS): https://www.invesco.com/us/financial-products/etfs/product-detail?audienceType=Investor&productId=ETF-DWAS
Dorsey, Wright & Associates, LLC is owned by Nasdaq, Inc. and we have affiliates who also provide financial services, research, information, and act as Brokers/Dealers to a wide variety of clients. Our affiliates use the information we create to create indexes, which are then used to create Exchange Traded Funds. These things create a potential conflict of interest in that we may have an incentive to promote or use the products and services of our affiliates and business partners. A number of Dorsey Wright representatives are registered with and hold securities licenses with the affiliate broker-dealers. In this capacity, they assist with the marketing and distribution of Exchange Traded Products.
