Most Requested Symbols

While more wartime companies have gotten plenty of attention in 2026, domestic transports have also done quite well. We evaluate the space in today's article
Q1 2026 review of DALI strategies and major asset classes.
Weekly Rundown Video – April 1, 2026
Weekly rundown with NDW analyst team covering all major asset classes.
Weekly rundown with NDW analyst team covering all major asset classes.
NDW is pleased to present our “Weight of the Evidence” heading into the second quarter of 2026. The document, approved for financial professionals and non-professionals alike, details key technical changes markets brought our way during the first quarter. Click here to download the report
You can also join our team Tuesday, 4/7 to discuss these changes (and more) during our live webinar. Click here to register.
Amidst all the talk about international unrest and focus on companies that can rule the skies in the Middle East, there has been a distinct lack of conversation about those that rule the ground. The Dow Transports Theory suggests that the forward-looking nature of broad markets converges with the actual transportation of goods and services around the nation. After all, a company’s sales can say the top line is growing… but if planes, trains and automobiles aren’t delivering a tangible product to your doorstep there may be a growing disconnect between the true economic and stock market implied health of the economy. While there are certainly questions as to the longer-term health of the consumer and overall spending power, transportation companies haven’t shown it so far in 2026. In fact, the Dow Jones Transportation Avg. (TRAN) has gained over 10% this year, journeying nicely along its positive trend line below current levels as we open up Q2. While it does sit off its highs established earlier this year, the overall technical picture remains quite strong as the next level of resistance lies around 20,000 on its default PnF chart.

While it doesn’t currently trade in a positive trend, transport-focused ETF XTN has quite an interesting technical picture to open April. Earning a strong 4.54 fund score as of 4/6, the fund is up roughly 5% this year as recent action has led it to test its negative trend line around current levels. Further upside would push it back into a positive trend and would most likely bump its fund score back above 5.0. Zooming outside of just XTN, the broader transports group sits 11th out of all 134 groups on NDW’s asset class group scores page. While this score has backed off recent highs from earlier in 2026 when the average score crested 5.0 back in February, the longer-term relative picture for the entire group is quite strong.

Underneath the hood of many of these transport focused funds sit several stocks with interesting technical pictures. The likes of ODFL or FDX are up 20%+ this year, having recently taken a breather on their default charts. The chart below for FDX highlights relevant support and resistance levels worth monitoring. While the astute chartist might mention the lower high (from $392 in February to $380 in March) as a bearish development, its worth noting that bulls have been quick to defend newly established support in the $340’s. Now flirting with the middle of its trading band (50-day moving average), those looking to take offensive positions in this market environment could do so here. For those looking to take a slightly more defensive approach to cash deployment in this market environment, perhaps wait for a possible retest of the support in the $340’s, or have a tight stop loss in place in the event of further deterioration. Regardless, the stock appears to be a high RS name within a relatively high RS subsector.

There are several other names that have shown improvement. While not as much of a direct shipping/direct transport as the likes of FDX or ODFL, blueblood Delta reports earnings late this week on 4/8/26. While only a 3/5’er at the time of this writing, the recent break back into a positive trend is encouraging to say the least. Back and forth action leaves plenty of resistance above current levels, but more recent support established at $63 leaves a base of support to retreat to on poor results. Sitting square in the middle of its trading band, DAL is a strong candite for those of you looking to take a “flier” around earnings.


It was a poor quarter for many asset classes, with the large exception of commodities, with the WisdomTree Continuous Commodity Index Fund (GCC) gaining more than 13%. International equities cooled off in the back half of the quarter, but the SPDR MSCI ACWI ex-US ETF (CWI) still put together a solid quarter as it gained 2.4%. Meanwhile, domestic equities were a point of weakness, seeing the iShares Core S&P Total US Stock Market ETF (ITOT) fall -3.4% on the quarter. DALI (Dynamic Asset Level Investing) is designed to help identify where strength (or weakness) resides across and within the broad asset classes. Domestic equity weakness saw the group fall from first to as low as third in DALI's rankings. Commodities surged in strength in to the top of DALI's rankings, but faltered near the end of March to drop to third place, leaving international and domestic equities in first and second, respectively. DALI's overweight top three assets remain firmly risk-on for the time being, especially as risk-off areas like fixed income and cash sit in the bottom half of rankings.
Using DALI's rankings, we can put together a variety of tactical strategies. Currently, most tactical models remain overweight both international and domestic equities, with some potential exposure to commodities as well. The following strategies are among the most popular, with their rules defined below.
DALI Allocation Strategies
DALI No Bogey: One of the most basic strategies, DALI No Bogey, assumes owning the top two ranked asset classes in an equal-weighted fashion.
DALI with Bogey: Like the DALI No Bogey strategy, DALI with Bogey owns the top two ranked asset classes, but it also employs the Cash Bogey Check. If one of the two asset classes “Fails” that Cash Bogey Check, cash replaces it in the portfolio allocation.
3-Legged Stool: The 3-Legged Stool Strategy, as the name implies, consists of three slices. Two of the slices (or legs) are allocated to the top two asset classes emphasized in DALI, and the third leg is designed to be a constant equity exposure. Within this strategy, the managed equity exposure can take on a different meaning for each, but it is one way to further customize DALI by using individual stocks, ETFs, mutual funds, UITs, or a combination of all.
DALI Tactical Allocation: The Tactical Allocation, or 6-Legged Stool as this strategy has come to be known in some circles, is a strategy where 15% of the portfolio is allocated to domestic equities, international equities, commodities, and fixed income. That accounts for 60% of the portfolio. The other 40% is split between the top two emphasized asset classes in DALI. This has the effect of always maintaining exposure to four asset classes and then using DALI to know which asset classes to overweight.
DALI Flexible Allocation: In the DALI Flexible Allocation Strategy, each asset class is weighted in the portfolio based on the percent of total "buy signals" the asset class maintains relative to the current sum of "tally" signals. In this strategy, you are always maintaining exposure to all six asset classes, but the weights of those asset classes are determined by their strength.
DALI Tactical Tilt Allocation: Our Tactical Tilt program was designed to begin with a strategic target in mind, perhaps something along the lines of 60% stocks and 40% other "stuff" and then establish ranges within which the portfolio can adapt. As our research over the past years has proven, those ranges must be wide enough to allow real adaptation to take place but narrow enough to avoid the common complaints of "purely tactical" portfolios. In a sample moderate "Tilt" allocation, an offensive portfolio could have 75% exposure to US equities while a sample defensive portfolio could be only 20% US equities and 60% fixed income.
Click here to go to the DALI Strategies Page for current suggested allocations. Note that you can also see the Tactical Tilt Models under Models & Products > Models > Tactical Tilt (filter on left-hand side).
So, how do these work? First, we assign strategic boundaries to each asset class, which will vary according to the targeted risk tolerance of the portfolio. Once the minimum weightings in each asset class are satisfied, the remaining portfolio allocations are filled beginning with the strongest asset class in DALI up to that asset class's maximum allocation. Once the maximum weighting for the top-ranked asset class is achieved, you would simply fill the second-ranked asset class, and so on until 100% of the total allocation is applied.
Using the "Moderate Tilt Allocation" as an example in the current market, 20% would go to domestic equities to fulfill the minimum requirement, 5% to international, 20% to fixed income, and 0.5% to cash. The remaining 54.5% is left to "Tactically Tilt.” Since international equities are currently the number-one-ranked asset class, they can receive all of their remaining 20% allocation, giving the asset class its maximum possible 25% total allocation. The the leftover 34.5% allocation is then given to the next strongest asset class, which in this case is domestic equities, bringing its total allocation to 54.5%.
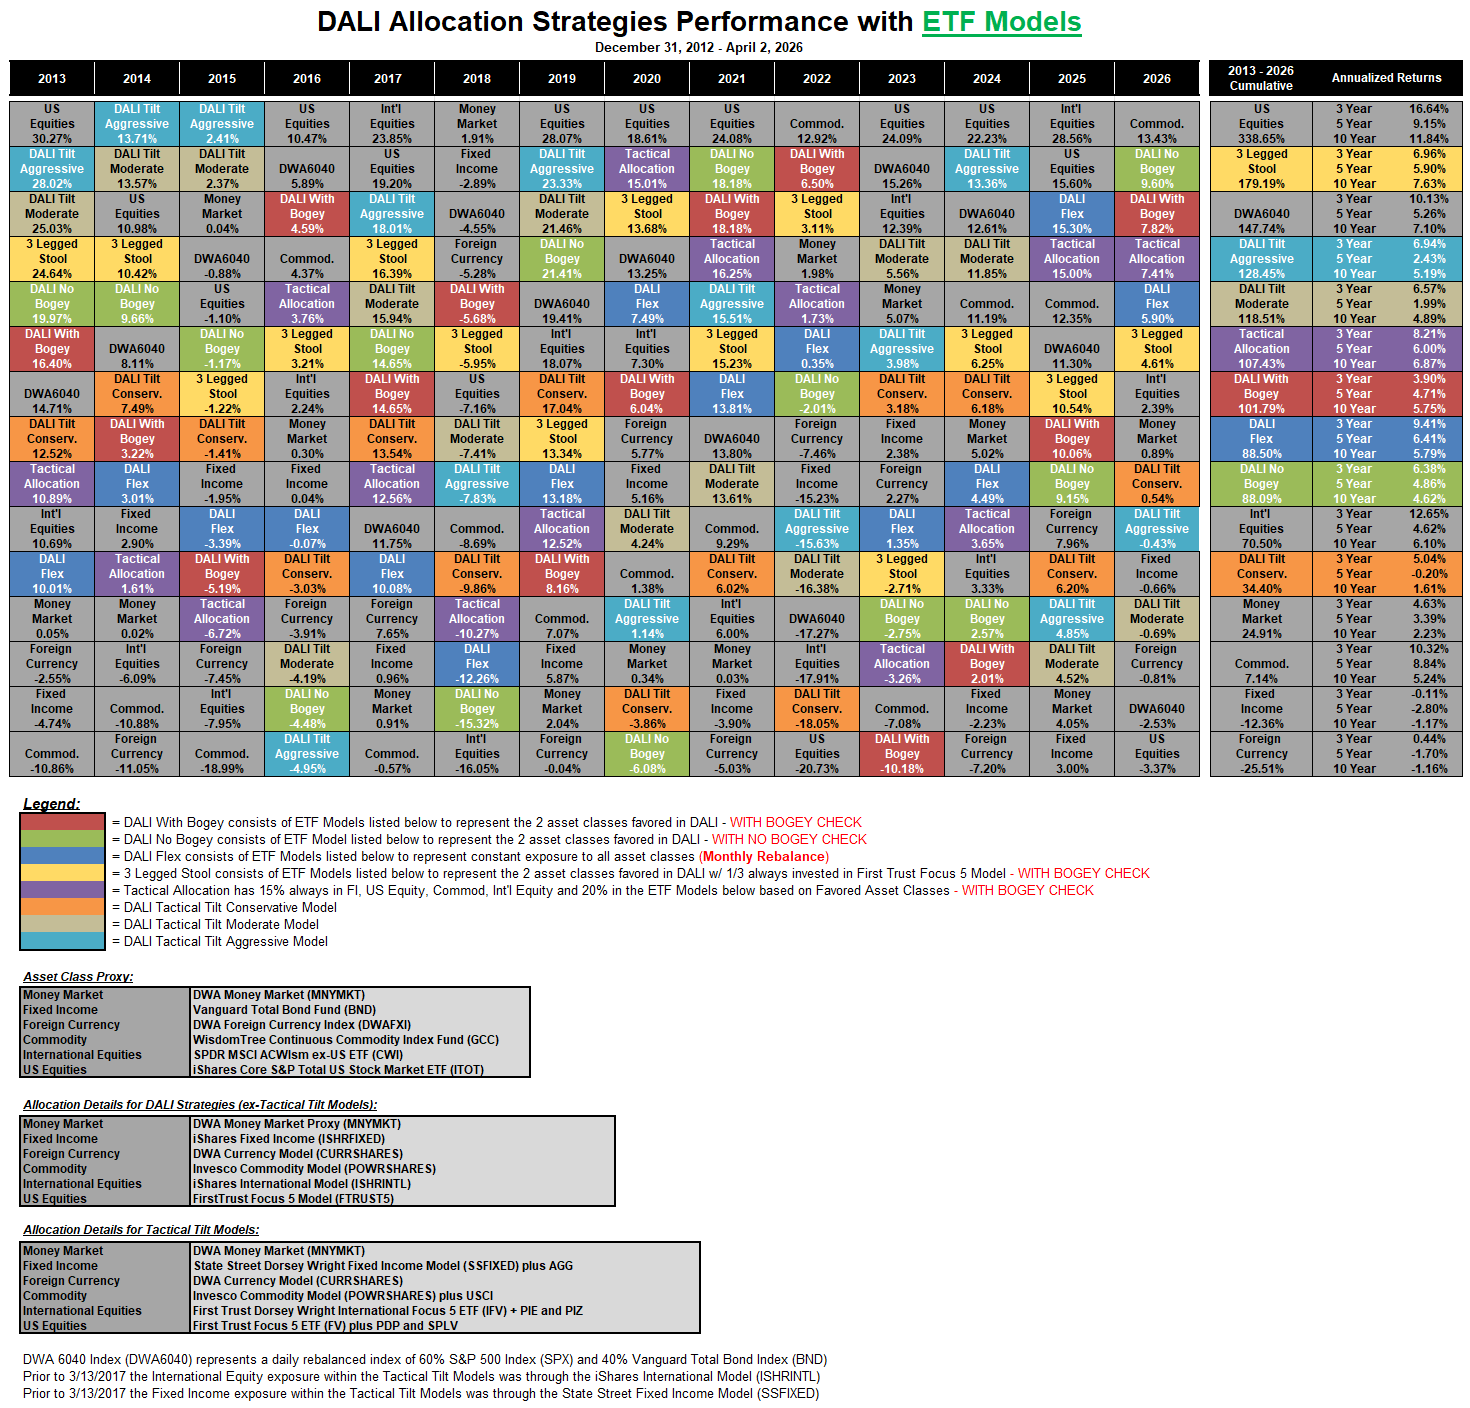
The following performance quilt shows several sample portfolios for the period beginning 12/31/2012. Certain strategies do better than others at different points in time and in different market environments, which is evident in the yearly breakdown. Because we have been in a strong bull market for US equities for most of this period, the strategies that have allowed for the greatest overweight to that asset class ultimately rise to the top in cumulative performance. However, some years, like 2026 so far, saw different asset classes rise to the top of the performance rankings, highlighting the importance of using a tactical approach to shift the allocation when needed.

While certain markets can lend themselves nicely to asset class rotation, it is often the sub-asset class decisions that help generate significant alpha in the portfolio over time. For example, should you be overweighting technology or real estate? Treasuries or high-yield bonds? Emerging or developed markets?
The quilt below displays variations of the DALI Strategies discussed above but adds that additional layer of relative strength analysis to the sub-asset class level. To accomplish this, we have substituted DWA-guided ETF Models' returns for each asset class instead of an index proxy. For example, instead of buying the iShares Core S&P US Total Stock Market ETF (ITOT) for our US Equity exposure, the quilt below assumes an investment in the First Trust Focus Five Model (FTRUST5). As you can see, adding this layer of analysis to your portfolios offers value to asset allocation strategies, with this year's outperformance serving as a great example.
Average Level
-14.32
| < - -100 | -100 - -80 | -80 - -60 | -60 - -40 | -40 - -20 | -20 - 0 | 0 - 20 | 20 - 40 | 40 - 60 | 60 - 80 | 80 - 100 | 100 - > |
|---|---|---|---|---|---|---|---|---|---|---|---|
|
Sell signalief
|
|||||||||||
|
Buy signalhyg
|
|||||||||||
|
Buy signalVOOV
|
|||||||||||
|
Sell signalXLG
|
|||||||||||
|
Buy signalEEM
|
|||||||||||
|
Buy signalSPY
|
|||||||||||
|
Buy signalrsp
|
|||||||||||
|
Sell signalVOOG
|
|||||||||||
|
Sell signallqd
|
|||||||||||
|
Buy signalgld
|
Buy signaliwm
|
||||||||||
|
Sell signalONEQ
|
Buy signalIJH
|
||||||||||
|
Buy signalfxe
|
Buy signaltlt
|
Buy signalijr
|
|||||||||
|
Sell signaldia
|
Sell signalQQQ
|
Buy signaldvy
|
Buy signalGSG
|
||||||||
|
Buy signalshy
|
Sell signalagg
|
Buy signalefa
|
Buy signalicf
|
Buy signalGCC
|
Buy signaldx/y
|
Buy signalUSO
|
|||||
| < - -100 | -100 - -80 | -80 - -60 | -60 - -40 | -40 - -20 | -20 - 0 | 0 - 20 | 20 - 40 | 40 - 60 | 60 - 80 | 80 - 100 | 100 - > |
| AGG | iShares US Core Bond ETF |
| USO | United States Oil Fund |
| DIA | SPDR Dow Jones Industrial Average ETF |
| DVY | iShares Dow Jones Select Dividend Index ETF |
| DX/Y | NYCE U.S.Dollar Index Spot |
| EFA | iShares MSCI EAFE ETF |
| FXE | Invesco CurrencyShares Euro Trust |
| GLD | SPDR Gold Trust |
| GSG | iShares S&P GSCI Commodity-Indexed Trust |
| HYG | iShares iBoxx $ High Yield Corporate Bond ETF |
| ICF | iShares Cohen & Steers Realty ETF |
| IEF | iShares Barclays 7-10 Yr. Tres. Bond ETF |
| LQD | iShares iBoxx $ Investment Grade Corp. Bond ETF |
| IJH | iShares S&P 400 MidCap Index Fund |
| ONEQ | Fidelity Nasdaq Composite Index Track |
| QQQ | Invesco QQQ Trust |
| RSP | Invesco S&P 500 Equal Weight ETF |
| IWM | iShares Russell 2000 Index ETF |
| SHY | iShares Barclays 1-3 Year Tres. Bond ETF |
| IJR | iShares S&P 600 SmallCap Index Fund |
| SPY | SPDR S&P 500 Index ETF Trust |
| TLT | iShares Barclays 20+ Year Treasury Bond ETF |
| GCC | WisdomTree Continuous Commodity Index Fund |
| VOOG | Vanguard S&P 500 Growth ETF |
| VOOV | Vanguard S&P 500 Value ETF |
| EEM | iShares MSCI Emerging Markets ETF |
| XLG | Invesco S&P 500 Top 50 ETF |

| Symbol | Company | Sector | Current Price | Action Price | Target | Stop | Notes |
|---|---|---|---|---|---|---|---|
| WBS | Webster Financial Corporation | Banks | $69.79 | hi 60s - low 70s | 91 | 58 | 4 for 5'er, top 25% of BANK sector matrix, one box from peer RS buy, buy on pullback, 2.2% yield |
| CGON | CG Oncology, Inc. | Biomedics/Genetics | $67.48 | hi 50s - low 60s | 80 | 50 | 5 for 5'er, 18 of 162 in BIOM sector matrix, bullish catapult, good R-R |
| BRX | Brixmor Property Group Inc | Real Estate | $28.90 | hi 20s - lo 30s | 38 | 24 | 4 for 5'er, top third of REAL sector matrix, LT pos peer & mkt RS, LT pos trend, bullish triangle, 4% yield, Earn. 4/27 |
| CNX | CNX Resources Corp | Oil | $38.71 | hi 30s - mid 40s | 71 | 33 | 5 TA rating, top 50% of OIL sector matrix, LT RS buy and pos trend, consec buy signals, Earn. 4/23 |
| FFIV | F5 Inc. | Internet | $303.35 | 280s - 290s | 344 | 256 | 4 for 5'er, top third of INET sector matrix, LT pos peer RS, spread quad top, Earn. 4/27 |
| INVA | Innoviva, Inc | Drugs | $22.99 | lo-mid 20s | 32.50 | 18.50 | 5 TA rating, top half of drugs sector RS matrix, LT pos trend, LT RS buy, buy-on-pullback |
| ARCB | ArcBest Corp. | Transports/Non Air | $100.51 | low-to-mid 90s | 113 | 79 | 4 for 5'er, one box from market RS buy, top half of favored TRAN sector matrix, good R-R, Earn. 4/28 |
| GSK | GlaxoSmithKline Plc. (United Kingdom) ADR | Drugs | $56.69 | hi 40s - mid 50s | 67 | 42 | 5 TA rating, top 25% of DRUG sector matrix, LT pos trend, yield > 3%, buy-on-pullback, Earn. 4/29 |
| ADI | Analog Devices, Inc. | Semiconductors | $318.34 | 310s - 330s | 380 | 268 | 4 for 5'er, top half of favored SEMI sector matrix, LT pos market RS, return to buy signal |
| CSCO | Cisco Systems, Inc. | Computers | $79.02 | Upper 70s to lower 80s | 96 | 70 | 5 for 5'er; top quintile of Computers matrix; Pos. Trend since Sept. '24; Bull Triangle on 3/25. |
| CAT | Caterpillar, Inc. | Machinery and Tools | $717.22 | 680s - 720s | 848 | 592 | 5 for 5'er, top 10% in favored MACH sector matrix, LT pos peer & mkt RS, buy on pullback, Earn. 4/30 |
| DBD | Diebold Nixdorf Inc | Finance | $77.32 | low-to-mid 70s | 99 | 63 | 5 for 5'er, #3 of 77 in FINA sector matrix, LT pos peer RS, bearish signal reversal, R-R>2.0 |
| NI | Nisource, Inc. | Gas Utilities | $47.49 | mid-hi 40s | 78 | 38 | 5 TA rating, LT pos trend, LT mkt RS buy, consec buy signals |
| GLW | Corning Incorporated | Electronics | $147.92 | hi 130s - 140s | 196 | 120 | 5 for 5'er, #2 of 66 in ELEC sector matrix, quad top breakout, R-R>2.5, Earn. 4/28 |
| FHI | Federated Hermes Inc | Wall Street | $57.81 | 54-hi 50s | 91 | 46 | 5 TA rating, top 25% of WALL sector RS matrix, LT pos trend and mkt RS buy, consec buy signals, good R-R, Earn. 4/23 |
| CRS | Carpenter Technology Corporation | Steel/Iron | $391.51 | hi 370s - low 400s | 500 | 320 | 5 for 5'er, top third of STEE sector matrix, LT pos peer & mkt RS, spread quintuple top, buy on pullback, Earn. 4/29 |
| Symbol | Company | Sector | Current Price | Action Price | Target | Stop | Notes |
|---|---|---|---|---|---|---|---|
| CPRT | Copart Incorporated | Autos and Parts | $33.40 | hi 30s | 28 | 42 | 1 TA rating, bottom 50% of AUTO sector matrix, NT and mkt RS sell last month, consec sell signals |
| Comment | |||||||
|---|---|---|---|---|---|---|---|
|
|
|||||||
CRS Carpenter Technology Corporation R ($392.67) - Steel/Iron - CRS is a 5 for 5'er that ranks in the top third of the steel/iron sector matrix and has been on market and peer RS buy signals since 2022 and 2023, respectively. In last week's trading, CRS gave a second consecutive buy signal when it broke a spread quintuple top at $416. The stock has subsequently pulled back to near the middle of its trading band, offering an entry point for long exposure. Positions may be added in the high $370s to low $400s and we will set our initial stop at $320. We will use the bullish price objective, $500, as our target price.
| 416.00 | X | 416.00 | |||||||||||||||||||||||||||
| 408.00 | 3 | X | X | X | X | O | 408.00 | ||||||||||||||||||||||
| 400.00 | X | O | X | O | X | O | X | O | X | O | 400.00 | ||||||||||||||||||
| 396.00 | X | X | O | X | O | X | O | X | O | X | O | 396.00 | |||||||||||||||||
| 392.00 | X | O | X | O | X | O | X | O | X | X | O | X | O | 392.00 | |||||||||||||||
| 388.00 | X | X | O | X | O | O | X | O | X | O | X | O | X | O | 388.00 | ||||||||||||||
| 384.00 | X | O | X | O | X | O | X | O | X | O | X | O | X | 384.00 | |||||||||||||||
| 380.00 | X | O | X | O | O | X | O | X | O | X | O | 4 | Mid | 380.00 | |||||||||||||||
| 376.00 | X | O | X | O | O | X | O | X | O | X | 376.00 | ||||||||||||||||||
| 372.00 | X | X | O | X | O | X | O | X | O | X | 372.00 | ||||||||||||||||||
| 368.00 | X | O | X | O | X | O | X | O | X | O | 368.00 | ||||||||||||||||||
| 364.00 | X | O | X | O | O | X | O | • | 364.00 | ||||||||||||||||||||
| 360.00 | X | O | O | X | • | 360.00 | |||||||||||||||||||||||
| 356.00 | X | O | X | • | 356.00 | ||||||||||||||||||||||||
| 352.00 | X | X | O | • | 352.00 | ||||||||||||||||||||||||
| 348.00 | X | O | X | • | 348.00 | ||||||||||||||||||||||||
| 344.00 | X | X | O | X | X | • | 344.00 | ||||||||||||||||||||||
| 340.00 | X | O | X | O | X | O | X | • | 340.00 | ||||||||||||||||||||
| 336.00 | X | O | X | O | X | O | X | • | 336.00 | ||||||||||||||||||||
| 332.00 | X | O | X | O | X | O | X | • | 332.00 | ||||||||||||||||||||
| 328.00 | X | O | O | X | O | X | • | 328.00 | |||||||||||||||||||||
| 324.00 | X | O | X | X | O | • | 324.00 | ||||||||||||||||||||||
| 320.00 | X | O | X | O | X | • | 320.00 | ||||||||||||||||||||||
| 316.00 | O | X | O | X | • | 316.00 | |||||||||||||||||||||||
| 312.00 | O | X | 2 | X | • | 312.00 | |||||||||||||||||||||||
| 308.00 | O | X | O | • | 308.00 | ||||||||||||||||||||||||
| 304.00 | O | X | • | 304.00 | |||||||||||||||||||||||||
| 300.00 | O | X | • | 300.00 | |||||||||||||||||||||||||
| 296.00 | O | X | • | 296.00 | |||||||||||||||||||||||||
| 292.00 | O | X | • | 292.00 | |||||||||||||||||||||||||
| 288.00 | O | • | 288.00 |
| ANF Abercrombie & Fitch Co. ($96.30) - Retailing - ANF reversed into Xs and broke a double top at $95 for a third buy signal since the middle of March. This action follows the stock shifting back into a positive trend and increasing to a 3 for 5'er. Note resistance in the $100 range. Initial support lies at $91, while additional can be found in the upper to mid $80s. |
| BIIB Biogen Inc. ($171.74) - Biomedics/Genetics - BIIB inched lower to complete a double bottom break at $170, marking its second consecutive sell signal. The 2 for 5'er moved down from a 3 last month after reversing back into a negative trend. A sell can be considered here, given the normalization of the 10-week trading band. Initial resistance can be seen at $186, with additional strong resistance between $190-$192. |
| BK Bank of New York Mellon Corporation ($123.31) - Banks - BK shares returned to a buy signal after breaking a double top at $124. This 5 for 5'er has been in a positive trend since November 2023 and on an RS buy signal versus the market since September 2024. BK shares are trading in actionable territory with a weekly overbought/oversold reading of 19%. From here, support is offered at $112. |
| LSCC Lattice Semiconductor Corp ($95.53) - Semiconductors - LSCC rose Monday to break a double top at $98. This also moved the stock back to a positive trend, promoting it to a 4 for 5'er. The weight of the technical evidence is mixed but improving. Initial support is seen at $92 with further support at $87 and $85. Overhead resistance may be seen at $100. |
| MAR Marriott International, Inc. ($337.83) - Leisure - MAR broke a double top at $336 for a second buy signal. This follows another test and hold of the bullish support line, placing another higher bottom at $320 in the process. The stock has been a 5 for 5'er since May of 2025 and currently ranks within the top quintile of the Leisure sector matrix. Okay to consider here on the breakout. Note the stock's all-time chart high at $368. Notable support lies in the $312 to $320 range, while additional can be found at $284. |
| STX Seagate Technology ($453.65) - Computers - STX rose Monday to break a triple top at $432 before reaching a new all-time high at $464 intraday. This 5 for 5'er moved to a positive trend in April of last year and sits in the top third of the favored computers sector RS matrix. Weekly momentum also just flipped positive, suggesting the potential for further upside from here. The weight of the technical evidence is positive and improving. Initial support can be seen at $400 with further support at $352. |

| Name | Option Symbol | Action | Stop Loss |
|---|---|---|---|
| Chevron Corporation - $198.86 | O: 26E200.00D15 | Buy the May 200.00 calls at 8.05 | 184.00 |
| Name | Option | Action |
|---|---|---|
| eBay Inc. ( EBAY) | May. 92.50 Calls | Initiate an option stop loss of 6.65 (CP: 8.65) |
| Archer-Daniels-Midland Company ( ADM) | May. 65.00 Calls | Raise the option stop loss to 6.70 (CP: 8.70) |
| Apple Inc. ( AAPL) | Jul. 260.00 Calls | Initiate an option stop loss of 13.45 (CP: 15.45) |
| Name | Option Symbol | Action | Stop Loss |
|---|---|---|---|
| Amazon.com Inc. - $212.79 | O: 26S215.00D17 | Buy the July 215.00 puts at 16.30 | 224.00 |
| Name | Option | Action |
|---|---|---|
| Uber Technologies, Inc. ( UBER) | Jun. 75.00 Puts | Stopped at 6.55 (CP: 6.55) |
| Apollo Global Management Inc. ( APO) | May. 115.00 Puts | Initiate an option stop loss of 9.30 (CP: 11.30) |
| T-Mobile US Inc. ( TMUS) | Jun. 210.00 Puts | Raise the option stop loss to 15.40 (CP: 17.40) |
| Name | Option Sym. | Call to Sell | Call Price | Investment for 500 Shares | Annual Called Rtn. | Annual Static Rtn. | Downside Protection |
|---|---|---|---|---|---|---|---|
| CF Industries Holdings, Inc. $ 129.97 | O: 26E135.00D15 | May. 135.00 | 8.05 | $ 62,296.50 | 68.31% | 50.00% | 5.07% |
| Name | Action |
|---|---|
| Fortinet Inc. ( FTNT) - 82.53 | Sell the May 85.00 Calls. |
| Palantir Technologies Inc. Class A ( PLTR) - 148.46 | Sell the July 150.00 Calls. |
| Dell Technologies Inc Class C ( DELL) - 174.37 | Sell the May 170.00 Calls. |
| Exxon Mobil Corporation ( XOM) - 160.69 | Sell the July 165.00 Calls. |
| Name | Covered Write |
|---|---|
| Invesco PLC ( IVZ - 24.14 ) | May 24.00 covered write. |
Daily Equity & Market Analysis
LISTEN TO PODCAST
Apr 02, 2026
Loading, Please Wait...
