
Friday’s trading marked a fifth consecutive week of negative action for the majority of US equity indices.
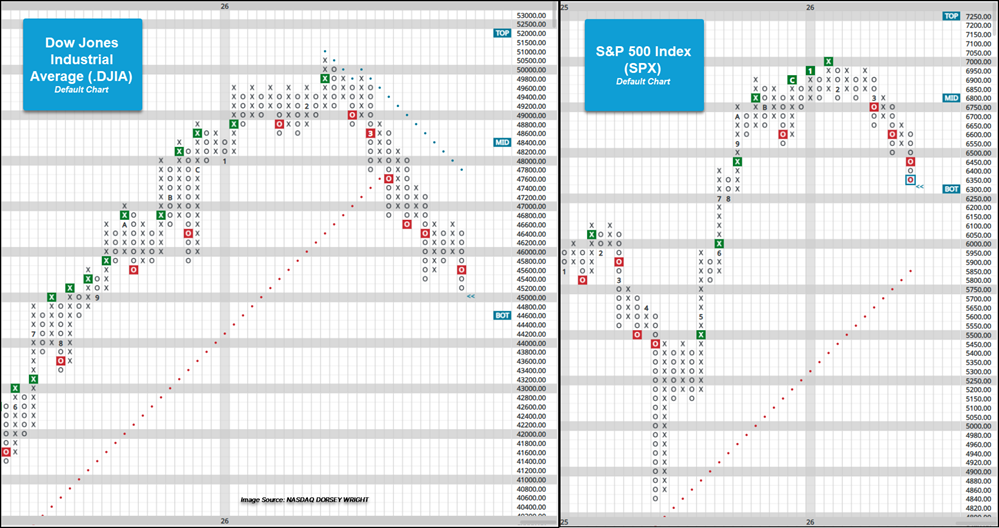
Friday’s trading marked a fifth consecutive week of negative action for the majority of US equity indices. The exceptions were the Russell 2000 Index (RUT), which rose 46 basis points last week, and the S&P 500 Equal Weight Index (SPXEWI), which experienced its fourth consecutive week of negative action. Alongside the negative weekly performance, U.S. index charts either returned to a column of Os or generated additional sell signals on their default point-and-figure trend charts. Following reversals into Os during Thursday’s trading, the S&P 500 Index (SPX) and the Dow Jones Industrial Average (.DJIA) registered their third and fifth consecutive sell signals, respectively. While the Dow now trades at its lowest level since September, the S&P 500 remains at its lowest chart position since August. Near-term support for the Dow is found at 45,000 and 44,600, while support for the S&P 500 lies at 6,250 and 6,100.
In both cases, the S&P 500 and the Dow have not experienced five or more consecutive weeks of negative action since 2022. That year saw the indices decline for seven and eight weeks, respectively, spanning the latter half of April through the first third of May. Dating back to 1957 for the S&P 500 Index and 1900 for the Dow, the indices have recorded 27 (SPX) and 65 (.DJIA) instances of five or more consecutive weeks of negative performance.
The tables below examine the forward performance of both indices following five or more weeks of negative action. On average, returns immediately following such streaks are mixed to negative in the short- to intermediate-term. It is worth noting that the data does encompass five week streaks that continue on to six, seven, and eight weeks (the longest period of negative weekly action), impacting short-term returns. Intermediate-term returns don’t overwhelmingly improve, suggesting periods of consolidation or additional negative action in the months after seeing five weeks of negative action. Long-term returns improve, but suggest periods of turbulence have been seen as well.
With the first quarter nearing a close and the current streak of weekly negative performance ongoing, investors are increasingly focused on whether equity indices can establish a foundation as the second quarter begins. Should domestic equity indices end their streak of weekly losses early in Q2, investors will see if sustained improvement can return or if the market is ready for another bout of volatility.

