Most Requested Symbols

Investing is a delicate balance between greed and fear, but with markets declining over the last month due to a variety of headlines, investors have gravitated much closer to fear. What does that mean for client portfolios?
The check-a-month strategy involves buying a group of high-yielding, quarterly-dividend-paying stocks with dividend payment dates spread across the quarter so that the client receives a dividend check(s) each month.
Weekly Rundown Video – Mar 26, 2026
Weekly rundown with NDW analyst team covering all major asset classes.
Weekly rundown with NDW analyst team covering all major asset classes.
Investing is a delicate balance between greed and fear, but with markets declining over the last month due to a variety of headlines, investors have gravitated much closer to fear. The most common “fear gauge” of the stock market is the CBOE VIX index, measuring the expected volatility (standard deviation of returns) of the S&P 500 (SPX) over the next 30 days. The index entered the year around multi-year lows, but with selloff after January, the index has doubled after settling around 28.
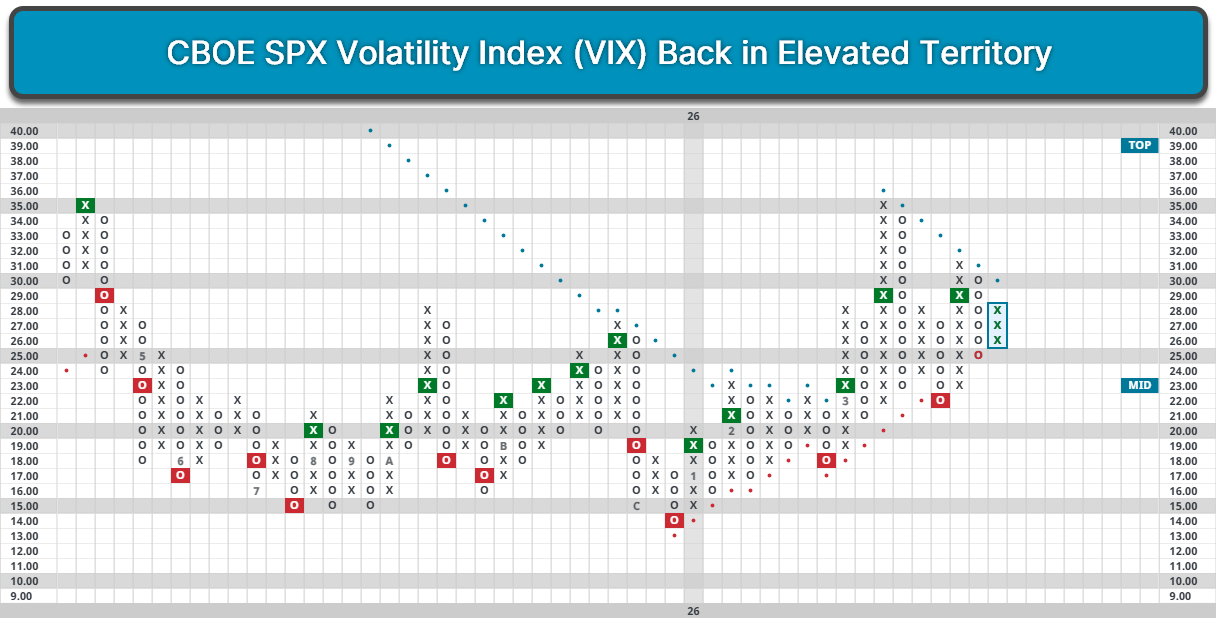
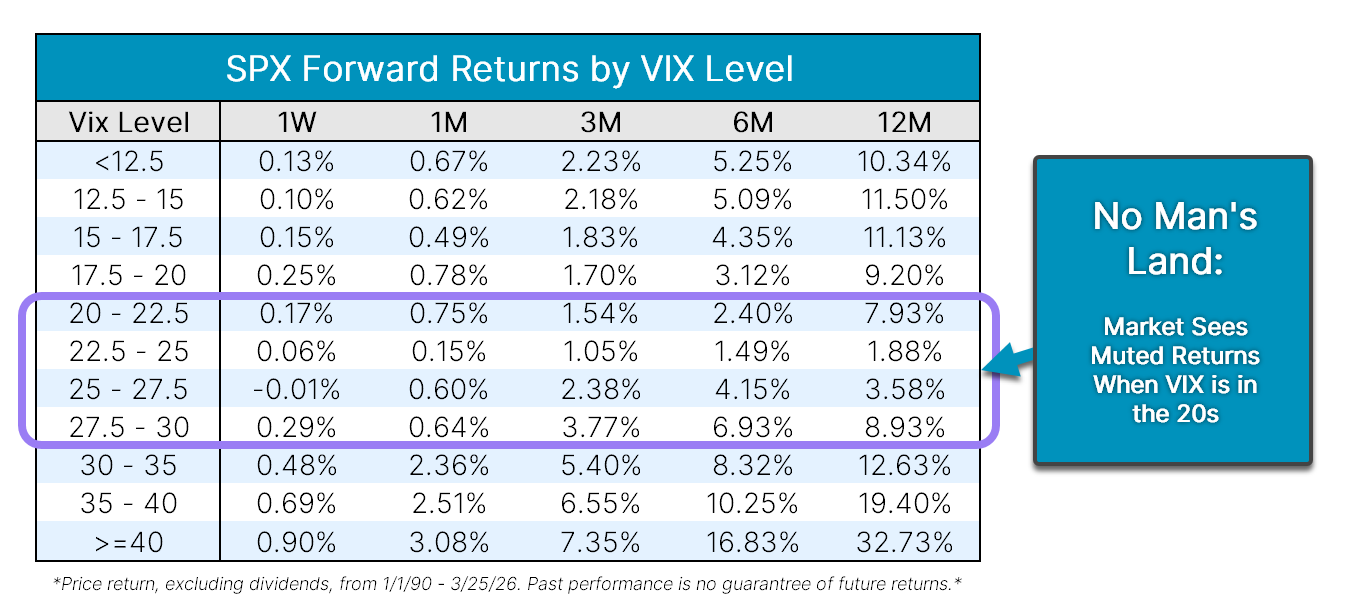
When it comes to the VIX, markets tend to perform best during periods of extremely low or high volatility, with investors cruising in stability or rebounding out of potentially oversold and volatile territory. Meanwhile, a VIX between 20 and 30 can be a no man’s land. When the VIX was between 27.5 and 30, the S&P 500 averaged a one-year return of 8.9%, with levels between 20 and 27.5 being even more muted. However, movements above 30 or below 20 could signal a more bullish outlook for the market given historical tendencies. Additionally, there are some other positive signs from the current VIX.
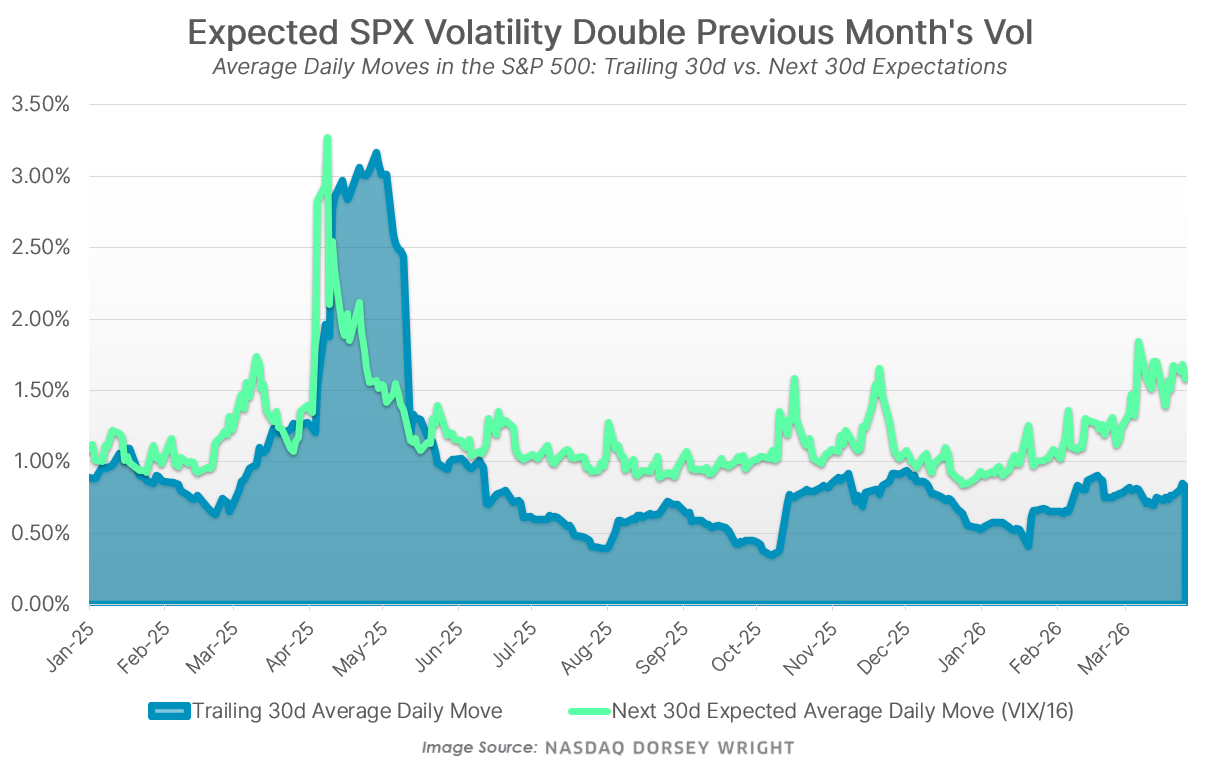
Another way to interpret the VIX is using the rule of 16, which states that the average daily change in SPX is equal to the VIX divided by 16. Presently, our reading of 28 divided by 16 is 1.75, meaning that the market is expecting an average daily move of 1.75% over the next month. However, the market has yet to see a single day with that magnitude of movement over the last month, with the most recent 1.75% up or down day occurring on February 6th. Meanwhile, the realized volatility of the S&P 500 over the last month has been approximately 13, or the equivalent of an 0.8% average daily move. Consequently, the market expects the next month to be roughly twice as volatile as the previous month, marking a significant disconnect between recent and expected volatility.
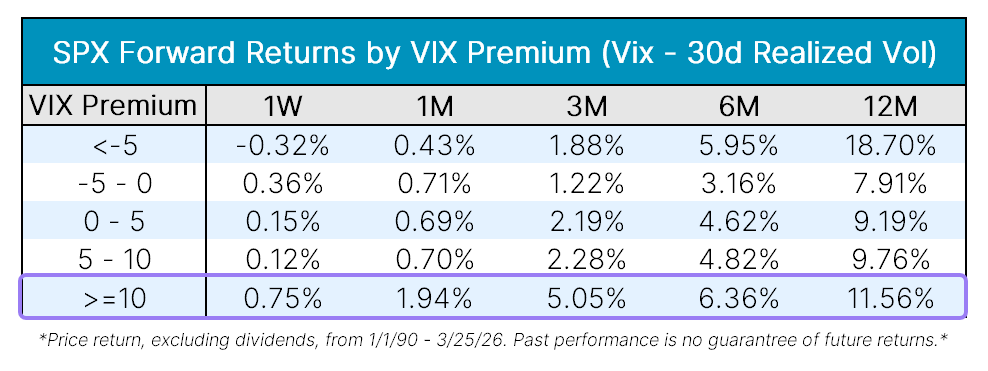
When the market is expecting volatility to increase significantly from recent levels, it has historically been a signal that the market is overly fearful. For context, the current 15-point premium between the VIX and realized volatility ranks in nearly the 99th percentile of instances. When the VIX was ten points higher than trailing volatility, the S&P 500 gained an average of 5% over the next three months, highlighting that similar instances may have displayed excessive fear.
While overall volatility levels place us in cautious territory, investors appear to be overly fearful in the near term given the expected increases in volatility and consensus negative sentiment. Warren Buffett once said, “Be fearful when others are greedy and greedy when others are fearful.” With the market moving into fearful territory, it wouldn’t be surprising to see investors become greedier over the coming weeks, even with unanswered questions about the long-term outlook of the market.

Breadth in the fixed income market is the narrowest it has been in several months as most US core groups now sit near the bottom of the Asset Class Group Scores fixed income rankings. Meanwhile, high yield spreads have widened recently suggesting a risk-off posture towards credit, making this a challenging environment for investors seeking yield. With that in mind, we though this would be an opportune time to update our check-a-month strategy. The check-a-month strategy involves buying a group of high-yielding, quarterly-dividend-paying stocks with dividend payment dates spread across the quarter so that the client receives a dividend check(s) each month.
When building a check-a-month portfolio, it is essential to select not only high-yielding stocks but also stocks with a healthy technical picture to better stack the odds of future outperformance in your favor. After all, your client won't be impressed with their 3% yield if the market value of their portfolio drops by 15%. Looking only at dividend yield, we found that there are 114 stocks in the S&P 500 with a dividend yield of 3% or higher. However, when we narrow our search using a technical overlay, we are left with 32 stocks. A list of all the criteria we inputted in the Security Screener tool is below:
S&P 500 Universe
Price = >$10
Trend = Positive
Technical Attributes = 3+
Dividend Yield > 3%
You will find all 32 names in the table below categorized into three groups based on their usual dividend payment schedule. We've highlighted a couple of our favorites below the table.
Early Quarter Dividend Payout (January, April, July, October)
Mid-Quarter Dividend Payout (February, May, August, November)
Late Quarter Dividend Payout (March, June, September, December)
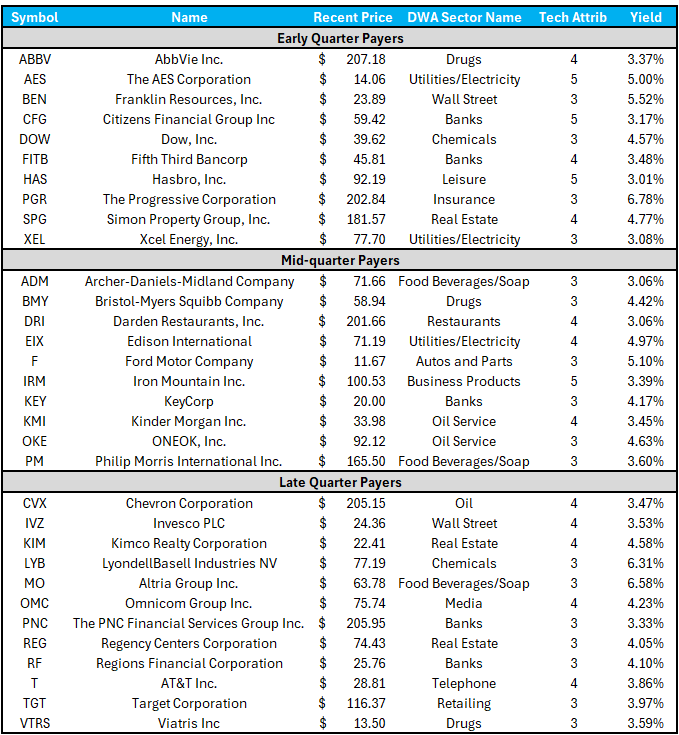
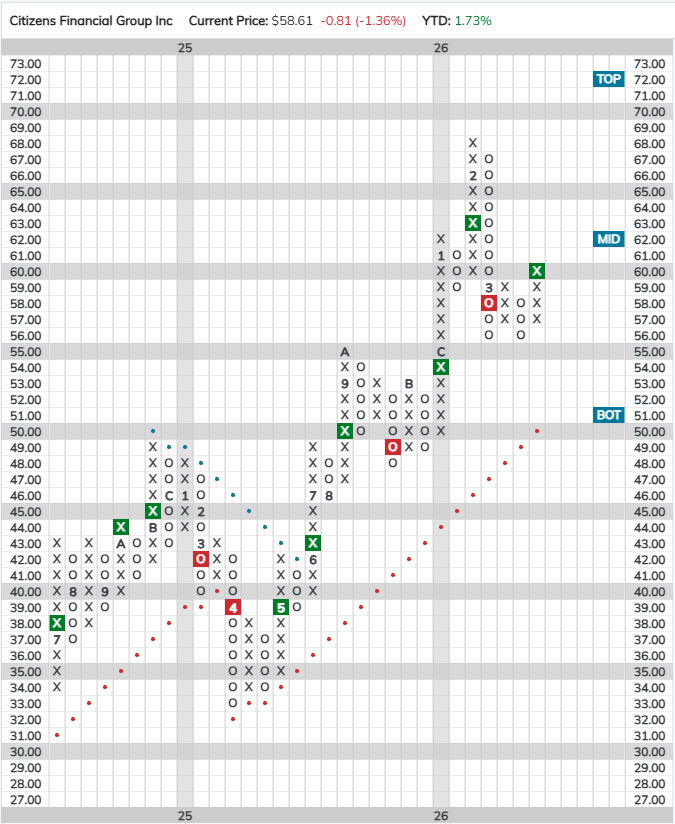
CFG Citizens Financial Group Inc ($58.61) - Banks – CFG is a 5for 5’er that ranks ninth of 168 names in the favored banks sector matrix and carries a 3.17% yield. CFG has demonstrated long-term relative strength versus its peers as it has been on an RS buy signal against the NDW Bank Index (DWABANK) since 2017. On its default chart, the stock returned to a buy signal this week when it broke a double top at $60, but remains below the middle of its trading band, offering a potentially opportune entry point for long exposure. Year-to-date (through 3/25) CFG has gained 1.73% on a price return basis.
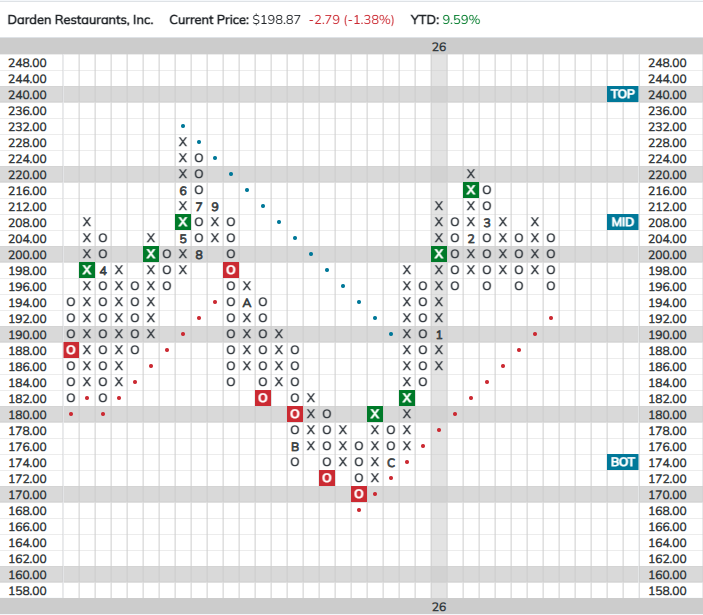
DRI Darden Restaurants, Inc. ($198.87) - Restaurants -DRI is a 4 for 5’er that has been on market and peer RS buy signals since 2020 and 2021 respectively and carries a 3.06% yield. On its default chart, DRI has completed four consecutive buy signal, most recently breaking a double top at $216 last month. DRI has subsequently pulled back to form significant support at $196, as the stock has reversed up from that level three times since January. Year-to-date (through 3/25) DRI has gained 9.59% on a price return basis, outperforming the S&P 500 (SPX) by more than 13%.
Average Level
-31.35
| < - -100 | -100 - -80 | -80 - -60 | -60 - -40 | -40 - -20 | -20 - 0 | 0 - 20 | 20 - 40 | 40 - 60 | 60 - 80 | 80 - 100 | 100 - > |
|---|---|---|---|---|---|---|---|---|---|---|---|
|
Sell signalXLG
|
|||||||||||
|
Buy signalSPY
|
|||||||||||
|
Sell signalefa
|
|||||||||||
|
Buy signalVOOV
|
|||||||||||
|
Sell signalVOOG
|
|||||||||||
|
Buy signalfxe
|
|||||||||||
|
Buy signalrsp
|
Buy signalEEM
|
||||||||||
|
Sell signalONEQ
|
Sell signaltlt
|
||||||||||
|
Sell signalgld
|
Buy signaliwm
|
||||||||||
|
Sell signaldia
|
Sell signalief
|
Buy signalIJH
|
|||||||||
|
Buy signalshy
|
Sell signalagg
|
Sell signalQQQ
|
Buy signalijr
|
Buy signalUSO
|
|||||||
|
Buy signalhyg
|
Sell signallqd
|
Buy signalicf
|
Buy signaldvy
|
Buy signalGCC
|
Buy signaldx/y
|
Buy signalGSG
|
|||||
| < - -100 | -100 - -80 | -80 - -60 | -60 - -40 | -40 - -20 | -20 - 0 | 0 - 20 | 20 - 40 | 40 - 60 | 60 - 80 | 80 - 100 | 100 - > |
| AGG | iShares US Core Bond ETF |
| USO | United States Oil Fund |
| DIA | SPDR Dow Jones Industrial Average ETF |
| DVY | iShares Dow Jones Select Dividend Index ETF |
| DX/Y | NYCE U.S.Dollar Index Spot |
| EFA | iShares MSCI EAFE ETF |
| FXE | Invesco CurrencyShares Euro Trust |
| GLD | SPDR Gold Trust |
| GSG | iShares S&P GSCI Commodity-Indexed Trust |
| HYG | iShares iBoxx $ High Yield Corporate Bond ETF |
| ICF | iShares Cohen & Steers Realty ETF |
| IEF | iShares Barclays 7-10 Yr. Tres. Bond ETF |
| LQD | iShares iBoxx $ Investment Grade Corp. Bond ETF |
| IJH | iShares S&P 400 MidCap Index Fund |
| ONEQ | Fidelity Nasdaq Composite Index Track |
| QQQ | Invesco QQQ Trust |
| RSP | Invesco S&P 500 Equal Weight ETF |
| IWM | iShares Russell 2000 Index ETF |
| SHY | iShares Barclays 1-3 Year Tres. Bond ETF |
| IJR | iShares S&P 600 SmallCap Index Fund |
| SPY | SPDR S&P 500 Index ETF Trust |
| TLT | iShares Barclays 20+ Year Treasury Bond ETF |
| GCC | WisdomTree Continuous Commodity Index Fund |
| VOOG | Vanguard S&P 500 Growth ETF |
| VOOV | Vanguard S&P 500 Value ETF |
| EEM | iShares MSCI Emerging Markets ETF |
| XLG | Invesco S&P 500 Top 50 ETF |

| Symbol | Company | Sector | Current Price | Action Price | Target | Stop | Notes |
|---|---|---|---|---|---|---|---|
| WBS | Webster Financial Corporation | Banks | $69.45 | hi 60s - low 70s | 91 | 58 | 4 for 5'er, top 25% of BANK sector matrix, one box from peer RS buy, buy on pullback, 2.2% yield |
| CGON | CG Oncology, Inc. | Biomedics/Genetics | $65.81 | hi 50s - low 60s | 80 | 50 | 5 for 5'er, 18 of 162 in BIOM sector matrix, bullish catapult, good R-R, Earn. 3/26 |
| COCO | Vita Coco Company, Inc. | Food Beverages/Soap | $53.87 | mid-to-hi 50s | 72 | 48 | 5 for 5'er, top half of FOOD sector matrix, LT pos peer & mkt RS, pos trend flip |
| DGII | Digi International Inc | Telephone | $50.66 | upper 40s to lower 50s | 61 | 40 | 5 for 5'er; top quartile of Telephone matrix; buy signal since May '25, pos. trend since June '25. |
| BRX | Brixmor Property Group Inc | Real Estate | $28.71 | hi 20s - lo 30s | 38 | 24 | 4 for 5'er, top third of REAL sector matrix, LT pos peer & mkt RS, LT pos trend, bullish triangle, 4% yield |
| CNX | CNX Resources Corp | Oil | $40.38 | hi 30s - mid 40s | 71 | 33 | 5 TA rating, top 50% of OIL sector matrix, LT RS buy and pos trend, consec buy signals |
| FFIV | F5 Inc. | Internet | $297.86 | 280s - 290s | 344 | 256 | 4 for 5'er, top third of INET sector matrix, LT pos peer RS, spread quad top |
| INVA | Innoviva, Inc | Drugs | $22.59 | lo-mid 20s | 32.50 | 18.50 | 5 TA rating, top half of drugs sector RS matrix, LT pos trend, LT RS buy, buy-on-pullback |
| ARCB | ArcBest Corp. | Transports/Non Air | $95.77 | low-to-mid 90s | 113 | 79 | 4 for 5'er, one box from market RS buy, top half of favored TRAN sector matrix, good R-R |
| GSK | GlaxoSmithKline Plc. (United Kingdom) ADR | Drugs | $54.70 | hi 40s - mid 50s | 67 | 42 | 5 TA rating, top 25% of DRUG sector matrix, LT pos trend, yield > 3%, buy-on-pullback |
| ADI | Analog Devices, Inc. | Semiconductors | $322.03 | 310s - 330s | 380 | 268 | 4 for 5'er, top half of favored SEMI sector matrix, LT pos market RS, return to buy signal |
| CSCO | Cisco Systems, Inc. | Computers | $81.83 | Upper 70s to lower 80s | 96 | 70 | 5 for 5'er; top quintile of Computers matrix; Pos. Trend since Sept. '24; Bull Triangle on 3/25. |
| Symbol | Company | Sector | Current Price | Action Price | Target | Stop | Notes |
|---|---|---|---|---|---|---|---|
| CPRT | Copart Incorporated | Autos and Parts | $33.08 | hi 30s | 28 | 42 | 1 TA rating, bottom 50% of AUTO sector matrix, NT and mkt RS sell last month, consec sell signals |
| Comment | |||||||
|---|---|---|---|---|---|---|---|
|
|
|||||||
CSCO Cisco Systems, Inc. R ($82.61) - Computers - Cisco Systems has been at least a 3 technical attribute rated stocks since November 2025 and currently maintains a 5 TA after seeing its peer relative strength chart return to a buy signal at the beginning of February. After giving an initial sell signal at the end of February on the default trend chart, CSCO consolidated during March, forming a triangle pattern through the first three weeks of the month and completing the bullish triangle during Wednesday’s (3/25) trading by breaking a double top at $81. Along with superior peer relative strength and ranking within the top quintile of the Computers sector matrix, CSCO maintains positive long-term relative strength against the market as well. Okay to consider here on the breakout in the lower $80s or on a pullback to the upper $70s. The stop loss point will be set for $70, which would violate multiple support levels dating back to November of last year. The bullish price objective of $96 will serve as the price target. Cisco is accompanied by a current yield north of 2%.
| 26 | |||||||||||||||||||||||||||||
| 88.00 | X | 88.00 | |||||||||||||||||||||||||||
| 87.00 | X | O | 87.00 | ||||||||||||||||||||||||||
| 86.00 | X | O | 86.00 | ||||||||||||||||||||||||||
| 85.00 | X | O | 85.00 | ||||||||||||||||||||||||||
| 84.00 | X | X | O | 84.00 | |||||||||||||||||||||||||
| 83.00 | X | O | X | O | 83.00 | ||||||||||||||||||||||||
| 82.00 | X | O | X | O | X | 82.00 | |||||||||||||||||||||||
| 81.00 | X | O | O | X | X | 81.00 | |||||||||||||||||||||||
| 80.00 | X | X | 2 | O | 3 | O | X | X | 80.00 | ||||||||||||||||||||
| 79.00 | X | X | O | C | O | X | X | O | X | O | X | O | X | 79.00 | |||||||||||||||
| 78.00 | X | O | X | O | X | O | X | O | X | O | X | O | X | O | X | Mid | 78.00 | ||||||||||||
| 77.00 | X | O | X | O | X | O | X | O | X | O | X | O | X | O | 77.00 | ||||||||||||||
| 76.00 | X | O | O | O | 1 | X | O | X | O | • | 76.00 | ||||||||||||||||||
| 75.00 | X | O | X | O | X | • | 75.00 | ||||||||||||||||||||||
| 74.00 | B | X | O | X | O | • | 74.00 | ||||||||||||||||||||||
| 73.00 | X | O | X | O | • | 73.00 | |||||||||||||||||||||||
| 72.00 | X | X | O | X | • | 72.00 | |||||||||||||||||||||||
| 71.00 | X | O | X | O | • | 71.00 | |||||||||||||||||||||||
| 70.00 | 8 | O | A | X | • | 70.00 | |||||||||||||||||||||||
| 69.00 | X | O | X | O | X | • | 69.00 | ||||||||||||||||||||||
| 68.00 | X | O | X | O | X | • | 68.00 | ||||||||||||||||||||||
| 67.00 | X | O | X | O | • | 67.00 | |||||||||||||||||||||||
| 66.00 | 6 | O | • | Bot | 66.00 | ||||||||||||||||||||||||
| 65.00 | X | • | 65.00 | ||||||||||||||||||||||||||
| 64.00 | X | • | 64.00 | ||||||||||||||||||||||||||
| 63.00 | X | • | 63.00 | ||||||||||||||||||||||||||
| 62.00 | X | • | 62.00 | ||||||||||||||||||||||||||
| 61.00 | X | • | 61.00 | ||||||||||||||||||||||||||
| 60.00 | X | • | 60.00 | ||||||||||||||||||||||||||
| 59.00 | X | • | 59.00 | ||||||||||||||||||||||||||
| 58.00 | X | 5 | • | 58.00 | |||||||||||||||||||||||||
| 57.00 | O | X | O | X | • | 57.00 | |||||||||||||||||||||||
| 56.00 | O | X | O | X | • | 56.00 | |||||||||||||||||||||||
| 55.00 | O | O | X | • | 55.00 | ||||||||||||||||||||||||
| 54.00 | O | • | 54.00 | ||||||||||||||||||||||||||
| 26 |
| EL Estee Lauder Companies ($69.75) - Household Goods - Shares of EL fell once again Thursday, seeing the stock move to its fifth consecutive sell signal. The name has weakened significantly this year, falling to a 2 for 5'er after moving into a negative trend and losing near-term relative strength. Those with positions should look to sell eventually, but should wait given EL's oversold position way below the bottom of its 10 week trading band. |
| SBUX Starbucks Corporation ($90.98) - Restaurants - SBUX broke a double bottom at $91 for a second sell signal. This follows the stock shifting the trend to negative, which dropped the stock down to a 2 for 5'er as shares have fallen to their lowest level since January this year. Beyond support at current chart levels additional may be found in the mid to lower $80s. |

| Name | Option Symbol | Action | Stop Loss |
|---|---|---|---|
| Bristol-Myers Squibb Company - $59.35 | BMY2618F60 | Buy the June 60.00 calls at 3.15 | 53.00 |
| Name | Option | Action |
|---|---|---|
| Cisco Systems, Inc. ( CSCO) | Jun. 80.00 Calls | Raise the option stop loss to 4.65 (CP: 6.65) |
| Archer-Daniels-Midland Company ( ADM) | May. 65.00 Calls | Raise the option stop loss to 5.70 (CP: 8.70) |
| Name | Option Symbol | Action | Stop Loss |
|---|---|---|---|
| T-Mobile US Inc. - $211.86 | TMUS2618R210 | Buy the June 210.00 puts at 11.75 | 228.00 |
| Name | Option | Action |
|---|---|---|
| Uber Technologies, Inc. ( UBER) | Jun. 75.00 Puts | Raise the option stop loss to 5.65 (CP: 7.65) |
| Name | Option Sym. | Call to Sell | Call Price | Investment for 500 Shares | Annual Called Rtn. | Annual Static Rtn. | Downside Protection |
|---|---|---|---|---|---|---|---|
| Palantir Technologies Inc. Class A $ 154.96 | PLTR2617G150 | Jul. 150.00 | 18.00 | $ 65,956.25 | 40.66% | 40.00% | 11.02% |
| Name | Action |
|---|---|
| Intel Corporation ( INTC) - 47.18 | Sell the May 49.00 Calls. |
| Micron Technology, Inc. ( MU) - 382.09 | Sell the June 420.00 Calls. |
| Moderna, Inc. ( MRNA) - 53.54 | Sell the April 55.00 Calls. |
| Fortinet Inc. ( FTNT) - 78.89 | Sell the May 85.00 Calls. |
| Invesco PLC ( IVZ) - 24.36 | Sell the May 24.00 Calls. |
| DuPont de Nemours Inc. ( DD) - 46.33 | Sell the May 45.00 Calls. |
| CF Industries Holdings, Inc. ( CF) - 128.11 | Sell the April 127.00 Calls. |
| Name | Covered Write |
|---|---|
| ONEOK, Inc. ( OKE - 92.12 ) | July 95.00 covered write. |
Daily Equity & Market Analysis
LISTEN TO PODCAST
Mar 26, 2026
NDW MORNING UPDATE
Mar 26, 2026
Loading, Please Wait...
