
The second year in a presidential term is typically of particular importance to the stock market, and 2026 has already exhibited themes typical of an average midterm election year, suggesting that historical patterns may offer guidance for what the rest of the year has in store.
The second year in a presidential term is typically of particular importance to the stock market, as early policy optimism may fade while midterm elections introduce additional uncertainty. There have been plenty of reasons for downside over the last quarter, but many of them have been indirectly tied to politics. While investors are still months away from the midterm elections in November, 2026 has already exhibited themes typical of an average midterm election year, suggesting that historical patterns may offer guidance for what the rest of 2026 has in store.
The second year of a presidential term is most notable for coinciding with the weakest domestic equity returns among the four years in the presidential cycle. Specifically, the market has averaged roughly a 12% return in non‑midterm years since 1960. In contrast, during midterm election years, the S&P 500 has historically averaged a 1% decline, underscoring the significant underperformance seen in second‑year periods. Furthermore, some of the worst market performances on record have occurred during midterm years, including three of the four worst years for the S&P 500.

However, there are signs that support optimism for the later part of the year. To begin with, midterm election years often see markets bottom before rallying in the back half of the year. From the start of October through the rest of the year, SPX has averaged a return of more than 5% in the fourth quarter alone. If the market continues to decline or enters a bear market, October appears to be the most likely point for a bottom, especially given the month’s reputation as the “bear killer.” Additionally, the third year of a presidential term is easily the strongest, averaging a full-year gain of 17.2%. If the market can hold on until the last quarter, it could see seasonal tailwinds that push it higher over the following months and year ahead.

Another major theme in 2026 has been the underperformance of large‑cap stocks relative to small caps. While small caps and the Russell 2000 are down roughly 1% in 2026, they are still outperforming the S&P 500 by more than 5%, which would mark the largest advantage for the Russell 2000 since 2016. Interestingly, previous midterm election years have also tended to show small‑cap outperformance in the first quarter. Specifically, the Russell 2000 has averaged a 2.4% return in the first quarter of midterm years, compared with a 0.2% decline for the S&P 500. However, from the end of the first quarter onward, the S&P 500 averages a rest-of-year return that’s 3% higher than the Russell 2000 in midterm years, offering some optimism for large caps.

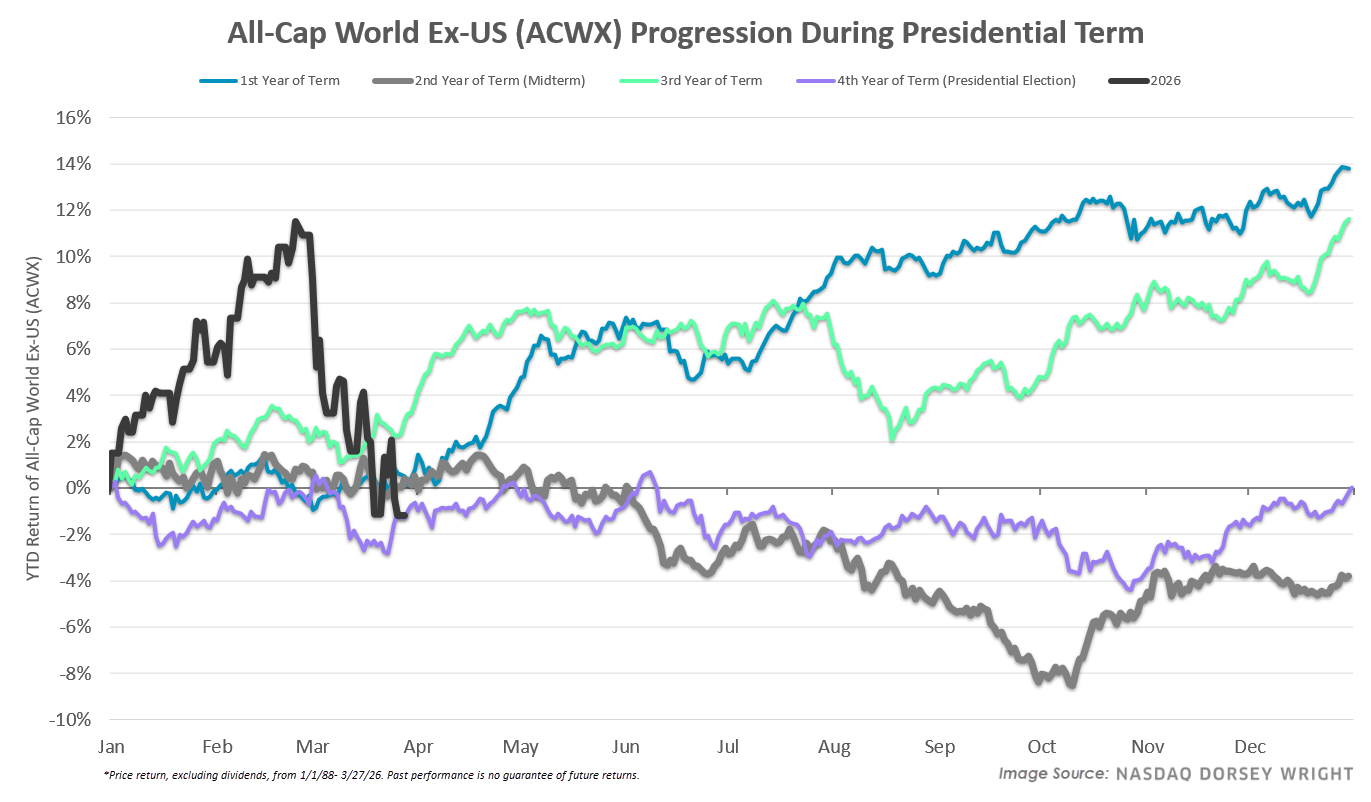
Although international equities operate on entirely different continents than the US, the asset class is not insulated from the effects of US policy, with the conflict involving Iran serving as a recent example. The All-Cap World Ex-US ETF (ACWX) was up by almost 12% in the back half of February, but following US military action in Iran and the resulting surge in energy prices, the fund has since erased its prior gains. Previous US midterm election years have also been challenging for international equities, with the group averaging a full‑year decline of 4%, which is the worst performance of any presidential‑cycle year since 1988, even though they typically recoup some losses in the final quarter.
Overall, midterm election years have historically offered more volatility than any other part of the presidential cycle, so investors should brace for continued uncertainty, particularly as global unrest and conflict persist. The one silver lining is that a potential resolution of uncertainty, whether that be the conflict in Iran or midterm elections, could create an opportunity for the market to rebound, even if stocks sell off further in the near term.
