Most Requested Symbols

The Magnificent Seven has struggled to start the year, is it time to give up on the mega cap stalwarts?
Today we explore the model builder in greater detail and talk about the effects of including different overlays onto a more "basic" model
Weekly Rundown Video – Mar 12, 2026
Weekly rundown with NDW analyst team covering all major asset classes.
Weekly rundown with NDW analyst team covering all major asset classes.
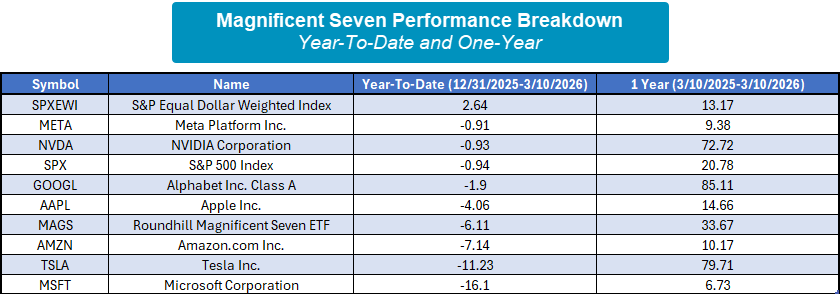
The “Magnificent Seven” has been a dominant force in the market for years, consistently carrying the cap-weighted indices higher while equal-weighted schemas languished. The last few months have seen that trend change as the S&P 500 Equal Weight Index (SPXEWI) outpaces the S&P 500 Index (SPX) by roughly 3.5% year-to-date (2.64% versus -0.94%). The Magnificent Seven stocks, a large portion of the SPX, have really struggled this year relative to the SPXEWI. Using the Roundhill Magnificent Seven ETF (MAGS) as a representative, MAGS is down more than 6% this year with every Magnificent Seven stock in the red year-to-date. However, over the last year, MAGS is up 33.67% versus 13.17% for the SPXEWI and 20.78% for the SPX. So, we’ll need to see a longer or more severe period of underperformance before the evidence starts to pile up against the Magnificent Seven. One interesting point is the dispersion within the Mag Seven stocks over the last year with Alphabet (GOOGL), NVIDIA (NVDA), and Tesla (TSLA) each gaining over 70% while Meta (META) and Microsoft (MSFT) returned less than 10%.
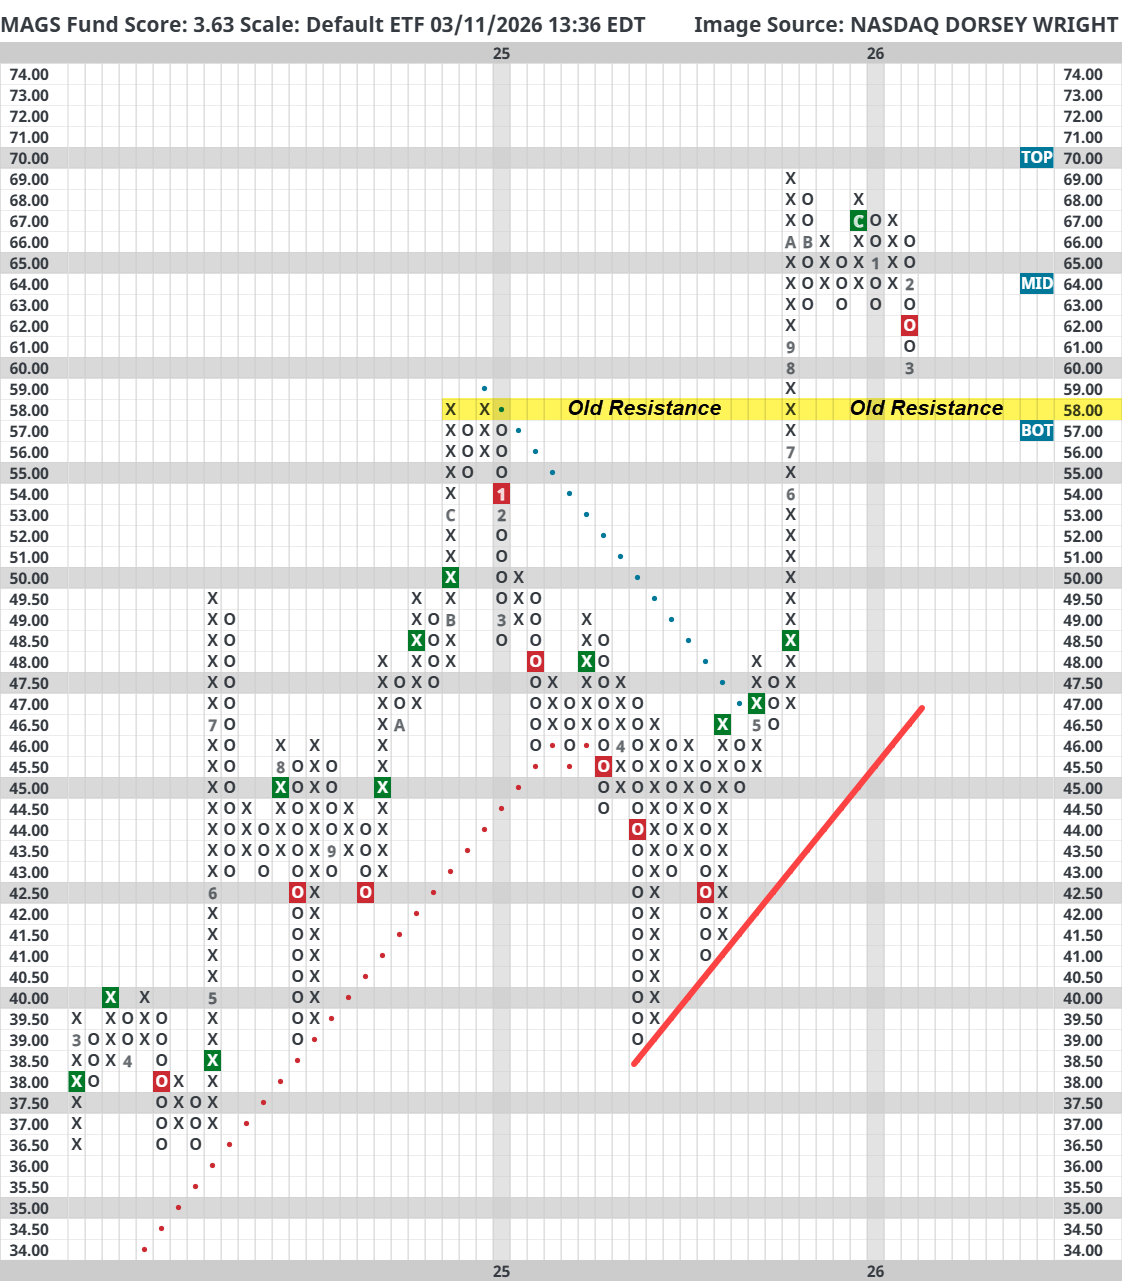
Focusing on MAGS’s chart action, the fund broke a quadruple bottom in February, its first sell signal since April 2025. The immediate concern at first glance is the lack of established support nearby. Prior resistance at $58 may act as support but below that there is no established support until $46.50. The fund score for MAGS is still in acceptable territory at 3.63, but it does have a 2.21 negative score direction, which speaks to its decline in relative strength over the last few months. While these handful of mega cap names have slowed down, many are still in strong standing on an individual basis. When looking to trim or exit one of the Mag Seven names that are likely in at least a few of your clients’ portfolios, be sure to check on the individual technical pictures for each even if the overall group has slowed down. Secondly, the strong performance of these handful of names may have led portfolios to having an outsized allocation. So, this could be a good opportunity to reallocate portfolios towards emerging areas of relative strength without completely selling out of the Mag Seven. If these mega caps continue to weaken, then more changes will be needed.

Lots of recent research has hit on changes around the platform and what that could ultimately mean for the state of trendfollowing within your portfolio. Growth names have rolled over slightly and the uptick in energy focused commodities have led to several shifts within the broader DALI and Asset Class Group Scores rankings. As strength shifts, we thought it would be useful to look underneath the hood of our model builder tool… to detail how you can utilize the platform to create bespoke custom models to take advantage of shifts of strength. More specifically, we will use the model builder to discuss the different levers you can pull… from Technical Attribute Score overlays, sector maximums, etc. and the overall effect on performance, risk, and model compatibility.
To lay the groundwork, we will utilize a matrix based model focusing on the NDX as our starting universe. From there, we will look to own the top five stocks within the overall rankings based on their buy count, evaluated on a monthly basis. The model will sell once the holding falls out of the top third of the rankings. This setup is similar to the pre-made NDW NDX Model (NDXMODEL.TR) except that model focuses on ten holdings and cuts our losers a bit shorter than the premade. Enter the first benefit of the custom modeler- the ability for you to put your own spin on an existing NDW strategy, without compromising the integrity of the overall process. This model on its own is quite impressive- growing at a CAGR of ~18.50% since 2001 vs. the ~9.65% for benchmark NDX. For the uninitiated- this screen certainly has a lot going on. A few important places the analysts look at when we create models are the returns (obviously) across different timeframes & the max 6-month drawdown and turnover numbers. We want our drawdown to be low (in this case this model’s drawdown is slightly worse than our benchmark) & turnover metrics to be “reasonable”. That definition is different for every client… but most of our premade models hover around 100%-200% per year. In this case, our model is above that threshold- turning over about 2.3 times per year. This works for some clients, not for others. Another important thing to keep in mind is the type of account you place these models in- a qualified account can withstand more trading than something that your clients will be paying taxes on in the near-term.
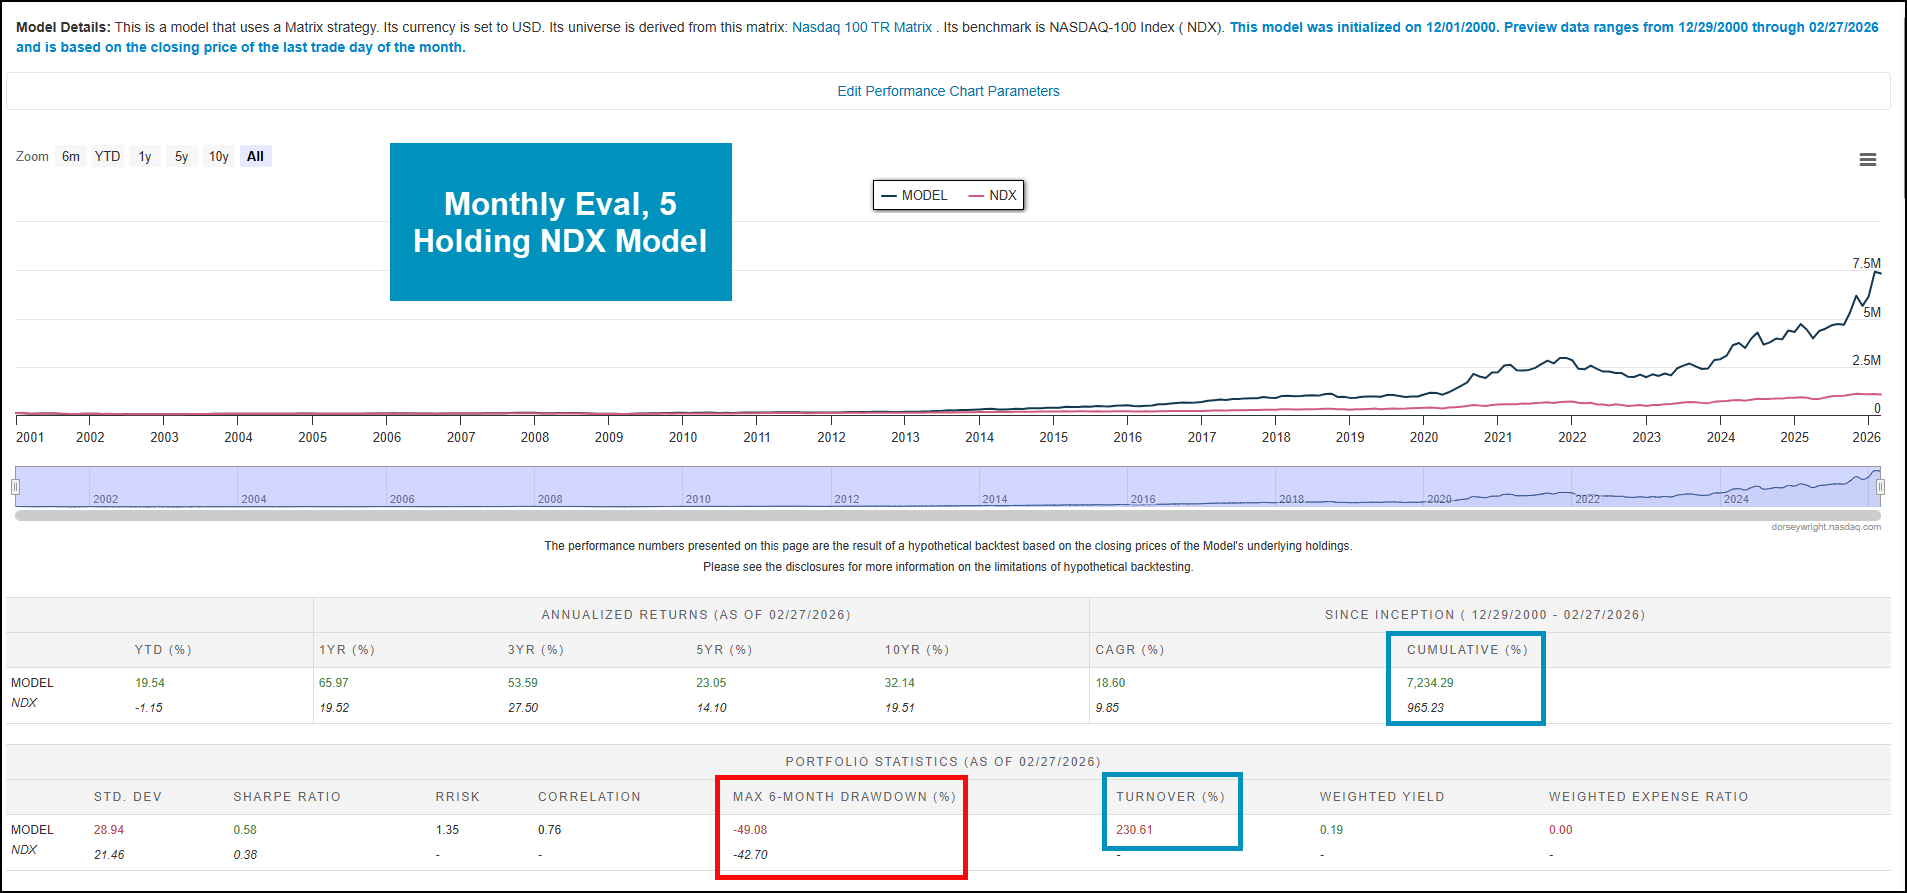
This is the most “basic” model possible: we gave the system a target number of holdings, buy and sell criteria, and an evaluation frequency. There are, however, several different levers you can pull to “enhance” the model in one form or another. The first adjustment we can make is applying an overlay filter that instructs our model to buy those stocks at the top of the matrix…. But only if they are rated a 4 or 5 technical attribute score. In doing so, we can add another layer to our security selection process. Adding this in adds an extra ~700% to our cumulative returns (+~.4% p/year) since December of 2000. Perhaps most useful about this addition is that it decreases our max 6-month drawdown by roughly 10% to -40.13%, a metric lower than that of our benchmark. When you think about it, this makes sense… by ensuring that there are only 4 or 5 rated stocks in our portfolio, we avoid the 3’s… which become 2’s, 1’s, or 0’s. Our turnover increases slightly, but not enough that the decreased drawdown isn’t “worth it”.
While today’s piece focused on a possible strategy in the model builder, know that this process is applicable to those of you not using the builder as well. By isolating those stocks at the top of the matrix while ensuring names that also score well according to the TA system, we can add more weight of the evidence to our picks. While we cant ensure that this strategy will be additive in all scenarios, those of you looking to test different strategies may find it useful to play around with different overlays. We didn’t discuss cash triggers which allow your strategies to raise varying levels of cash for more defensive clients, or sector maximums to ensure that you don’t get too overallocated to any one specific area of the market. It is also worth noting that a frequent use case for many is to blend together different models (a combination of 5 holding models for various universes like NDX, SPX, .DJIA, or another custom sleeve) to create a more robust 15-20 holding model that satisfies compliance requirements.

All this to say, there are a virtually endless number of possibilities available to you to play around with in the builder. If you would like to discuss building out a model similar to this, feel free to email at miles.clark@nasdaq.com for more information or a trial of the model builder.
Each week the analysts at NDW review and comment on all major asset classes in the global markets. Shown below is the summary or snapshot of the primary technical indicators we follow for multiple areas. Should there be changes mid-week we will certainly bring these to your attention via the report.
| Universe | BP Col & Level (actual) | BP Rev Level | PT Col & Level (actual) | PT Rev Level | HiLo Col & Level (actual) | HiLo Rev Level | 10 Week Col & Level (actual) | 10 Week Rev Level | 30 Week Col & Level (actual) | 30 Week Rev Level |
|---|---|---|---|---|---|---|---|---|---|---|
| ALL |
|
44% |
|
38% |
|
58% |
|
42% |
|
50% |
| NYSE |
|
52% |
|
60% |
|
70% |
|
48% |
|
60% |
| OTC |
|
42% |
|
34% |
|
50% |
|
40% |
|
46% |
| World |
|
44% |
|
50% |
|
|
|
42% |
|
54% |

Remember, these are technical comments only. Just as you must be aware of fundamental data for the stocks we recommend based on technical criteria in the report, so too must you be aware of important data regarding delivery, market moving government releases, and other factors that may influence commodity pricing. We try to limit our technical comments to the most actively traded contracts in advance of delivery, but some contracts trade actively right up to delivery while others taper off well in advance. Be sure you check your dates before trading these contracts. For questions regarding this section or additional coverage of commodities email james.west@nasdaq.com.
Data represented in the table below is through 3/11/26:
| Symbol | Name | Price | PnF Trend | RS Signal | RS Col. | 200 Day MA | Weekly Mom |
|---|---|---|---|---|---|---|---|
| CL/ | Crude Oil Continuous | 83.45 | Positive | Sell | X | 63.24 | + 11W |
| DBLCIX | Deutsche Bank Liquid Commodities Index | 468.52 | Positive | Sell | O | 460.74 | - 35W |
| DWACOMMOD | NDW Continuous Commodity Index | 1156.38 | Positive | Buy | O | 1029.90 | + 2W |
| GC/ | Gold Continuous | 5229.70 | Positive | Buy | X | 4000.38 | - 1W |
| HG/ | Copper Continuous | 5.90 | Negative | Buy | O | 5.18 | - 7W |
| ZG/ | Corn (Electronic Day Session) Continuous | 452.25 | Positive | Sell | O | 423.14 | + 3W |

Average Level
-1.54
| < - -100 | -100 - -80 | -80 - -60 | -60 - -40 | -40 - -20 | -20 - 0 | 0 - 20 | 20 - 40 | 40 - 60 | 60 - 80 | 80 - 100 | 100 - > |
|---|---|---|---|---|---|---|---|---|---|---|---|
|
Sell signallqd
|
|||||||||||
|
Buy signalefa
|
|||||||||||
|
Sell signalXLG
|
|||||||||||
|
Buy signaliwm
|
|||||||||||
|
Buy signalijr
|
|||||||||||
|
Buy signalSPY
|
Buy signalrsp
|
||||||||||
|
Sell signalONEQ
|
Buy signalagg
|
||||||||||
|
Buy signalfxe
|
Buy signalVOOV
|
Buy signalQQQ
|
|||||||||
|
Buy signalshy
|
Sell signalVOOG
|
Buy signalEEM
|
Sell signaltlt
|
Buy signalGLD
|
Buy signalGSG
|
||||||
|
Buy signalhyg
|
Buy signaldia
|
Buy signalIJH
|
Buy signalief
|
Buy signaldvy
|
Sell signaldx/y
|
Buy signalicf
|
Buy signalgcc
|
Buy signalUSO
|
|||
| < - -100 | -100 - -80 | -80 - -60 | -60 - -40 | -40 - -20 | -20 - 0 | 0 - 20 | 20 - 40 | 40 - 60 | 60 - 80 | 80 - 100 | 100 - > |
| AGG | iShares US Core Bond ETF |
| USO | United States Oil Fund |
| DIA | SPDR Dow Jones Industrial Average ETF |
| DVY | iShares Dow Jones Select Dividend Index ETF |
| DX/Y | NYCE U.S.Dollar Index Spot |
| EFA | iShares MSCI EAFE ETF |
| FXE | Invesco CurrencyShares Euro Trust |
| GLD | SPDR Gold Trust |
| GSG | iShares S&P GSCI Commodity-Indexed Trust |
| HYG | iShares iBoxx $ High Yield Corporate Bond ETF |
| ICF | iShares Cohen & Steers Realty ETF |
| IEF | iShares Barclays 7-10 Yr. Tres. Bond ETF |
| LQD | iShares iBoxx $ Investment Grade Corp. Bond ETF |
| IJH | iShares S&P 400 MidCap Index Fund |
| ONEQ | Fidelity Nasdaq Composite Index Track |
| QQQ | Invesco QQQ Trust |
| RSP | Invesco S&P 500 Equal Weight ETF |
| IWM | iShares Russell 2000 Index ETF |
| SHY | iShares Barclays 1-3 Year Tres. Bond ETF |
| IJR | iShares S&P 600 SmallCap Index Fund |
| SPY | SPDR S&P 500 Index ETF Trust |
| TLT | iShares Barclays 20+ Year Treasury Bond ETF |
| GCC | WisdomTree Continuous Commodity Index Fund |
| VOOG | Vanguard S&P 500 Growth ETF |
| VOOV | Vanguard S&P 500 Value ETF |
| EEM | iShares MSCI Emerging Markets ETF |
| XLG | Invesco S&P 500 Top 50 ETF |

| Symbol | Company | Sector | Current Price | Action Price | Target | Stop | Notes |
|---|---|---|---|---|---|---|---|
| ABBV | AbbVie Inc. | Drugs | $227.01 | 210s - low 230s | 284 | 188 | 5 for 5'er, favored DRUG sector, LT pos peer & mkt RS, breakout from consec sell signals, 2.9% yield |
| AB | AllianceBernstein Holding LP | Wall Street | $38.80 | low 40s | 64 | 32 | 3 TA rating, LT mkt RS buy, LT pos trend, top 50% of WALL sector matrix, consec buy signals, buy-on-pullback, yield > 8% |
| ZWS | Zurn Elkay Water Solutions Corp. | Machinery and Tools | $47.28 | hi 40s - lo 50s | 95 | 42 | 5 TA rating, LT pos trend, LT mkt RS buy, consec buy signals, buy-on-pullback |
| CACI | CACI International Inc. | Computers | $591.71 | 570s - 600s | 672 | 528 | 5 for 5'er, top 25% of COMP sector matrix, LT pos mkt RS, triple top breakout |
| WBS | Webster Financial Corporation | Banks | $69.08 | hi 60s - low 70s | 91 | 58 | 4 for 5'er, top 25% of BANK sector matrix, one box from peer RS buy, buy on pullback, 2.2% yield |
| MCK | McKesson Corporation | Drugs | $928.69 | 396-hi 470s | 1304 | 752 | 5 TA rating, top 33% of DRUG sector matrix, LT RS buy, consec buy signals, buy-on-pullback |
| CGON | CG Oncology, Inc. | Biomedics/Genetics | $62.79 | hi 50s - low 60s | 80 | 50 | 5 for 5'er, 18 of 162 in BIOM sector matrix, bullish catapult, good R-R, Earn. 3/26 |
| AZN | Astrazeneca Group PLC Ads (United Kingdom) ADR | Drugs | $194.99 | mid 180s - upper 190s | 236 | 160 | 4 for 5'er, top 25% of DRUG sector matrix, LT pos peer RS, one box from mkt RS buy, bullish triangle |
| RTX | RTX Corp. | Aerospace Airline | $207.00 | upper 190s to mid 210s | 254 | 166 | 4/5'er; top third of Aero matrix; Peer RS within 1 box of RS buy; ATHs on 3/2. |
| COCO | Vita Coco Company, Inc. | Food Beverages/Soap | $54.91 | mid-to-hi 50s | 72 | 48 | 5 for 5'er, top half of FOOD sector matrix, LT pos peer & mkt RS, pos trend flip |
| Symbol | Company | Sector | Current Price | Action Price | Target | Stop | Notes |
|---|---|---|---|---|---|---|---|
| CPRT | Copart Incorporated | Autos and Parts | $36.31 | hi 30s | 28 | 42 | 1 TA rating, bottom 50% of AUTO sector matrix, NT and mkt RS sell last month, consec sell signals |
| Comment | |||||||
|---|---|---|---|---|---|---|---|
|
|
|||||||
COCO Vita Coco Company, Inc. R ($57.35) - Food Beverages/Soap - COCO is a 5 for 5'er that ranks in the top half of the food beverages/soap sector matrix and has been on peer and market RS buy signals since 2023 and 2024, respectively. After giving two consecutive sell signals COCO returned to a buy signal and positive trend in Tuesday's trading when it broke a double top at $56. Long exposure may be added in the mid-to-upper $50s and we will set our initial stop at $48, which would take out two levels of support on COCO's chart and violate its trend line. We will use the bullish price objective, $72, as our target price.
| 26 | |||||||||||||||||||||||||||||
| 59.00 | X | X | • | • | 59.00 | ||||||||||||||||||||||||
| 58.00 | X | X | O | X | O | X | • | 58.00 | |||||||||||||||||||||
| 57.00 | X | O | X | O | X | O | X | O | • | 57.00 | |||||||||||||||||||
| 56.00 | X | 2 | O | X | O | X | O | X | O | • | X | 56.00 | |||||||||||||||||
| 55.00 | C | 1 | O | X | O | O | O | X | 3 | X | X | Mid | 55.00 | ||||||||||||||||
| 54.00 | X | O | X | O | X | O | X | O | X | O | X | 54.00 | |||||||||||||||||
| 53.00 | X | O | X | O | X | O | X | O | X | O | X | 53.00 | |||||||||||||||||
| 52.00 | X | O | X | O | O | X | O | O | X | 52.00 | |||||||||||||||||||
| 51.00 | X | O | O | X | • | O | X | 51.00 | |||||||||||||||||||||
| 50.00 | X | X | O | X | • | O | • | 50.00 | |||||||||||||||||||||
| 49.00 | X | O | X | O | • | • | 49.00 | ||||||||||||||||||||||
| 48.00 | X | X | O | X | • | 48.00 | |||||||||||||||||||||||
| 47.00 | X | O | X | O | X | • | 47.00 | ||||||||||||||||||||||
| 46.00 | X | O | X | O | X | • | 46.00 | ||||||||||||||||||||||
| 45.00 | X | O | X | O | • | 45.00 | |||||||||||||||||||||||
| 44.00 | X | O | X | • | 44.00 | ||||||||||||||||||||||||
| 43.00 | X | X | O | X | • | 43.00 | |||||||||||||||||||||||
| 42.00 | X | X | O | X | O | X | • | 42.00 | |||||||||||||||||||||
| 41.00 | X | O | X | O | X | B | X | • | Bot | 41.00 | |||||||||||||||||||
| 40.00 | X | O | X | A | X | O | • | 40.00 | |||||||||||||||||||||
| 39.00 | X | O | X | O | • | 39.00 | |||||||||||||||||||||||
| 38.00 | O | X | O | • | 38.00 | ||||||||||||||||||||||||
| 37.00 | O | X | 9 | • | 37.00 | ||||||||||||||||||||||||
| 36.00 | O | X | O | X | • | 36.00 | |||||||||||||||||||||||
| 35.00 | 8 | X | O | X | • | 35.00 | |||||||||||||||||||||||
| 34.00 | O | X | O | • | 34.00 | ||||||||||||||||||||||||
| 33.00 | O | X | • | 33.00 | |||||||||||||||||||||||||
| 32.00 | O | • | 32.00 | ||||||||||||||||||||||||||
| 26 |
| ADM Archer-Daniels-Midland Company ($70.55) - Food Beverages/Soap - Shares of ADM broke a triple top at $71 for its third consecutive buy signal. ADM has continued to improve over the last several months, moving up to a 3 for 5'er in August after regaining near-term relative strength and moving to a positive trend. That said, it continues to lack long-term relative strength, keeping it in hold territory for the time being. From here, initial resistance lies at $74 then $77. |
| CASY Casey's General Stores Inc ($682.83) - Retailing - CASY broke a double top at $696 for a third buy signal as shares marked a new all-time chart high. The stock has been a 5 for 5'er since November 2025 and currently ranks within the top quintile of the Retailing sector matrix. Okay to consider here on the breakout or on a pullback to the $650 to $680 range. Initial support lies at $632, while additional can be found at $536 and $504, the bullish support line. |
| CEG Constellation Energy Corporation ($299.98) - Utilities/Electricity - CEG broke a quadruple bottom at $308 to return to a sell signal as shares fell to $300. This breakdown follows the stock rally to test and failing to penetrate the bearish resistance line in the $320 range. While the stock maintains a 3 TA rating, much of that is due to the abrupt rally off the February lows and comes from near-term peer and market relative strength. Additional downside could negate those recent reversal on the RS charts and drop the stock to potentially as low as a 1 for 5'er. From here, support lies at $292, while the February 2026 chart low sits at $244. |
| NRG NRG Energy, Inc. ($148.13) - Utilities/Electricity - NRG broke a double bottom at $148 for a third sell signal since peaking at $188 in February. This action follows the stock moving into a negative trend early this week, which dropped NRG down to a 2 for 5'er trading in a negative trend. Support now lies at $142, the 2026 chart lows and support level that dates all the way back to Septmeber of last year. |
| ORCL Oracle Corporation ($162.07) - Software - Shares of ORCL broke a double top at $160 on Wednesday after releasing stronger than anticipated earnings. Despite its movement today, the stock continues to be a weak 1 for 5'er, remaining a name too avoid for the time being until it sees technical improvement. From here, resistance lies at $170 and $184 with the bearish resistance line at $190. |
| PM Philip Morris International Inc. ($166.98) - Food Beverages/Soap - Shares of PM broke a double bottom at $166 for its second consecutive sell signal. That said, PM is still trading above its bullish support line, remaining a solid 4 for 5'er while trading in a positive trend. However, further deterioration, such as movement below its bullish support line at $162, would be signs of weakness to watch for going forward. |
| SYK Stryker Corporation ($347.86) - Healthcare - SYK inched lower to complete a double bottom break at $352. The 2 for 5'er moved down from a 3 with its latest move after reversing back into a negative trend. Additionally, the stock ranks in the bottom half of the healthcare sector matrix. A sell can be considered here. Initial resistance can be seen at $388. |
| Name | Option Symbol | Action | Stop Loss |
|---|---|---|---|
| The TJX Companies, Inc. - $157.99 | O: 26G160.00D17 | Buy the July 160.00 calls at 9.25 | 144.00 |
| Name | Option | Action |
|---|---|---|
| Archer-Daniels-Midland Company ( ADM) | Jun. 67.50 Calls | Initiate an option stop loss of 4.70 (CP: 6.70) |
| Name | Option Symbol | Action | Stop Loss |
|---|---|---|---|
| Zoetis Inc. - $119.73 | O: 26S120.00D17 | Buy the July 120.00 puts at 8.80 | 134.00 |
| Name | Option | Action |
|---|---|---|
| General Mills, Inc. ( GIS) | Apr. 45.00 Puts | Initiate an option stop loss of 2.80 (CP: 4.80) |
| Tractor Supply Company ( TSCO) | Apr. 55.00 Puts | Initiate an option stop loss of 3.30 (CP: 5.30) |
| General Mills, Inc. ( GIS) | Jun. 47.50 Puts | Raise the option stop loss to 5.00 (CP: 7.00) |
| MetLife, Inc. ( MET) | Apr. 77.50 Puts | Raise the option stop loss to 5.70 (CP: 7.70) |
| CBRE Group, Inc. ( CBRE) | Apr. 145.00 Puts | Raise the option stop loss to 11.20 (CP: 13.20) |
| Best Buy Co., Inc. ( BBY) | May. 67.50 Puts | Initiate an option stop loss of 4.80 (CP: 6.80) |
| Name | Option Sym. | Call to Sell | Call Price | Investment for 500 Shares | Annual Called Rtn. | Annual Static Rtn. | Downside Protection |
|---|---|---|---|---|---|---|---|
| CAVA Group, Inc. $ 80.02 | O: 26D80.00D17 | Apr. 80.00 | 5.70 | $ 37,538.10 | 54.20% | 63.65% | 6.06% |
| Name | Action |
|---|---|
| Intel Corporation ( INTC) - 46.78 | Sell the May 49.00 Calls. |
| Freeport-McMoRan Inc. ( FCX) - 62.40 | Sell the June 65.00 Calls. |
| Micron Technology, Inc. ( MU) - 403.11 | Sell the June 420.00 Calls. |
| Moderna, Inc. ( MRNA) - 54.98 | Sell the April 55.00 Calls. |
| Cameco Corporation ( CCJ) - 120.08 | Sell the April 120.00 Calls. |
| Invesco PLC ( IVZ) - 23.97 | Sell the April 24.00 Calls. |
| Fortinet Inc. ( FTNT) - 84.20 | Sell the May 85.00 Calls. |
| Name | Covered Write |
|---|---|
|
|
|
Daily Equity & Market Analysis
LISTEN TO PODCAST
Apr 09, 2026
Loading, Please Wait...
