
Today we explore the model builder in greater detail and talk about the effects of including different overlays onto a more "basic" model
Lots of recent research has hit on changes around the platform and what that could ultimately mean for the state of trendfollowing within your portfolio. Growth names have rolled over slightly and the uptick in energy focused commodities have led to several shifts within the broader DALI and Asset Class Group Scores rankings. As strength shifts, we thought it would be useful to look underneath the hood of our model builder tool… to detail how you can utilize the platform to create bespoke custom models to take advantage of shifts of strength. More specifically, we will use the model builder to discuss the different levers you can pull… from Technical Attribute Score overlays, sector maximums, etc. and the overall effect on performance, risk, and model compatibility.
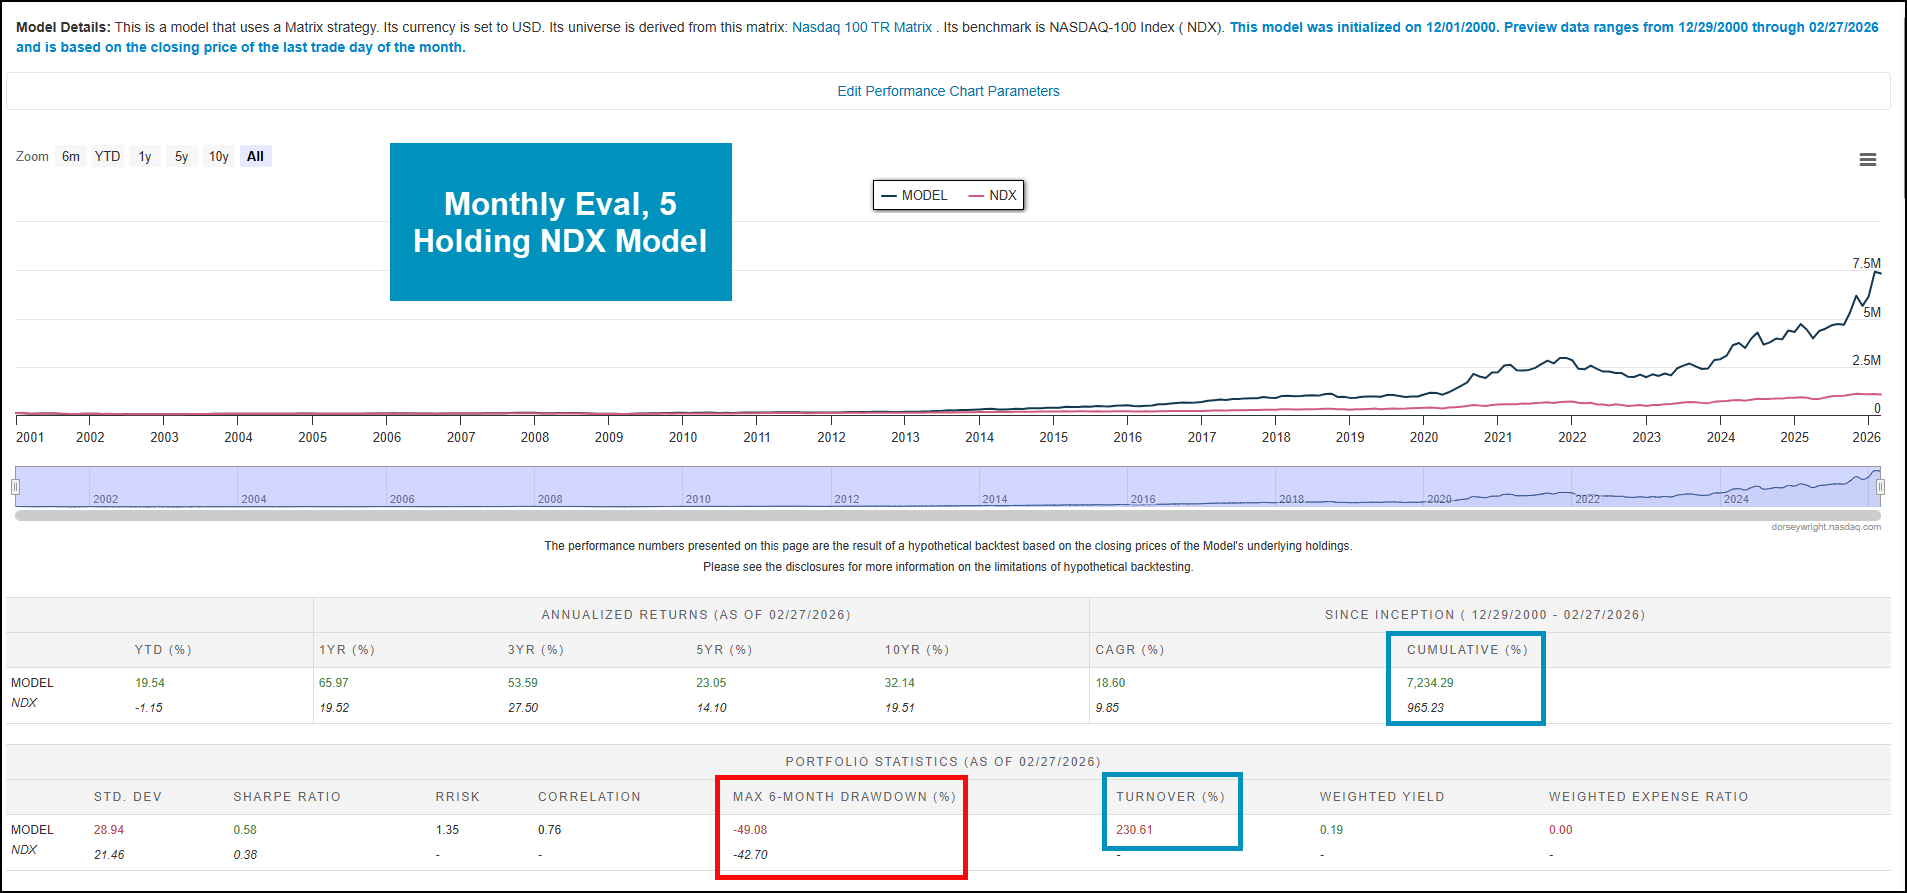
To lay the groundwork, we will utilize a matrix based model focusing on the NDX as our starting universe. From there, we will look to own the top five stocks within the overall rankings based on their buy count, evaluated on a monthly basis. The model will sell once the holding falls out of the top third of the rankings. This setup is similar to the pre-made NDW NDX Model (NDXMODEL.TR) except that model focuses on ten holdings and cuts our losers a bit shorter than the premade. Enter the first benefit of the custom modeler- the ability for you to put your own spin on an existing NDW strategy, without compromising the integrity of the overall process. This model on its own is quite impressive- growing at a CAGR of ~18.50% since 2001 vs. the ~9.65% for benchmark NDX. For the uninitiated- this screen certainly has a lot going on. A few important places the analysts look at when we create models are the returns (obviously) across different timeframes & the max 6-month drawdown and turnover numbers. We want our drawdown to be low (in this case this model’s drawdown is slightly worse than our benchmark) & turnover metrics to be “reasonable”. That definition is different for every client… but most of our premade models hover around 100%-200% per year. In this case, our model is above that threshold- turning over about 2.3 times per year. This works for some clients, not for others. Another important thing to keep in mind is the type of account you place these models in- a qualified account can withstand more trading than something that your clients will be paying taxes on in the near-term.
This is the most “basic” model possible: we gave the system a target number of holdings, buy and sell criteria, and an evaluation frequency. There are, however, several different levers you can pull to “enhance” the model in one form or another. The first adjustment we can make is applying an overlay filter that instructs our model to buy those stocks at the top of the matrix…. But only if they are rated a 4 or 5 technical attribute score. In doing so, we can add another layer to our security selection process. Adding this in adds an extra ~700% to our cumulative returns (+~.4% p/year) since December of 2000. Perhaps most useful about this addition is that it decreases our max 6-month drawdown by roughly 10% to -40.13%, a metric lower than that of our benchmark. When you think about it, this makes sense… by ensuring that there are only 4 or 5 rated stocks in our portfolio, we avoid the 3’s… which become 2’s, 1’s, or 0’s. Our turnover increases slightly, but not enough that the decreased drawdown isn’t “worth it”.
While today’s piece focused on a possible strategy in the model builder, know that this process is applicable to those of you not using the builder as well. By isolating those stocks at the top of the matrix while ensuring names that also score well according to the TA system, we can add more weight of the evidence to our picks. While we cant ensure that this strategy will be additive in all scenarios, those of you looking to test different strategies may find it useful to play around with different overlays. We didn’t discuss cash triggers which allow your strategies to raise varying levels of cash for more defensive clients, or sector maximums to ensure that you don’t get too overallocated to any one specific area of the market. It is also worth noting that a frequent use case for many is to blend together different models (a combination of 5 holding models for various universes like NDX, SPX, .DJIA, or another custom sleeve) to create a more robust 15-20 holding model that satisfies compliance requirements.

All this to say, there are a virtually endless number of possibilities available to you to play around with in the builder. If you would like to discuss building out a model similar to this, feel free to email at miles.clark@nasdaq.com for more information or a trial of the model builder.
