Most Requested Symbols

Differing data sources allow us to get a more wholistic view of inflation trends.
The spread between top performing energy & worst performing financials sits at just over 30%- its widest in quite a few years. We explore what this could mean going forwards and RS changes you need to be aware of.
The curve has an average reading of 38.11%.
Weekly Rundown Video – Feb 25, 2026
Weekly rundown with NDW analyst team covering all major asset classes.
Weekly rundown with NDW analyst team covering all major asset classes.
The primary data source policymakers and institutions look at for inflation comes through the Bureau of Labor Statistics, along with plenty of other economic data. This has been the case for decades, however, over the last few years as data has become more readily available, other data collectors have compiled their own metrics. Truflation is one of largest providers of this new wave of ex-government data. One of the benefits of some of these new approaches like Truflation is that it can gather data from different sources that tend to have less lag than government data. Their overall inflation metric signaled a rapid rise in inflation much earlier than the government data and also turned lower before the government data did. While arguments can be made whether either the BLS or Truflation data is more relevant, the data generally shows that Truflation acts as a leading indicator of where the BLS data is headed. Truflation’s data sources are more focused on recent data and lessening the impacts of lag that BLS data has become known for over the last few years. Looking at year-over-year percent changes, Truflation’s US CPI Inflation Index has had a reading below 1% since the end of January whereas BLS’s CPI reading has yet to fall below 2%. If Truflation is a leading indicator, it’s showing that headline CPI data from the BLS is likely to continue to trend lower.

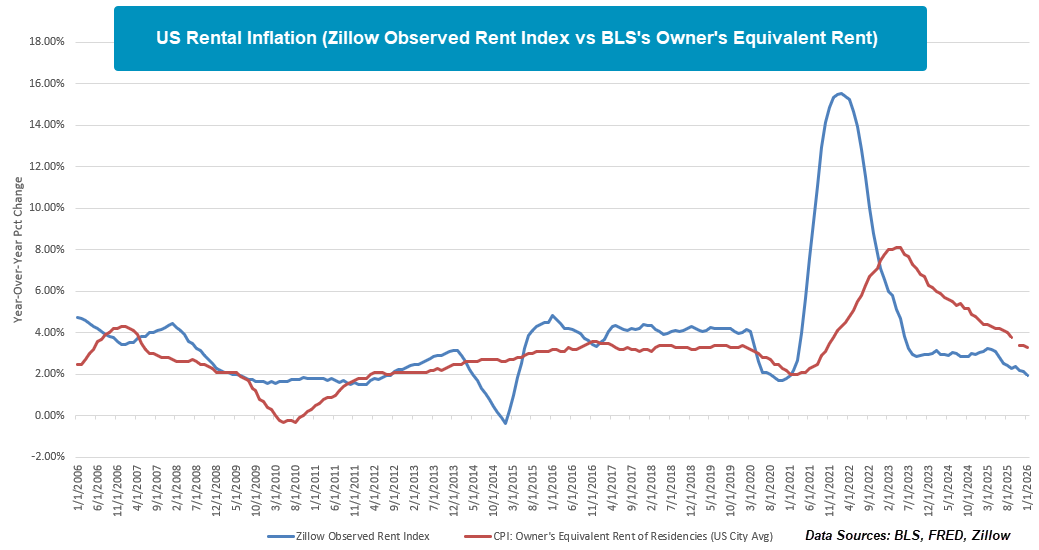
One specific area where the BLS’s data tends to lag the most is with respect housing costs. A key way Truflation looks to solve this problem is with data from places like Zillow to get more real-time housing data. For example, the Zillow Observed Rent Index (ZORI) measures changes in asking rents over time, controlling for changes in the quality of the available rental stock. By looking at listing prices, this greatly reduces the lag in how the BLS looks at rental costs via Owner’s Equivalent Rent which collects rent data from each sampled unit every six months. The results of the different methodologies become apparent when looking at their respective year-over-year percent changes over time. Zillow’s index picked up on the increases in rents in early 2021 whereas BLS’s Owner’s Equivalent Rent didn’t start to show warning signs of rising rents until very late in the year. ZORI peaked in early 2022 and showed cooling inflation moving forward while BLS metric didn’t peak until mid-2023. ZORI has continued to lead Owner’s Equivalent Rent over the last several years and is in the lower part of its historical range. BLS’s data still has some catching up to do but does seem to be heading back to historical norms. This setup is would be positive for fixed income and it does seem the market has noticed over the last few weeks with the Ten Year Yield Index (TNX) falling down to its lowest level this year.

If you ask the analyst team their favorite “visual” on the NDW platform, you will get a few different answers. For many, the visual simplicity of the DALI page offers high level commentary about the state of markets around the world. For others, a clean shakeout pattern for a 5/5’er is a picture fit for the Louvre. Not talked about frequently enough is the quilt function, which allows you to stack a custom list of names (or one of NDW’s premade options…) into a list and see performance metrics across the years in one place. For the sake of today’s feature we will analyze the dispersion in performance between the various sectors, which has certainly given us plenty to talk about so far in 2026. In fact, the quilt below details 2026’s sector performance- standing nearly at direct odds with overall trends we saw in 2023-2025. Towards the top of the heap sit energy, basic materials, & staples, groups which typically produce around weaker market environments. On the bottom, the likes of financials, technology, & discretionary paint a bleak story for those rooting for economic growth. In fact, the start to 2026 looks particularly similar to the full 2022 calendar year, a year hindsight tells us was a particularly bleak market on the domestic front.

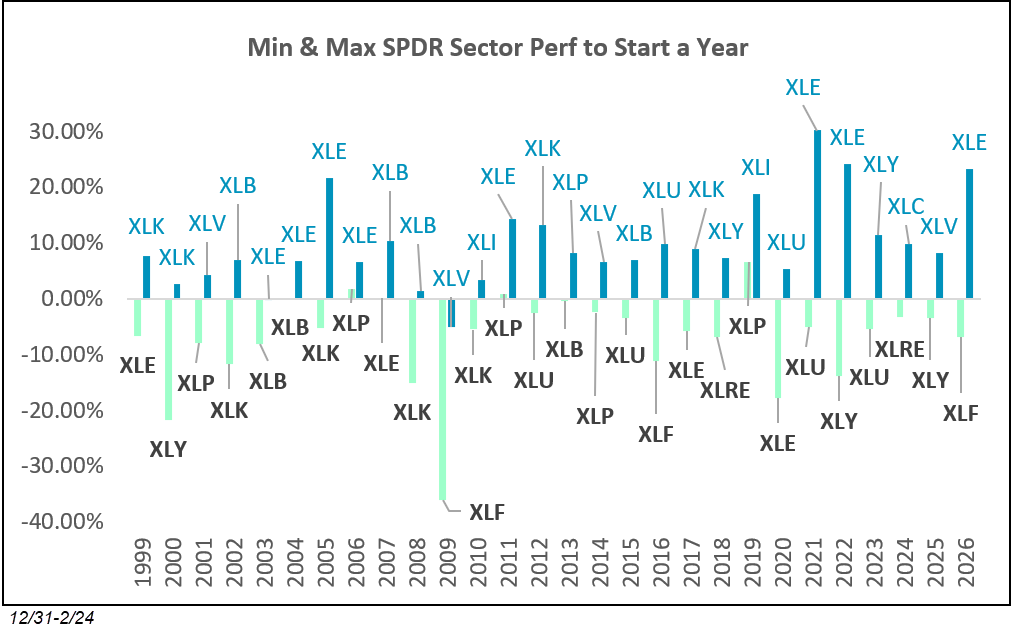
While the quilt is certainly useful, there is a lot going on. For this reason, we can isolate the best and worst performing funds each year in an effort to measure the dispersion between winners and losers. This dispersion is particularly important because as trendfollowers, a wider range of outcomes typically allows us to pinpoint specific points of strength and underweight those weak areas. The chart below does just that, measuring a ~30% dispersion between best performing Energy (XLE, +23.24%) and Financials (XLF, -6.92%) through 2/24/2026. This spread between our best and worst fund is the widest to start a year since 2022 and the third largest in our observed history going back to 1999. Interestingly enough, the other two higher dispersion years (2021 & 2022) both saw energy lead the way in a similar fashion to 2026. The dataset is admittedly quite small, but there doesn’t seem to be a discernible performance trend following such wide leadership for energy… markets rebounded quite nicely (while energy lagged) in 2021 while such leadership persisted in 2022 while broader markets suffered.
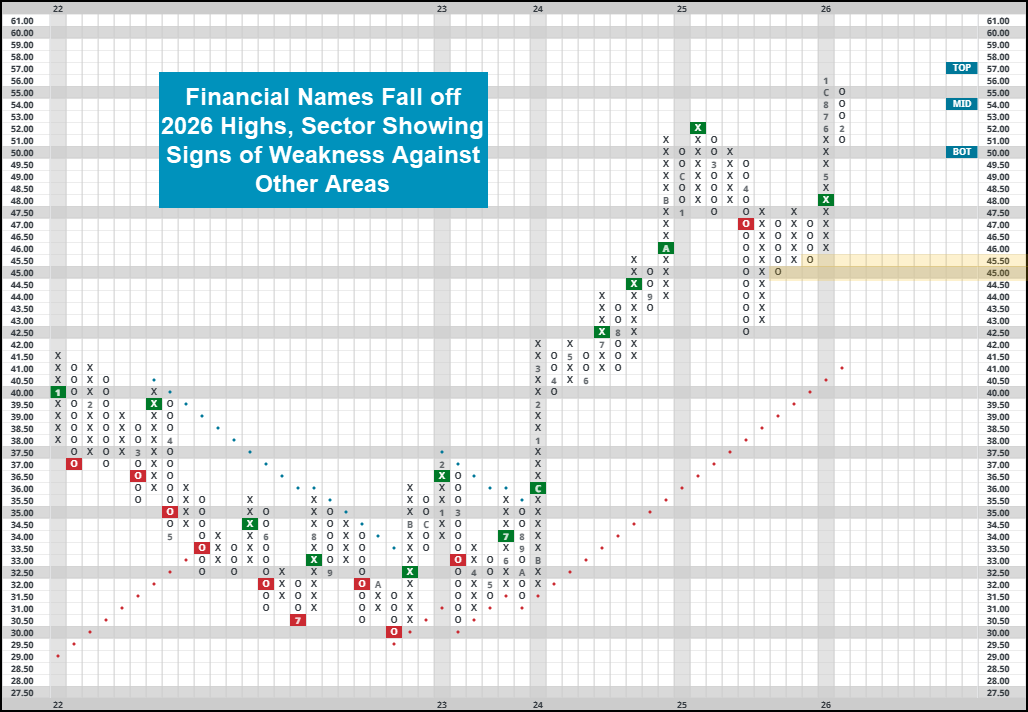
Lots of recent research has touched on the strength of energy. We are just now seeing the sector enter into a handful of NDW models, but many representatives are in what we would consider heavily overbought territory around current levels. Much less research has discussed the decline of financial names, with much of the sector sitting well off their respective highs. Even some of the major blue blood bank stocks like JPM, BAC or WFC has struggled materially so far this year. Most of the larger names retain their strong technical attribute ratings… but many have posted consecutive sell signals and established some significant resistance overhead. While there certainly is an argument that exposure towards the group is still warranted, do exercise significant caution with current holdings. Consider setting alerts for notable breaks of support or further loss of technical favor as a sign of persistent weakness. XLF is now flirting with “unfavorable” territory according to its fund score, and while it still maintains a buy signal on its chart sits without technical support until the mid-$40’s. We are currently trading in heavily oversold territory and around a range of old resistance around current levels, so a near-term bounce could be in store. Regardless, keep a close eye on the sector as the recent decline is certainly quite notable.
Each week the analysts at NDW review and comment on all major asset classes in the global markets. Shown below is the summary or snapshot of the primary technical indicators we follow for multiple areas. Should there be changes mid-week we will certainly bring these to your attention via the report.
| Universe | BP Col & Level (actual) | BP Rev Level | PT Col & Level (actual) | PT Rev Level | HiLo Col & Level (actual) | HiLo Rev Level | 10 Week Col & Level (actual) | 10 Week Rev Level | 30 Week Col & Level (actual) | 30 Week Rev Level |
|---|---|---|---|---|---|---|---|---|---|---|
| ALL |
|
42% |
|
38% |
|
66% |
|
54% |
|
48% |
| NYSE |
|
56% |
|
54% |
|
74% |
|
66% |
|
62% |
| OTC |
|
36% |
|
34% |
|
56% |
|
50% |
|
50% |
| World |
|
46% |
|
44% |
|
|
|
60% |
|
54% |

Remember, these are technical comments only. Just as you must be aware of fundamental data for the stocks we recommend based on technical criteria in the report, so too must you be aware of important data regarding delivery, market moving government releases, and other factors that may influence commodity pricing. We try to limit our technical comments to the most actively traded contracts in advance of delivery, but some contracts trade actively right up to delivery while others taper off well in advance. Be sure you check your dates before trading these contracts. For questions regarding this section or additional coverage of commodities email james.west@nasdaq.com.
Data represented in the table below is through 2/24/26:
| Symbol | Name | Price | PnF Trend | RS Signal | RS Col. | 200 Day MA | Weekly Mom |
|---|---|---|---|---|---|---|---|
| CL/ | Crude Oil Continuous | 65.63 | Positive | Sell | O | 62.49 | + 9W |
| DBLCIX | Deutsche Bank Liquid Commodities Index | 468.52 | Positive | Sell | O | 460.74 | - 33W |
| DWACOMMOD | NDW Continuous Commodity Index | 1087.15 | Positive | Buy | O | 1022.17 | - 3W |
| GC/ | Gold Continuous | 5157.80 | Positive | Buy | X | 3904.55 | - 1W |
| HG/ | Copper Continuous | 5.93 | Positive | Buy | X | 5.11 | - 5W |
| ZG/ | Corn (Electronic Day Session) Continuous | 427.75 | Positive | Sell | O | 423.48 | - 9W |
Average Level
38.11
| < - -100 | -100 - -80 | -80 - -60 | -60 - -40 | -40 - -20 | -20 - 0 | 0 - 20 | 20 - 40 | 40 - 60 | 60 - 80 | 80 - 100 | 100 - > |
|---|---|---|---|---|---|---|---|---|---|---|---|
|
Buy signalrsp
|
|||||||||||
|
Buy signalIJH
|
Buy signalGLD
|
||||||||||
|
Buy signalhyg
|
Sell signallqd
|
Buy signaluso
|
|||||||||
|
Buy signalXLG
|
Buy signalQQQ
|
Buy signalSPY
|
Buy signalshy
|
Sell signalief
|
|||||||
|
Sell signalVOOG
|
Sell signaldx/y
|
Buy signaldia
|
Buy signalgcc
|
Buy signalVOOV
|
Buy signalagg
|
Buy signaldvy
|
Buy signalefa
|
||||
|
Sell signalONEQ
|
Buy signalfxe
|
Buy signaliwm
|
Buy signalijr
|
Buy signaltlt
|
Buy signalgsg
|
Buy signalicf
|
Buy signalEEM
|
||||
| < - -100 | -100 - -80 | -80 - -60 | -60 - -40 | -40 - -20 | -20 - 0 | 0 - 20 | 20 - 40 | 40 - 60 | 60 - 80 | 80 - 100 | 100 - > |
| AGG | iShares US Core Bond ETF |
| USO | United States Oil Fund |
| DIA | SPDR Dow Jones Industrial Average ETF |
| DVY | iShares Dow Jones Select Dividend Index ETF |
| DX/Y | NYCE U.S.Dollar Index Spot |
| EFA | iShares MSCI EAFE ETF |
| FXE | Invesco CurrencyShares Euro Trust |
| GLD | SPDR Gold Trust |
| GSG | iShares S&P GSCI Commodity-Indexed Trust |
| HYG | iShares iBoxx $ High Yield Corporate Bond ETF |
| ICF | iShares Cohen & Steers Realty ETF |
| IEF | iShares Barclays 7-10 Yr. Tres. Bond ETF |
| LQD | iShares iBoxx $ Investment Grade Corp. Bond ETF |
| IJH | iShares S&P 400 MidCap Index Fund |
| ONEQ | Fidelity Nasdaq Composite Index Track |
| QQQ | Invesco QQQ Trust |
| RSP | Invesco S&P 500 Equal Weight ETF |
| IWM | iShares Russell 2000 Index ETF |
| SHY | iShares Barclays 1-3 Year Tres. Bond ETF |
| IJR | iShares S&P 600 SmallCap Index Fund |
| SPY | SPDR S&P 500 Index ETF Trust |
| TLT | iShares Barclays 20+ Year Treasury Bond ETF |
| GCC | WisdomTree Continuous Commodity Index Fund |
| VOOG | Vanguard S&P 500 Growth ETF |
| VOOV | Vanguard S&P 500 Value ETF |
| EEM | iShares MSCI Emerging Markets ETF |
| XLG | Invesco S&P 500 Top 50 ETF |

| Symbol | Company | Sector | Current Price | Action Price | Target | Stop | Notes |
|---|---|---|---|---|---|---|---|
| GS | Goldman Sachs Group, Inc. | Wall Street | $902.27 | mid-800s - mid-900s | 1416 | 736 | 5 TA rating, top 10% of WALL sector matrix, LT RS buy, LT pos trend, buy-on-pullback |
| PHM | PulteGroup, Inc. | Building | $140.90 | hi 120s - mid 130s | 168 | 110 | 4 for 5'er, top half of BUIL sector matrix, LT pos peer & mkt RS, bullish catapult |
| CBOE | CBOE Global Markets Inc. | Wall Street | $292.94 | lo 260s - mid 280s | 332 | 228 | 5 TA rating, top 25% of WALL sector matrix, LT RS buy, LT pos trend, buy-on-pullback |
| JBL | Jabil Circuit, Inc. | Electronics | $266.26 | mid 240s- lo 270s | 352 | 204 | 4 TA rating, top 50% of ELEC sector matrix, LT RS buy, buy-on-pullback, Earn. 3/19 |
| ABBV | AbbVie Inc. | Drugs | $228.44 | 210s - low 230s | 284 | 188 | 5 for 5'er, favored DRUG sector, LT pos peer & mkt RS, breakout from consec sell signals, 2.9% yield |
| AB | AllianceBernstein Holding LP | Wall Street | $38.51 | low 40s | 64 | 32 | 4 TA rating, LT mkt RS buy, LT pos trend, top 50% of WALL sector matrix, consec buy signals, buy-on-pullback, yield > 8% |
| SN | SharkNinja, Inc. | Household Goods | $128.11 | 120s - low 130s | 183 | 108 | 4 for 5'er, 3rd of 28 in HOUS sector matrix, multiple buy signals, buy on pullback, R-R>2.0 |
| BYD | Boyd Gaming Corp | Gaming | $85.20 | 82 - 88 | 98 | 72 | 4 for 5'er, top 20% of GAME sector matrix, LT pos peer RS, triple top, pos trend flip, buy on pullback |
| PKG | Packaging Corp of America | Forest Prods/Paper | $228.89 | hi 200s - mid 230s | 358 | 184 | 4 TA rating, top 20% of FORE sector RS matrix, LT RS buy, buy-on-pullback |
| CPA | Copa Holdings SA | Aerospace Airline | $145.39 | 140s | 166 | 124 | 4 for 5'er, top half of favored AERO sector matrix, LT pos mkt RS, bullish catapult, 4.8% yield |
| Symbol | Company | Sector | Current Price | Action Price | Target | Stop | Notes |
|---|
| Comment | |||||||
|---|---|---|---|---|---|---|---|
|
|
|||||||
CPA Copa Holdings SA R ($147.34) - Aerospace Airline - CPA is a 4 for 5'er that ranks in the top half of the favored aerospace/airline sector matrix and has been on a market RS buy signal since 2023. On its default chart, CPA has given three consecutive buy signals, most recently completing a bullish catapult earlier this month. Long exposure may be added in the $140s and we will set our initial stop at $124, which would take out three levels of support on CPA's chart. We will use the bullish price objective, $166, as our near-term target price. CPA also carries a 4.8% yield.
| 26 | |||||||||||||||||||||||||||||
| 156.00 | X | 156.00 | |||||||||||||||||||||||||||
| 154.00 | X | O | Top | 154.00 | |||||||||||||||||||||||||
| 152.00 | X | O | 152.00 | ||||||||||||||||||||||||||
| 150.00 | X | O | 150.00 | ||||||||||||||||||||||||||
| 148.00 | X | O | 148.00 | ||||||||||||||||||||||||||
| 146.00 | X | O | 146.00 | ||||||||||||||||||||||||||
| 144.00 | X | O | 144.00 | ||||||||||||||||||||||||||
| 142.00 | X | O | 142.00 | ||||||||||||||||||||||||||
| 140.00 | X | O | 140.00 | ||||||||||||||||||||||||||
| 138.00 | X | 2 | 138.00 | ||||||||||||||||||||||||||
| 136.00 | X | O | X | 136.00 | |||||||||||||||||||||||||
| 134.00 | X | O | X | 134.00 | |||||||||||||||||||||||||
| 132.00 | X | X | X | O | Mid | 132.00 | |||||||||||||||||||||||
| 130.00 | X | X | O | X | O | X | 130.00 | ||||||||||||||||||||||
| 128.00 | X | O | X | O | X | O | X | 128.00 | |||||||||||||||||||||
| 126.00 | X | O | 1 | O | O | 126.00 | |||||||||||||||||||||||
| 124.00 | X | O | X | 124.00 | |||||||||||||||||||||||||
| 122.00 | X | A | B | X | X | 122.00 | |||||||||||||||||||||||
| 120.00 | X | X | X | O | X | O | X | O | X | 120.00 | |||||||||||||||||||
| 118.00 | X | O | X | O | X | O | X | O | X | O | X | • | 118.00 | ||||||||||||||||
| 116.00 | X | O | X | O | X | O | O | X | C | • | 116.00 | ||||||||||||||||||
| 114.00 | X | 8 | O | 9 | O | X | • | 114.00 | |||||||||||||||||||||
| 112.00 | X | O | X | O | • | 112.00 | |||||||||||||||||||||||
| 110.00 | X | 7 | O | X | • | Bot | 110.00 | ||||||||||||||||||||||
| 108.00 | X | O | X | O | • | 108.00 | |||||||||||||||||||||||
| 106.00 | X | O | X | • | 106.00 | ||||||||||||||||||||||||
| 104.00 | X | 6 | X | • | 104.00 | ||||||||||||||||||||||||
| 102.00 | X | X | O | X | • | 102.00 | |||||||||||||||||||||||
| 100.00 | X | O | X | O | • | 100.00 | |||||||||||||||||||||||
| 99.00 | X | O | X | • | 99.00 | ||||||||||||||||||||||||
| 98.00 | X | O | • | 98.00 | |||||||||||||||||||||||||
| 97.00 | X | • | 97.00 | ||||||||||||||||||||||||||
| 96.00 | X | • | 96.00 | ||||||||||||||||||||||||||
| 95.00 | • | X | • | 95.00 | |||||||||||||||||||||||||
| 94.00 | • | X | • | 94.00 | |||||||||||||||||||||||||
| 93.00 | 5 | • | 93.00 | ||||||||||||||||||||||||||
| 92.00 | X | • | 92.00 | ||||||||||||||||||||||||||
| 91.00 | X | • | 91.00 | ||||||||||||||||||||||||||
| 90.00 | X | X | • | 90.00 | |||||||||||||||||||||||||
| 89.00 | X | O | X | • | 89.00 | ||||||||||||||||||||||||
| 88.00 | X | O | X | • | 88.00 | ||||||||||||||||||||||||
| 87.00 | X | O | • | 87.00 | |||||||||||||||||||||||||
| 86.00 | X | • | 86.00 | ||||||||||||||||||||||||||
| 85.00 | X | • | 85.00 | ||||||||||||||||||||||||||
| 26 |
| CAVA CAVA Group, Inc. ($84.69) - Restaurants - CAVA reversed into Xs and broke a double top at $71 to complete a bullish triangle as shares rallied to $85, marking the highest chart level since August last year. The stock is a 3 for 5'er that ranks within the top third of the Restaurants sector matrix. From here, those seeking exposure are best to look for price consolidation along with a normalization of the 10-week trading band before considering. Prior resistance at $72 may be seen as near-term support, while additional can be found at $67. |
| CE Celanese Corporation ($49.15) - Chemicals - After giving four consecutive buy signals CE fell to a sell signal Wednesday when it broke a double bottom at $52; the move adds to an already weak technical picture as CE is a 2 for 5'er. From here, the next level of support sits at $44. |
| EMN Eastman Chemical Company ($75.62) - Chemicals - After giving six consecutive sell signals EMN fell to a sell signal Wednesday when it broke a double bottom at $75. Wednesday's move adds evidence to a weak outlook as EMN is a 2 for 5'er. From here, the next level of support sits at $69. |
| GE GE Aerospace ($343.88) - Aerospace Airline - Quick follow-up to our most recent comment- GE moved higher today, printing new all-time highs today in the process. The technical picture remains quite strong and the notable change that comes with today's action is the establishment of new support around a range of old resistance in the $320's. Those who were waiting to see if $344 was trouble can feel a bit more comfortable moving in here. |
| IDXX IDEXX Laboratories, Inc. ($660.62) - Healthcare - IDDX inched higher and completed a double top break at $656. The 4 for 5'er moved down from a 5 earlier this month, after reversing back into Os against the market, and sits over 10% below its highs from late 2025. However, IDDX is still rated a buy and ranks int the top half of the healthcare sector matrix. Consider adding exposure here, or wait for the stock to move closer to its previous all-time highs. Strong support can be seen at $608. Strong resistance can be seen at $720. |
| MP MP Materials Corp. ($59.06) - Metals Non Ferrous - After giving five consecutive sell signals, MP returned to a buy signal Wednesday when it completed a bearish signal reversal at $59. The outlook for the stock remains unfavorable, however, as MP is a 0 for 5'er that ranks 19th of 21 names in the metals non ferrous sector matrix. From here, the first level of support sits at $54. |
| MTRN Materion Corp. ($161.67) - Chemicals - MTRN returned to a buy signal Wednesday when it broke a double top at $160. Wednesday's move adds to an already positive technical picture as MTRN is a 4 for 5'er that ranks in the top third of the chemicals sector matrix. From here, initial support lies at $144, while overhead resistance can be found at $172, MTRN's all-time high. |
| NVDA NVIDIA Corporation ($196.92) - Semiconductors - NVDA pushed higher ahead of its earnings release to break a double top at $194 before reaching $196 intraday. This moves the stock back to a positive trend and promotes it to a 3 for 5 TA rating. The weight of the technical evidence is still mixed, as the stock is in a defined range between the upper $190s and the lower $170s. |
| ORLY O'Reilly Automotive, Inc. ($91.31) - Autos and Parts - ORLY broke a triple bottom at $91 for a second sell signal since the beginning of February. The stock continues to maintain a 3 technical attribute rating, but now ranks within the bottom half of the Autos and Parts sector matrix. From here, the next level of support lies at $90, while the bullish support line resides at $87. |
| Name | Option Symbol | Action | Stop Loss |
|---|---|---|---|
| Walmart Inc. - $125.91 | O: 26G125.00D17 | Buy the July 125.00 calls at 10.35 | 114.00 |
| Name | Option | Action |
|---|---|---|
| Monster Beverage Corp. ( MNST) | Mar. 77.50 Calls | Raise the option stop loss to 6.60 (CP: 8.60) |
| Amphenol Corporation ( APH) | Apr. 150.00 Calls | Initiate an option stop loss of 9.60 (CP: 11.60) |
| Name | Option Symbol | Action | Stop Loss |
|---|---|---|---|
| Abbott Laboratories - $114.81 | O: 26T115.00D21 | Buy the August 115.00 puts at 7.25 | 130.00 |
| Name | Option | Action |
|---|---|---|
| Best Buy Co., Inc. ( BBY) | Apr. 67.50 Puts | Raise the option stop loss to 5.70 (CP: 7.70) |
| General Mills, Inc. ( GIS) | Jun. 47.50 Puts | Raise the option stop loss to 2.50 (CP: 4.50) |
| Datadog Inc Class A ( DDOG) | Apr. 125.00 Puts | Stopped at 21.65 (CP: 18.50) |
| Dutch Bros Inc. Class A ( BROS) | Apr. 55.00 Puts | Stopped at 6.60 (CP: 6.20) |
| Name | Option Sym. | Call to Sell | Call Price | Investment for 500 Shares | Annual Called Rtn. | Annual Static Rtn. | Downside Protection |
|---|---|---|---|---|---|---|---|
| Kinross Gold Corporation $ 36.06 | O: 26D36.00D17 | Apr. 36.00 | 3.00 | $ 16,735.40 | 46.37% | 46.37% | 7.23% |
| Name | Action |
|---|---|
| Intel Corporation ( INTC) - 46.12 | Sell the May 49.00 Calls. |
| The Gap, Inc. ( GAP) - 27.25 | Sell the March 29.00 Calls. |
| Enphase Energy Inc ( ENPH) - 49.74 | Sell the April 50.00 Calls. |
| Target Corporation ( TGT) - 115.52 | Sell the May 115.00 Calls. |
| Delta Air Lines Inc. ( DAL) - 69.23 | Sell the April 70.00 Calls. |
| Freeport-McMoRan Inc. ( FCX) - 67.88 | Sell the June 65.00 Calls. |
| Carnival Corporation ( CCL) - 31.61 | Sell the April 33.00 Calls. |
| Name | Covered Write |
|---|---|
| Alcoa Inc. ( AA - 61.41 ) | March 60.00 covered write. |
| nVent Electric plc ( NVT - 118.22 ) | April 115.00 covered write. |
| Ford Motor Company ( F - 14.20 ) | May 14.00 covered write. |
| Southwest Airlines Co. ( LUV - 50.64 ) | April 52.50 covered write. |
Daily Equity & Market Analysis
LISTEN TO PODCAST
Apr 02, 2026
Loading, Please Wait...
