Differing data sources allow us to get a more wholistic view of inflation trends.
The primary data source policymakers and institutions look at for inflation comes through the Bureau of Labor Statistics, along with plenty of other economic data. This has been the case for decades, however, over the last few years as data has become more readily available, other data collectors have compiled their own metrics. Truflation is one of largest providers of this new wave of ex-government data. One of the benefits of some of these new approaches like Truflation is that it can gather data from different sources that tend to have less lag than government data. Their overall inflation metric signaled a rapid rise in inflation much earlier than the government data and also turned lower before the government data did. While arguments can be made whether either the BLS or Truflation data is more relevant, the data generally shows that Truflation acts as a leading indicator of where the BLS data is headed. Truflation’s data sources are more focused on recent data and lessening the impacts of lag that BLS data has become known for over the last few years. Looking at year-over-year percent changes, Truflation’s US CPI Inflation Index has had a reading below 1% since the end of January whereas BLS’s CPI reading has yet to fall below 2%. If Truflation is a leading indicator, it’s showing that headline CPI data from the BLS is likely to continue to trend lower.

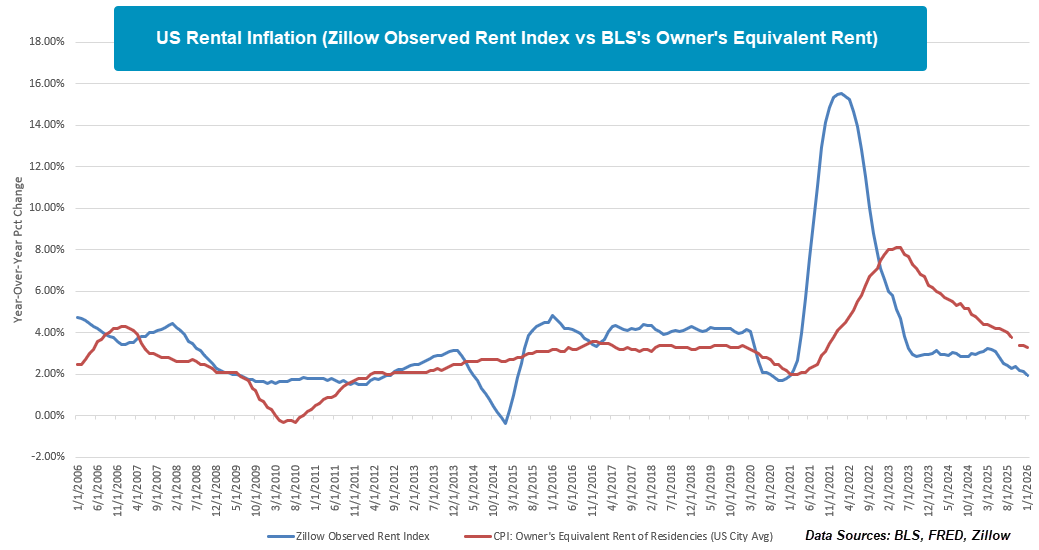
One specific area where the BLS’s data tends to lag the most is with respect housing costs. A key way Truflation looks to solve this problem is with data from places like Zillow to get more real-time housing data. For example, the Zillow Observed Rent Index (ZORI) measures changes in asking rents over time, controlling for changes in the quality of the available rental stock. By looking at listing prices, this greatly reduces the lag in how the BLS looks at rental costs via Owner’s Equivalent Rent which collects rent data from each sampled unit every six months. The results of the different methodologies become apparent when looking at their respective year-over-year percent changes over time. Zillow’s index picked up on the increases in rents in early 2021 whereas BLS’s Owner’s Equivalent Rent didn’t start to show warning signs of rising rents until very late in the year. ZORI peaked in early 2022 and showed cooling inflation moving forward while BLS metric didn’t peak until mid-2023. ZORI has continued to lead Owner’s Equivalent Rent over the last several years and is in the lower part of its historical range. BLS’s data still has some catching up to do but does seem to be heading back to historical norms. This setup is would be positive for fixed income and it does seem the market has noticed over the last few weeks with the Ten Year Yield Index (TNX) falling down to its lowest level this year.