Most Requested Symbols

The energy sector makes a run higher in the sector rankings.
Market action to open 2026 has seen "growthier" names take it on the chin. Today we observe a key RS relationship and explore what you need to know to stay ahead in today's fast-paced market.
Weekly Rundown Video – Jan 21, 2026
Weekly rundown with NDW analyst team covering all major asset classes.
Weekly rundown with NDW analyst team covering all major asset classes.
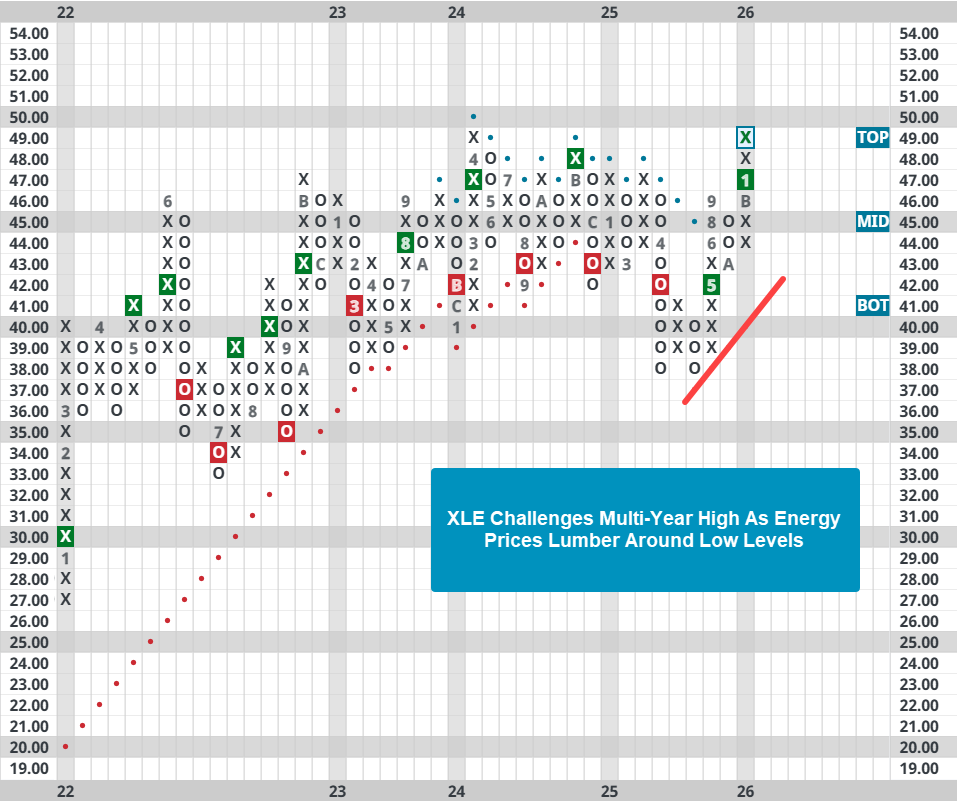
Energy has been at the bottom of our sector rankings for nearly two years as the general trend in energy prices has been lower. Crude oil (CL/) prices sit around $60 per barrel, and despite some short-term volatility in the natural gas (NG/) market, its prices are within normal ranges. Focusing on crude oil, it does seem that there is a strong floor in the mid-$50s, which makes sense as producers begin running into trouble if prices fall below that area for an extended period. At the same time, the energy sector is improving in the DALI sector rankings, having gained over 70 signals in its favor since the second half of 2025, the most of any sector. The State Street Energy Select SPDR ETF (XLE) is now one box away from making a new multi-year high and recently entered acceptable fund score territory for the first time in nearly a year. While energy lacks the level of relative strength worthy for investment right now, its improvement is enough to start thinking about exposure if it continues. XLE is up nearly 6.50% so far in 2026.
Within the traditional energy sector, there is one area that stands out: services. The VanEck Oil Services ETF (OIH) has gained roughly 15% this year and has an acceptable fund score of 4.24. With Wednesday’s action, OIH is trading at the top of its ten-week trading band, so it may slow down over the next few weeks while it normalizes. Nonetheless, the strong performance to start the year, solid fund score, and six consecutive buy signals make it a considerable option if the broader energy sector continues to improve.


Market action on Tuesday 1/20 was, for the most part, the first major chink in the armor of what has been an otherwise strong year. The move largely came at the hands of continued discussions over Greenland during the extended weekend, with President Trump considering further tariff escalation over European Union members who dissent in the possible US acquisition of the nation from Denmark. While it goes without saying that one ~2% decline day for the S&P 500 isn’t the end of the world (for bulls or bears…) it does signal that markets are, in some form, taking Trump’s comments about Greenland seriously. While there will undoubtedly be further headlines and actions worth watching in the near future, the decline does give us time to look around the platform. After all, while risk-on assets remain largely in control as we move to the end of January, there have been some signs of shifting leadership the astute money manager should monitor.
Starting broadly, we will focus on the US Equity Core Percent Rank on the Asset Class Group Scores (ACGS) Page. This reading represents where the average S&P 500 Index Fund group sits in relation to all 134 groups on the (ACGS) page. A higher reading denotes a stronger score- meaning the core of the market is harder to beat. Excluding a handful of declines, the last decade has been quite kind to the core… leading to exceptionally high scores. Despite this, action in 2026 had led to a slight exhale for the group, seeing the core percent rank fall below 90% for the first time since April of 2025. While this by no means spells the end for a dominant core in 2026, it does point to a shift in exactly what is leading so far this year. Included below are forward returns during other “meaningful” streaks above 90%, which have occurred a total of six times since late 2003. On average, a drop-off in core strength precedes a sub-par near-term performance for SPX, but hasn’t been particularly predictive of a weak longer-term outlook (1-2 years). Obviously any instance can buck historical trends, so this decline in strength for the core will be important to watch.

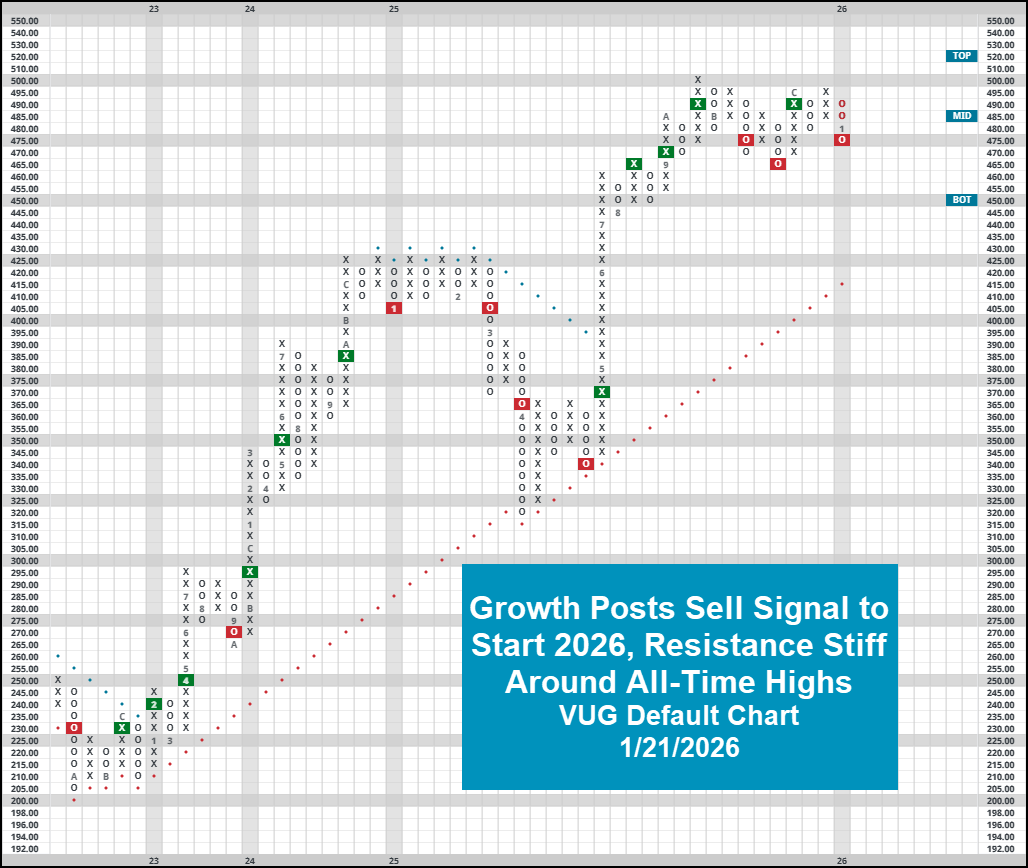
Growth names in particular have struggled as SPX is now in the red for the year (through 1/21/26). Evidenced by the >2.5% decline for growth representative (VUG), the fund has started off the new year by returning to a sell signal on its default PnF chart. While the fund score is still technically “acceptable” by NDW standards, the move does confirm an emerging range of resistance around $500. Market participants will be interested in watching nearby support around $465… and the ultimate goal will obviously be to establish (and sustain) new highs on meaningful rebounds.
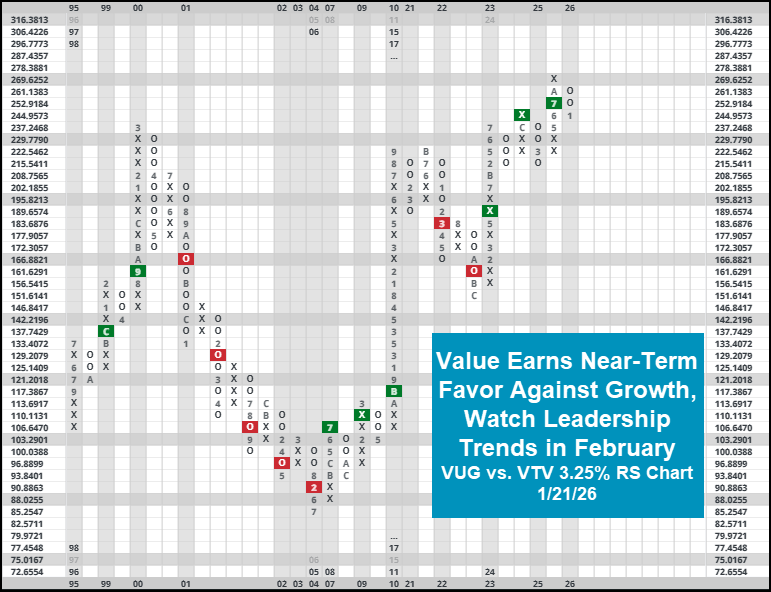
As always, we can also utilize relative strength to see if this absolute deterioration is leading to a meaningful shift in leadership. VUG saw a major hit to its fund score as it returned to a column of O’s on its respective relative strength chart against SPXEWI… its first material negative action since April 2025’s tariff tantrum. Growth has also deteriorated comparatively against value, evidenced by the RS chart below comparting VUG to VTV below. While growth maintains its long-term strength against value (and has since 2023) the reversal signifies a meaningful shift in near-term leadership. While other recent bouts of value focused leadership (August 2024, March/April 2025) have been short-lived, it will be of significant interest to see how this instance plays out going forward.
Remember, our job is to remain as objective as possible as markets go through their normal ebb and flow. There are certainly signs that the core of the market, particularly those growth names, are bleeding strength to other areas. While our long-term preferences remain with the names that have led us forwards for the last few years, you’d be best suited to start building out a list of options in the event a more meaningful rotation is underway.
Each week the analysts at NDW review and comment on all major asset classes in the global markets. Shown below is the summary or snapshot of the primary technical indicators we follow for multiple areas. Should there be changes mid-week we will certainly bring these to your attention via the report.
| Universe | BP Col & Level (actual) | BP Rev Level | PT Col & Level (actual) | PT Rev Level | HiLo Col & Level (actual) | HiLo Rev Level | 10 Week Col & Level (actual) | 10 Week Rev Level | 30 Week Col & Level (actual) | 30 Week Rev Level |
|---|---|---|---|---|---|---|---|---|---|---|
| ALL |
|
42% |
|
38% |
|
74% |
|
54% |
|
48% |
| NYSE |
|
56% |
|
54% |
|
80% |
|
74% |
|
60% |
| OTC |
|
36% |
|
34% |
|
70% |
|
50% |
|
44% |
| World |
|
46% |
|
44% |
|
|
|
58% |
|
54% |

Remember, these are technical comments only. Just as you must be aware of fundamental data for the stocks we recommend based on technical criteria in the report, so too must you be aware of important data regarding delivery, market moving government releases, and other factors that may influence commodity pricing. We try to limit our technical comments to the most actively traded contracts in advance of delivery, but some contracts trade actively right up to delivery while others taper off well in advance. Be sure you check your dates before trading these contracts. For questions regarding this section or additional coverage of commodities email james.west@nasdaq.com.
Data represented in the table below is through 1/20/26:
| Symbol | Name | Price | PnF Trend | RS Signal | RS Col. | 200 Day MA | Weekly Mom |
|---|---|---|---|---|---|---|---|
| CL/ | Crude Oil Continuous | 60.36 | Negative | Sell | O | 62.21 | + 4W |
| DBLCIX | Deutsche Bank Liquid Commodities Index | 468.52 | Positive | Sell | O | 460.74 | - 28W |
| DWACOMMOD | NDW Continuous Commodity Index | 1098.30 | Positive | Buy | O | 1003.55 | + 1W |
| GC/ | Gold Continuous | 4765.80 | Positive | Buy | X | 3693.97 | + 3W |
| HG/ | Copper Continuous | 5.78 | Positive | Buy | X | 4.96 | + 8W |
| ZG/ | Corn (Electronic Day Session) Continuous | 423.75 | Positive | Sell | O | 428.57 | - 4W |

Average Level
14.85
| < - -100 | -100 - -80 | -80 - -60 | -60 - -40 | -40 - -20 | -20 - 0 | 0 - 20 | 20 - 40 | 40 - 60 | 60 - 80 | 80 - 100 | 100 - > |
|---|---|---|---|---|---|---|---|---|---|---|---|
|
Buy signalONEQ
|
Sell signalicf
|
Buy signaldvy
|
|||||||||
|
Buy signalshy
|
Buy signalhyg
|
Buy signalijr
|
|||||||||
|
Buy signalQQQ
|
Buy signalVOOV
|
Buy signalfxe
|
Buy signalgsg
|
||||||||
|
Sell signalief
|
Buy signalXLG
|
Sell signallqd
|
Sell signaldx/y
|
Buy signaldia
|
Buy signalefa
|
Buy signalIJH
|
Buy signalgcc
|
||||
|
Sell signaltlt
|
Buy signalagg
|
Buy signalVOOG
|
Buy signalSPY
|
Buy signaluso
|
Buy signalrsp
|
Buy signaliwm
|
Buy signalEEM
|
Buy signalGLD
|
|||
| < - -100 | -100 - -80 | -80 - -60 | -60 - -40 | -40 - -20 | -20 - 0 | 0 - 20 | 20 - 40 | 40 - 60 | 60 - 80 | 80 - 100 | 100 - > |
| AGG | iShares US Core Bond ETF |
| USO | United States Oil Fund |
| DIA | SPDR Dow Jones Industrial Average ETF |
| DVY | iShares Dow Jones Select Dividend Index ETF |
| DX/Y | NYCE U.S.Dollar Index Spot |
| EFA | iShares MSCI EAFE ETF |
| FXE | Invesco CurrencyShares Euro Trust |
| GLD | SPDR Gold Trust |
| GSG | iShares S&P GSCI Commodity-Indexed Trust |
| HYG | iShares iBoxx $ High Yield Corporate Bond ETF |
| ICF | iShares Cohen & Steers Realty ETF |
| IEF | iShares Barclays 7-10 Yr. Tres. Bond ETF |
| LQD | iShares iBoxx $ Investment Grade Corp. Bond ETF |
| IJH | iShares S&P 400 MidCap Index Fund |
| ONEQ | Fidelity Nasdaq Composite Index Track |
| QQQ | Invesco QQQ Trust |
| RSP | Invesco S&P 500 Equal Weight ETF |
| IWM | iShares Russell 2000 Index ETF |
| SHY | iShares Barclays 1-3 Year Tres. Bond ETF |
| IJR | iShares S&P 600 SmallCap Index Fund |
| SPY | SPDR S&P 500 Index ETF Trust |
| TLT | iShares Barclays 20+ Year Treasury Bond ETF |
| GCC | WisdomTree Continuous Commodity Index Fund |
| VOOG | Vanguard S&P 500 Growth ETF |
| VOOV | Vanguard S&P 500 Value ETF |
| EEM | iShares MSCI Emerging Markets ETF |
| XLG | Invesco S&P 500 Top 50 ETF |

| Symbol | Company | Sector | Current Price | Action Price | Target | Stop | Notes |
|---|---|---|---|---|---|---|---|
| LAMR | Lamar Advertising Company | Media | $130.54 | 120s - low 130s | 158 | 110 | 4 for 5'er, top half of MEDI sector matrix, LT pos peer & mkt RS, spread triple top 4.8% yield, Earn 2/20 |
| HLT | Hilton Worldwide Holdings Inc | Leisure | $289.98 | hi 260s - low 280s | 328 | 240 | 5 for 5'er, top half of LEIS sector matrix LT pos peer & mkt RS, quintuple top, Earn. 2/11 |
| FLS | Flowserve Corporation | Machinery and Tools | $75.90 | hi 60s - lo 70s | 91 | 54 | 5 TA rating, top 10% of MACH sector matrix, LT RS buy, buy-on-pullback, Earn. 2/17 |
| BCO | The Brink's Company | Protection Safety Equipment | $123.48 | mid 110s - low 120s | 152 | 104 | 5 for 5'er, top half of PROT sector matrix, LT pos peer & mkt RS, spread triple top, R-R>2.0 |
| RL | Ralph Lauren | Textiles/Apparel | $360.22 | 352 - 380s | 472 | 296 | 5 TA rating, LT RS buy, consec buy signals, buy-on-pullback, Earn. 2/5 |
| CBRE | CBRE Group, Inc. | Real Estate | $165.36 | hi 150s - lo 170s | 188 | 134 | 5 TA rating, top 10% of REAL sector matrix, LT RS buy, consec buy signals, Earn. 2/12 |
| IMAX | Imax Corporation | Media | $37.61 | 33 - hi 30s | 53 | 26 | 5 TA rating, top 20% of Media sector matrix, LT pos trend, consec buy signals, buy-on-pullback, Earn. 2/18 |
| GIL | Gildan Activewear | Textiles/Apparel | $63.33 | 62 - 66 | 86 | 52 | 5 for 5'er, top third of favored TEXT sector matrix, LT pos peer & mkt RS, spread triple top, buy on pullback, R-R>2.0, Earn. 2/18 |
| FIX | Comfort Systems U.S.A. | Building | $1134.75 | 960 - mid 1100s | 1376 | 864 | 5 TA rating, top 10% of BUIL sector matrix, LT mkt RS buy, consec buy signals, Earn. 2/19 |
| WFC | Wells Fargo & Company | Banks | $86.66 | mid 80s - low 90s | 128 | 76 | 5 for 5'er, top 25% of BANK sector matrix, LT pos peer & mkt RS, buy on pullback, R-R~3.0 |
| JPM | J.P. Morgan Chase & Co. | Banks | $302.74 | lo 300s - mid 320s | 380 | 256 | 5 TA rating, top 25% of favored BANK sector matrix, LT RS buy, LT pos trend, buy-on-pullback |
| AER | AerCap Holdings NV | Aerospace Airline | $142.57 | mid 130 - mid 140 | 167 | 118 | 5/5'er since 4/25, LT pos. mkt and peer RS since '22, buy on pullback, Earn. 2/6 |
| ETR | Entergy Corporation | Utilities/Electricity | $94.75 | low-to-mid 90s | 107 | 86 | 5 for 5'er, top 20% of EUTI sector matrix, 2.7% yield Earn. 2/12 |
| Symbol | Company | Sector | Current Price | Action Price | Target | Stop | Notes |
|---|
| Symbol | Company | Sector | Current Price | Action Price | Target | Stop | Notes |
|---|---|---|---|---|---|---|---|
| CME | CME Group, Inc. | Wall Street | $279.91 | 260s - 270s | 312 | 224 | Removed for earnings. Earn. 2/4 |
| AFL | AFLAC Incorporated | Insurance | $109.26 | 108 - 115 | 143 | 95 | Removed for earnings. Earn. 2/4 |
| THC | Tenet Healthcare Corporation | Healthcare | $193.26 | 190 - mid 200s | 286 | 170 | THC has fallen to a sell signal OK to hold here. Maintain $170 stop. Earn. 2/11 |
| RJF | Raymond James Financial Inc | Wall Street | $167.83 | 160s | 186 | 142 | Removed for Earnings Earn. 1/28 |
| SPHR | Sphere Entertainment Co. | Leisure | $95.32 | 94-lo 100s | 114 | 80 | SPHR has fallen to a sell signal. OK to hold here. Maintain $80 stop. |
| Comment | |||||||
|---|---|---|---|---|---|---|---|
|
|
|||||||
ETR Entergy Corporation R ($95.51) - Utilities/Electricity - ETR is a 5 for 5'er that ranks in the top quintile of the utilities/electricity sector matrix. After giving two consecutive sell signals, ETR rallied and returned to a buy signal in last week's trading when it broke a double top at $95. Long exposure may be added in the low-to-mid $90s and we will set our initial stop at $86, which would take out two levels of support on ETR's chart and violate its trend line. We will use the bullish price objective, $107, as our near-term price objective. ETR also carries a 2.7% yield and is expected to report earnings on 2/12.
| 26 | |||||||||||||||||||||||||||||
| 98.00 | X | X | B | 98.00 | |||||||||||||||||||||||||
| 97.00 | X | O | X | O | X | O | X | 97.00 | |||||||||||||||||||||
| 96.00 | X | O | X | O | X | O | X | O | X | 96.00 | |||||||||||||||||||
| 95.00 | X | O | O | X | O | X | O | X | 95.00 | ||||||||||||||||||||
| 94.00 | A | O | X | O | X | C | 1 | X | Mid | 94.00 | |||||||||||||||||||
| 93.00 | X | O | O | O | X | O | X | 93.00 | |||||||||||||||||||||
| 92.00 | 8 | X | O | X | O | X | 92.00 | ||||||||||||||||||||||
| 91.00 | X | O | X | O | O | 91.00 | |||||||||||||||||||||||
| 90.00 | X | O | X | 90.00 | |||||||||||||||||||||||||
| 89.00 | X | O | X | 89.00 | |||||||||||||||||||||||||
| 88.00 | X | O | X | 88.00 | |||||||||||||||||||||||||
| 87.00 | X | X | 9 | 87.00 | |||||||||||||||||||||||||
| 86.00 | 4 | O | X | • | 86.00 | ||||||||||||||||||||||||
| 85.00 | O | X | O | X | X | • | Bot | 85.00 | |||||||||||||||||||||
| 84.00 | O | X | O | X | X | O | X | 6 | 7 | • | 84.00 | ||||||||||||||||||
| 83.00 | O | O | X | O | X | O | X | O | X | O | X | • | 83.00 | ||||||||||||||||
| 82.00 | O | X | O | X | O | X | O | X | O | X | • | 82.00 | |||||||||||||||||
| 81.00 | O | X | X | O | X | 5 | X | O | O | • | 81.00 | ||||||||||||||||||
| 80.00 | O | X | O | X | O | O | • | 80.00 | |||||||||||||||||||||
| 79.00 | O | X | O | X | • | 79.00 | |||||||||||||||||||||||
| 78.00 | O | X | O | X | • | 78.00 | |||||||||||||||||||||||
| 77.00 | O | X | O | X | • | 77.00 | |||||||||||||||||||||||
| 76.00 | O | O | • | 76.00 | |||||||||||||||||||||||||
| 26 |
| AGX Argan, Inc. ($397.00) - Building - AGX moved to all time highs with intraday action on 1/21. Up over 22% so far in 2026, the stock has gained significant technical favor over the last few weeks... sitting within a box on its peer RS chart of returning to a 5/5 TA score. While it is up substantially already in 2026, there is room for more upside, as we aren't yet in heavily overbought territory according to the weekly overbought/oversold reading. On pullbacks, look towards newly established support at $372. Keep in mind the name has an RRisk of 3.58 (over 3x market) so it can move around quite quickly. Keep this in mind when considering suitability. |
| MP MP Materials Corp. ($64.33) - Metals Non Ferrous - MP was down more than 5% Wednesday and gave a sell signal when it broke a double bottom at $65. Wednesday's move adds to an already weak technical picture as MP is a 1 for 5'er and ranks last out of 21 names in the metals non ferrous sector matrix. From here, the next level of support sits at $60. |
| MTDR Matador Resources Company ($43.79) - Oil - MTDR returned to a buy signal and a positive Wednesday when it broke a double top at $45. The outlook for the stock remains negative as even with the positive trend change MTDR is a unfavorable 1 for 5'er. From here, the first level of support sits at $40. |
| ON On Semiconductor Corp. ($63.54) - Semiconductors - ON rose Wednesday to break a double top at $63, notching a third consecutive buy signal. This also matches the stock's 52-week high from last July. The weight of the technical evidence is improving as ON moved back to a 3 for 5 TA rating last week. Initial support can be seen at $59 with further support at $54. Earnings are expected on 2/9. |
| ORLY O'Reilly Automotive, Inc. ($98.84) - Autos and Parts - ORLY reversed into Xs and broke a double top at $97 to return to a buy signal as shares rallied to $98. The stock has maintained a positive trend since 2009 and at least a 3 technical attribute rating since 2011. From here, note resistance lies at $102, while the stock's all-time chart high resides at $108. Initial support can be found at $93, while additional can be found at $90 and in the mid-$80s. |
| STLD Steel Dynamics Inc. ($179.99) - Steel/Iron - STLD returned to a buy signal and a positive trend Wednesday when it broke a double top at $178 and continued higher to notch a new all-time high at $180. Wednesday's move adds to an already positive technical picture as STLD is a 5 for 5'er and ranks in the top half of the favored steel/iron sector matrix. From here, the first level of support sits at $168. |
| Name | Option Symbol | Action | Stop Loss |
|---|---|---|---|
| Bank of America - $52.43 | O: 26D52.50D17 | Buy the April 52.50 calls at 2.56 | 48.00 |
| Name | Option | Action |
|---|---|---|
| Gilead Sciences, Inc. ( GILD) | Mar. 125.00 Calls | Initiate an option stop loss of 6.15 (CP: 8.15) |
| Archer-Daniels-Midland Company ( ADM) | Mar. 62.50 Calls | Raise the option stop loss to 3.80 (CP: 5.80) |
| Name | Option Symbol | Action | Stop Loss |
|---|---|---|---|
| American Tower REIT - $178.85 | O: 26P175.00D17 | Buy the April 175.00 puts at 7.50 | 196.00 |
| Name | Option | Action |
|---|---|---|
| Norwegian Cruise Line Holdings Ltd. ( NCLH) | Mar. 24.00 Puts | Initiate an option stop loss of 1.70 (CP: 3.60) |
| Name | Option Sym. | Call to Sell | Call Price | Investment for 500 Shares | Annual Called Rtn. | Annual Static Rtn. | Downside Protection |
|---|---|---|---|---|---|---|---|
| Semtech Corporation $ 77.10 | O: 26B80.00D20 | Feb. 80.00 | 5.50 | $ 37,778.50 | 58.63% | 58.63% | 5.79% |
| Name | Action |
|---|---|
| Lemonade Inc ( LMND) - 78.24 | Sell the February 80.00 Calls. |
| On Semiconductor Corp. ( ON) - 60.06 | Sell the March 60.00 Calls. |
| Dexcom Inc. ( DXCM) - 70.73 | Sell the February 70.00 Calls. |
| CAVA Group, Inc. ( CAVA) - 69.05 | Sell the February 70.00 Calls. |
| Name | Covered Write |
|---|---|
| Citigroup, Inc. ( C - 112.80 ) | April 115.00 covered write. |
Daily Equity & Market Analysis
LISTEN TO PODCAST
Apr 09, 2026
Loading, Please Wait...
