Market action to open 2026 has seen "growthier" names take it on the chin. Today we observe a key RS relationship and explore what you need to know to stay ahead in today's fast-paced market.
Market action on Tuesday 1/20 was, for the most part, the first major chink in the armor of what has been an otherwise strong year. The move largely came at the hands of continued discussions over Greenland during the extended weekend, with President Trump considering further tariff escalation over European Union members who dissent in the possible US acquisition of the nation from Denmark. While it goes without saying that one ~2% decline day for the S&P 500 isn’t the end of the world (for bulls or bears…) it does signal that markets are, in some form, taking Trump’s comments about Greenland seriously. While there will undoubtedly be further headlines and actions worth watching in the near future, the decline does give us time to look around the platform. After all, while risk-on assets remain largely in control as we move to the end of January, there have been some signs of shifting leadership the astute money manager should monitor.
Starting broadly, we will focus on the US Equity Core Percent Rank on the Asset Class Group Scores (ACGS) Page. This reading represents where the average S&P 500 Index Fund group sits in relation to all 134 groups on the (ACGS) page. A higher reading denotes a stronger score- meaning the core of the market is harder to beat. Excluding a handful of declines, the last decade has been quite kind to the core… leading to exceptionally high scores. Despite this, action in 2026 had led to a slight exhale for the group, seeing the core percent rank fall below 90% for the first time since April of 2025. While this by no means spells the end for a dominant core in 2026, it does point to a shift in exactly what is leading so far this year. Included below are forward returns during other “meaningful” streaks above 90%, which have occurred a total of six times since late 2003. On average, a drop-off in core strength precedes a sub-par near-term performance for SPX, but hasn’t been particularly predictive of a weak longer-term outlook (1-2 years). Obviously any instance can buck historical trends, so this decline in strength for the core will be important to watch.

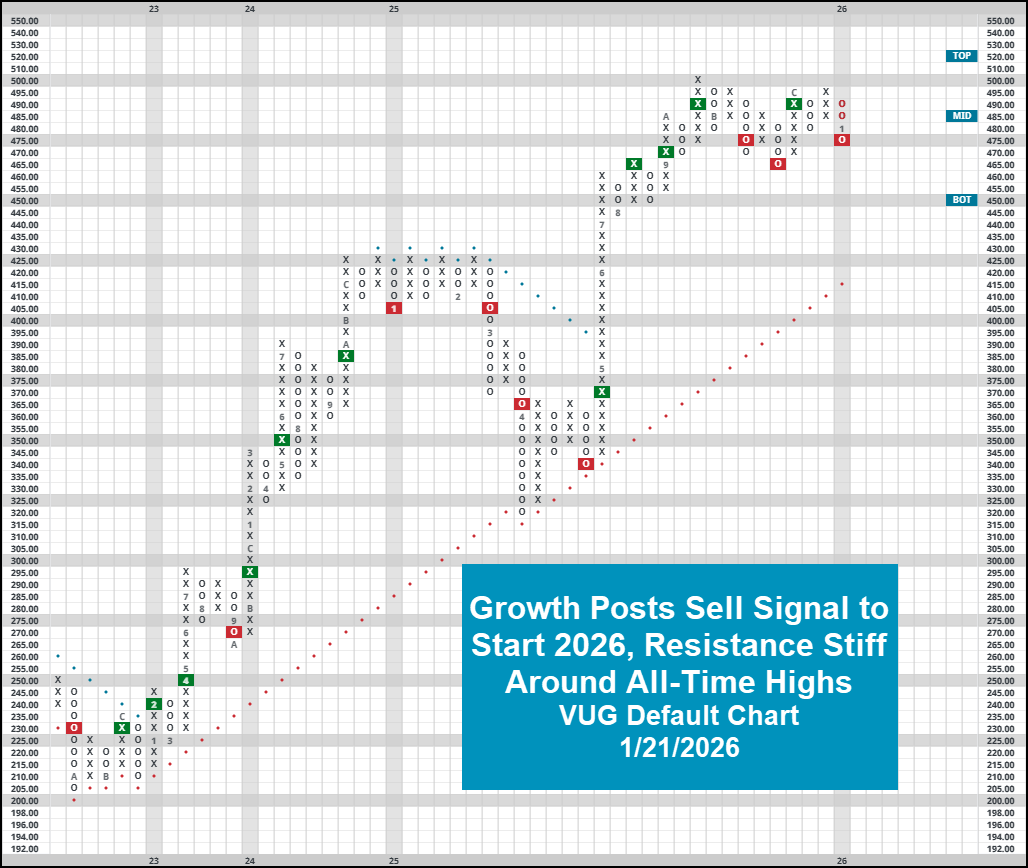
Growth names in particular have struggled as SPX is now in the red for the year (through 1/21/26). Evidenced by the >2.5% decline for growth representative (VUG), the fund has started off the new year by returning to a sell signal on its default PnF chart. While the fund score is still technically “acceptable” by NDW standards, the move does confirm an emerging range of resistance around $500. Market participants will be interested in watching nearby support around $465… and the ultimate goal will obviously be to establish (and sustain) new highs on meaningful rebounds.
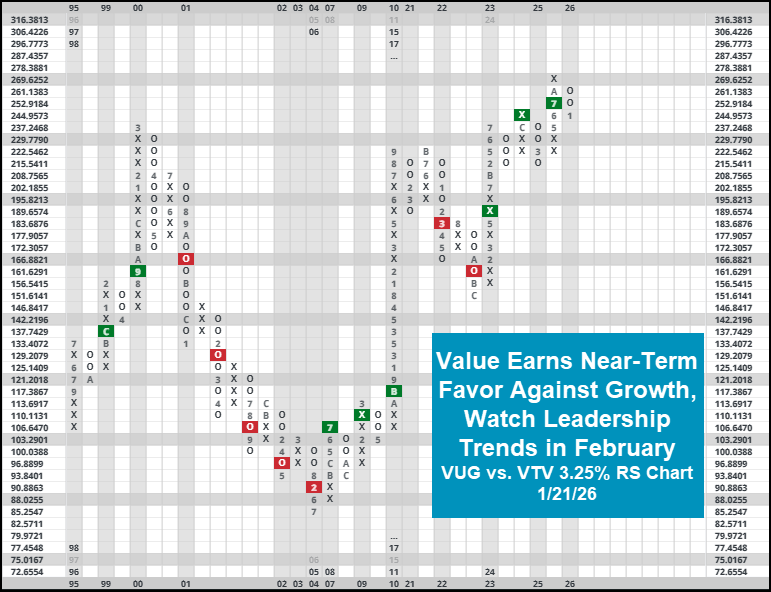
As always, we can also utilize relative strength to see if this absolute deterioration is leading to a meaningful shift in leadership. VUG saw a major hit to its fund score as it returned to a column of O’s on its respective relative strength chart against SPXEWI… its first material negative action since April 2025’s tariff tantrum. Growth has also deteriorated comparatively against value, evidenced by the RS chart below comparting VUG to VTV below. While growth maintains its long-term strength against value (and has since 2023) the reversal signifies a meaningful shift in near-term leadership. While other recent bouts of value focused leadership (August 2024, March/April 2025) have been short-lived, it will be of significant interest to see how this instance plays out going forward.
Remember, our job is to remain as objective as possible as markets go through their normal ebb and flow. There are certainly signs that the core of the market, particularly those growth names, are bleeding strength to other areas. While our long-term preferences remain with the names that have led us forwards for the last few years, you’d be best suited to start building out a list of options in the event a more meaningful rotation is underway.