Most Requested Symbols

Crude oil falls as gasoline prices remain elevated.
Despite lagging behind so far this year, the Mag 7 have turned it around a bit to open April. We look at the group's situation in today's featured article.
Weekly Rundown Video – April 15, 2026
Weekly rundown with NDW analyst team covering all major asset classes.
Weekly rundown with NDW analyst team covering all major asset classes.
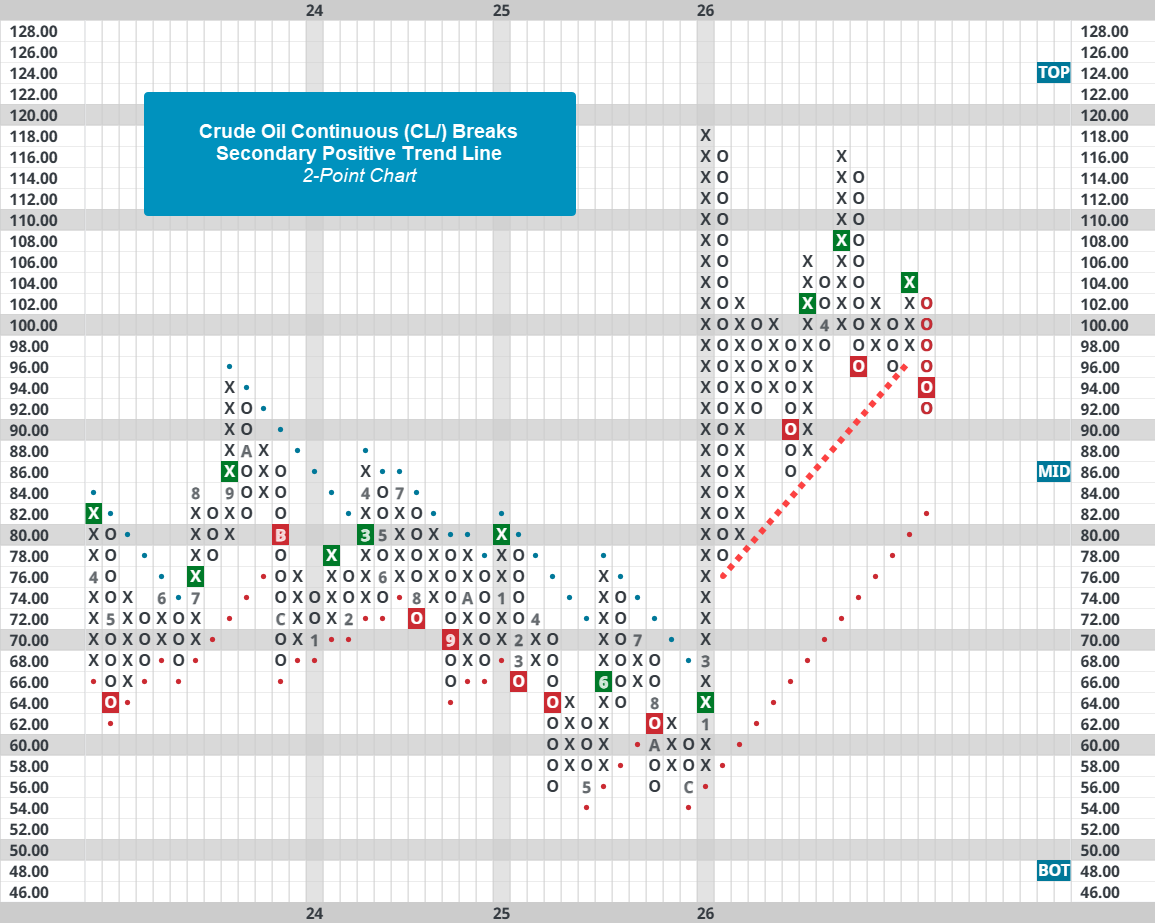
Equity markets have ripped higher over the last two weeks as investors became more hopeful of an end to the conflict in the Middle East. However, energy related commodities, particularly oil and gasoline, have remained elevated. That isn’t to say that some progress has been made for consumers at the pump. Crude Oil Continuous (CL/) gave a sell signal on its less sensitive 2-point chart following Tuesday’s action. While crude oil has bounced back and forth between giving buy and sell signals (expected given the heightened volatility), this recent sell signal breaks intermediate series of higher lows. In other words, the breakdown this week breaks a positive trendline that started after crude oil’s initial shock high. The chart’s bullish support line is still ten points away at $82, but these secondary trend lines can come in handy following a large upside or downside move.
Gasoline prices have also softened, but not to the same extent as crude oil prices. This is natural as gasoline must be processed, which creates a lag between input and output prices. Nonetheless, Gasoline Reformulated Continuous (UJ/) trades on a sell signal with established resistance from $3.20 to $3.40. Unlike crude oil, gasoline is still holding its secondary trend line following the initial shock move higher. There is also support at $2.90 on its 5-cent chart, which is an area where gasoline has found resistance over the last few years. For those that have energy exposure via stocks or ETFs, keep a close eye on gasoline as an indicator for any tailwinds/headwinds for the sector.


As yesterday’s feature detailed, the cap is back. Of course, when talking about the world’s biggest companies, we would be remiss not to focused on everyone’s favorite, the magnificent seven. In 2026, the magnificent seven has been more a bit more mediocre than magnificent, with the average member down 3.22% YTD compared to the near 2% gain for SPX. Many of the group sit well off highs established earlier in 2026, but the recent rally has been encouraging. In fact, as of price action through 4/14, the Nasdaq-100 (NDX) has put in a streak of 11 straight days of positive returns coming off the news of the most recent ceasefire in the Middle East which spurred major markets back towards positive for the year. Of course, as with any notable streak, questions arise about the magnitude of downside action when they break. Gain streaks like the one we are on (and still building with NDX landing in the green on 4/15) are quite rare, seeing NDX only post a winning streak longer than 11 days eight other times since 1992. As you may expect, more near-term results (5-day) after streaks end see negative average returns…. But more often than not don’t tend to carry over to the next month, three months, of half a year. At least conversationally, this makes sense: you don’t typically see gain streaks in weak (or weakening) market environments. While it certainly is true that markets have seen a bit of turbulence so far this year, they are far from being considered “weak.” All this to say, remind your clients that no winning streak can last forever, but history suggests markets will find their footing when this one does end.

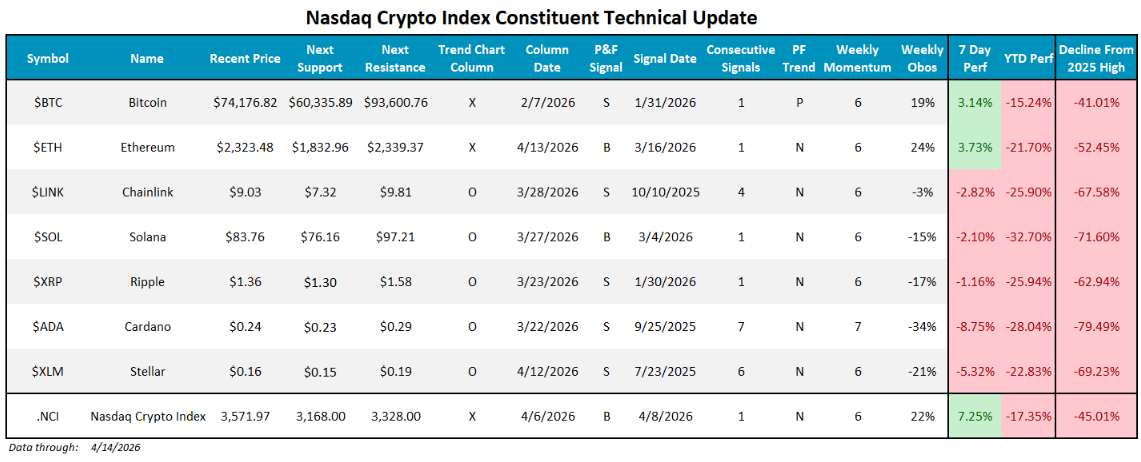
Getting back to the magnificent seven conversation, we will look at a handful of interesting pictures for members of the magnificent seven. Performance for the group has been quite intense since the start of April. Amazon (AMZN) has been the strongest performer of the group, having gained just over 18% since 4/1. The only name to have retreated since the start of April has been Tesla, which is off almost 5% as it continues what has been a poor 2026 campaign. The table below showcases additional details for each mag-7 member, including their TA score, individual points away from support and respective OBOS reading at the time of this writing. Some high level details:

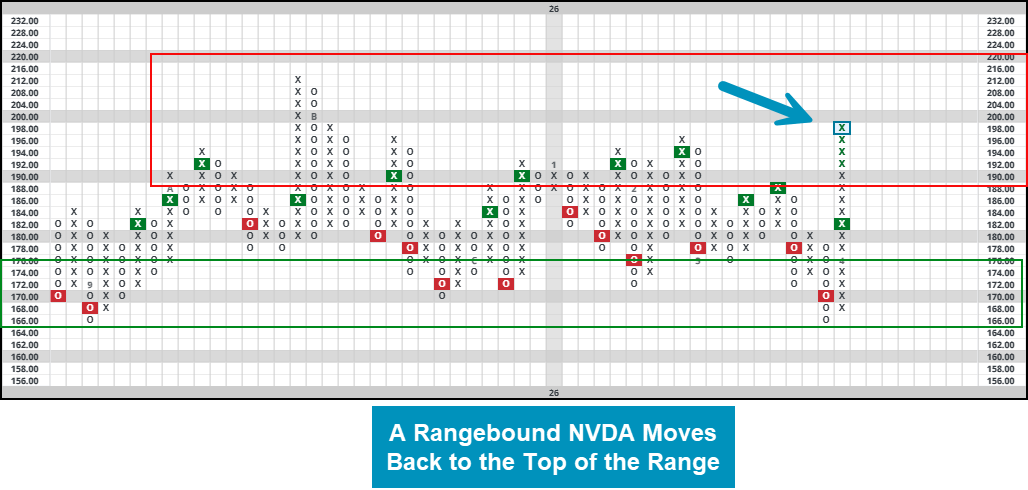
NVDA has perhaps the most interesting technical picture as of 4/15. Semiconductors have been overwhelmingly resilient in 2026, besting other areas within technology (namely software) quite handily this year. Nvidia has largely swung back and forth between technically acceptable and a name we have looked to shy away from so far in 2026. Largely speaking, the stock has remained rangebound for the better part of the last year, bouncing back and forth between the mid-$160’s and all time highs. This rangebound action has led to some relative deterioration against other semiconductor stocks (NVDA now ranks 58th of 68 within its peer group matrix), seeing the 3/5’er return to both a sell signal and column of X’s against the DWASEMI peer group. This action leaves NVDA and other mag-7 names for that matter- in quite an interesting position. On one hand, markets seem to have digested the Iran war and are ready to push towards new highs. On the other, NVDA has come up to current levels now 11 different times over the last year, the sign of strong supply coming online. Similar commentary can be made for the likes of META or AMZN.
To avoid rambling, very similar, detailed commentary could be offered for each of these names. It’s also worth mentioning that many of your clients will have unique situations when it comes to the mag-7, particularly from a tax standpoint. Keep this in mind when making decisions that could impact you or your client next Tax Day. As always, set alerts to be notified of specific TA score changes or violations of desired support or resistance levels.
Each week the analysts at NDW review and comment on all major asset classes in the global markets. Shown below is the summary or snapshot of the primary technical indicators we follow for multiple areas. Should there be changes mid-week we will certainly bring these to your attention via the report.
| Universe | BP Col & Level (actual) | BP Rev Level | PT Col & Level (actual) | PT Rev Level | HiLo Col & Level (actual) | HiLo Rev Level | 10 Week Col & Level (actual) | 10 Week Rev Level | 30 Week Col & Level (actual) | 30 Week Rev Level |
|---|---|---|---|---|---|---|---|---|---|---|
| ALL |
|
36% |
|
42% |
|
48% |
|
44% |
|
40% |
| NYSE |
|
48% |
|
52% |
|
52% |
|
50% |
|
50% |
| OTC |
|
34% |
|
38% |
|
44% |
|
44% |
|
36% |
| World |
|
36% |
|
44% |
|
|
|
38% |
|
40% |

Remember, these are technical comments only. Just as you must be aware of fundamental data for the stocks we recommend based on technical criteria in the report, so too must you be aware of important data regarding delivery, market moving government releases, and other factors that may influence commodity pricing. We try to limit our technical comments to the most actively traded contracts in advance of delivery, but some contracts trade actively right up to delivery while others taper off well in advance. Be sure you check your dates before trading these contracts. For questions regarding this section or additional coverage of commodities email james.west@nasdaq.com.
Data represented in the table below is through 4/14/2026:
| Symbol | Name | Price | PnF Trend | RS Signal | RS Col. | 200 Day MA | Weekly Mom |
|---|---|---|---|---|---|---|---|
| CL/ | Crude Oil Continuous | 91.28 | Positive | Sell | X | 67.07 | - 2W |
| DBLCIX | Deutsche Bank Liquid Commodities Index | 468.52 | Positive | Sell | O | 460.74 | - 40W |
| DWACOMMOD | NDW Continuous Commodity Index | 1163.76 | Positive | Buy | X | 1049.72 | - 2W |
| GC/ | Gold Continuous | 4825.00 | Positive | Buy | O | 4165.87 | - 6W |
| HG/ | Copper Continuous | 6.07 | Positive | Sell | O | 5.28 | + 1W |
| ZG/ | Corn (Electronic Day Session) Continuous | 443.00 | Negative | Sell | O | 425.42 | - 2W |
Average Level
21.75
| < - -100 | -100 - -80 | -80 - -60 | -60 - -40 | -40 - -20 | -20 - 0 | 0 - 20 | 20 - 40 | 40 - 60 | 60 - 80 | 80 - 100 | 100 - > |
|---|---|---|---|---|---|---|---|---|---|---|---|
|
Buy signalhyg
|
|||||||||||
|
Buy signalIJH
|
Buy signalijr
|
||||||||||
|
Sell signaldx/y
|
Buy signalefa
|
Buy signaliwm
|
|||||||||
|
Buy signaltlt
|
Buy signalfxe
|
Sell signalQQQ
|
|||||||||
|
Sell signalief
|
Sell signallqd
|
Buy signalEEM
|
Buy signalVOOG
|
||||||||
|
Buy signaldvy
|
Buy signalVOOV
|
Sell signalXLG
|
Buy signalGSG
|
||||||||
|
Sell signalagg
|
Buy signalrsp
|
Buy signalicf
|
Buy signalONEQ
|
||||||||
|
Buy signalshy
|
Buy signalgld
|
Sell signaldia
|
Buy signalSPY
|
Sell signalUSO
|
Buy signalGCC
|
||||||
| < - -100 | -100 - -80 | -80 - -60 | -60 - -40 | -40 - -20 | -20 - 0 | 0 - 20 | 20 - 40 | 40 - 60 | 60 - 80 | 80 - 100 | 100 - > |
| AGG | iShares US Core Bond ETF |
| USO | United States Oil Fund |
| DIA | SPDR Dow Jones Industrial Average ETF |
| DVY | iShares Dow Jones Select Dividend Index ETF |
| DX/Y | NYCE U.S.Dollar Index Spot |
| EFA | iShares MSCI EAFE ETF |
| FXE | Invesco CurrencyShares Euro Trust |
| GLD | SPDR Gold Trust |
| GSG | iShares S&P GSCI Commodity-Indexed Trust |
| HYG | iShares iBoxx $ High Yield Corporate Bond ETF |
| ICF | iShares Cohen & Steers Realty ETF |
| IEF | iShares Barclays 7-10 Yr. Tres. Bond ETF |
| LQD | iShares iBoxx $ Investment Grade Corp. Bond ETF |
| IJH | iShares S&P 400 MidCap Index Fund |
| ONEQ | Fidelity Nasdaq Composite Index Track |
| QQQ | Invesco QQQ Trust |
| RSP | Invesco S&P 500 Equal Weight ETF |
| IWM | iShares Russell 2000 Index ETF |
| SHY | iShares Barclays 1-3 Year Tres. Bond ETF |
| IJR | iShares S&P 600 SmallCap Index Fund |
| SPY | SPDR S&P 500 Index ETF Trust |
| TLT | iShares Barclays 20+ Year Treasury Bond ETF |
| GCC | WisdomTree Continuous Commodity Index Fund |
| VOOG | Vanguard S&P 500 Growth ETF |
| VOOV | Vanguard S&P 500 Value ETF |
| EEM | iShares MSCI Emerging Markets ETF |
| XLG | Invesco S&P 500 Top 50 ETF |

| Symbol | Company | Sector | Current Price | Action Price | Target | Stop | Notes |
|---|---|---|---|---|---|---|---|
| CNX | CNX Resources Corp | Oil | $38.37 | hi 30s - mid 40s | 71 | 33 | 5 TA rating, top 50% of OIL sector matrix, LT RS buy and pos trend, consec buy signals, Earn. 4/30 |
| INVA | Innoviva, Inc | Drugs | $24.19 | lo-mid 20s | 32.50 | 18.50 | 5 TA rating, top half of drugs sector RS matrix, LT pos trend, LT RS buy, buy-on-pullback, Earn. 5/6 |
| GSK | GlaxoSmithKline Plc. (United Kingdom) ADR | Drugs | $59.18 | hi 40s - mid 50s | 67 | 42 | 5 TA rating, top 25% of DRUG sector matrix, LT pos trend, yield > 3%, buy-on-pullback, Earn. 4/29 |
| ADI | Analog Devices, Inc. | Semiconductors | $348.60 | 310s - 330s | 380 | 268 | 4 for 5'er, top half of favored SEMI sector matrix, LT pos market RS, return to buy signal |
| CSCO | Cisco Systems, Inc. | Computers | $82.61 | Upper 70s to lower 80s | 96 | 70 | 5 for 5'er; top quintile of Computers matrix; Pos. Trend since Sept. '24; Bull Triangle on 3/25, Earn. 5/13 |
| CAT | Caterpillar, Inc. | Machinery and Tools | $794.25 | 680s - 720s | 848 | 592 | 5 for 5'er, top 10% in favored MACH sector matrix, LT pos peer & mkt RS, buy on pullback, Earn. 4/30 |
| DBD | Diebold Nixdorf Inc | Finance | $85.49 | low-to-mid 70s | 99 | 63 | 5 for 5'er, #3 of 77 in FINA sector matrix, LT pos peer RS, bearish signal reversal, R-R>2.0, Earn. 4/30/b> |
| NI | Nisource, Inc. | Gas Utilities | $47.22 | mid-hi 40s | 78 | 38 | 5 TA rating, LT pos trend, LT mkt RS buy, consec buy signals, Earn. 5/6 |
| FHI | Federated Hermes Inc | Wall Street | $58.30 | 54-hi 50s | 91 | 46 | 5 TA rating, top 25% of WALL sector RS matrix, LT pos trend and mkt RS buy, consec buy signals, good R-R, Earn. 4/30 |
| CRS | Carpenter Technology Corporation | Steel/Iron | $438.80 | hi 370s - low 400s | 500 | 348 | 5 for 5'er, top third of STEE sector matrix, LT pos peer & mkt RS, spread quintuple top, buy on pullback, Earn. 4/29 |
| COST | Costco Wholesale Corporation | Retailing | $974.80 | 944-1050s | 1296 | 832 | 4 TA rating, top 33% of retail sector matrix, LT mkt RS buy, LT pos trend, consec buy signals |
| ATRO | Astronics Corp | Aerospace Airline | $76.06 | hi 60s - mid 70s | 90 | 59 | 5 for 5'er, top 20% of AERO sector matrix, bearish signal reversal to spread triple top, Earn. 5/12 |
| BURL | Burlington Stores, Inc. | Retailing | $335.04 | mid 320s to 340s | 400 | 284 | 5 for 5'er; top quintile of Retail matrix; Multi-Yr High on 4/9; R-R > 4. |
| AMG | Affiliated Managers Group | Wall Street | $303.21 | 270s - 280s | 356 | 232 | 5 for 5'er, top third of WALL sector matrix, LT pos peer RS, spread triple top, Earn. 5/7 |
| ATI | ATI Inc. | Aerospace Airline | $163.03 | 150s - mid 160s | 192 | 134 | 5 for 5'er, top 10% of favored AERO sector matrix, LT pos peer & mkt RS, bullish catapult, Earn. 4/30 |
| DRS | Leonardo DRS, Inc. | Aerospace Airline | $47.54 | mid-hi 40s | 66 | 37 | 4 TA rating, top 25% of aerospace/airline sector matrix, consec buy signals, LT pos trend, Earn. 5/5 |
| SPG | Simon Property Group, Inc. | Real Estate | $202.96 | 190s - low 200s | 246 | 172 | 5 for 5'er, top 20% of REAL sector matrix, LT pos peer & mkt RS, bearish signal reversal, 4.3% yield, Earn. 5/11 |
| Symbol | Company | Sector | Current Price | Action Price | Target | Stop | Notes |
|---|---|---|---|---|---|---|---|
| CPRT | Copart Incorporated | Autos and Parts | $33.29 | hi 30s | 28 | 42 | 1 TA rating, bottom 50% of AUTO sector matrix, NT and mkt RS sell last month, consec sell signals |
| Symbol | Company | Sector | Current Price | Action Price | Target | Stop | Notes |
|---|---|---|---|---|---|---|---|
| CGON | CG Oncology, Inc. | Biomedics/Genetics | $67.28 | hi 50s - low 60s | 80 | 50 | CGON has fallen to a sell signal. OK to hold here. Raise top to $59. Earn. 5/7 |
| Comment | |||||||
|---|---|---|---|---|---|---|---|
|
|
|||||||
SPG Simon Property Group, Inc. R ($201.46) - Real Estate - SPG is a 5 for 5'er that ranks in the top quintile of the real estate sector matrix and has been on peer & market RS buy signals since 2021. After giving three consecutive sell signals, SPG returned to a buy signal last week when it completed a bearish signal reversal at $194. Long exposure may be added in the $190s to low $200s and we will set our initial stop at $172. We will use the bullish price objective, $246, as our target price. SPG also carries a 4.3% yield and is expected to report earnings on 5/11.
| 26 | |||||||||||||||||||||||||||||
| 204.00 | X | • | 204.00 | ||||||||||||||||||||||||||
| 200.00 | X | X | O | • | X | 200.00 | |||||||||||||||||||||||
| 198.00 | X | O | X | O | • | X | 198.00 | ||||||||||||||||||||||
| 196.00 | X | O | X | 3 | • | X | 196.00 | ||||||||||||||||||||||
| 194.00 | 2 | O | X | O | X | • | X | 194.00 | |||||||||||||||||||||
| 192.00 | X | O | O | X | O | X | X | Mid | 192.00 | ||||||||||||||||||||
| 190.00 | X | O | X | O | X | O | X | 190.00 | |||||||||||||||||||||
| 188.00 | X | X | X | O | • | O | X | O | 4 | 188.00 | |||||||||||||||||||
| 186.00 | X | O | X | X | O | X | • | O | O | X | 186.00 | ||||||||||||||||||
| 184.00 | X | X | O | X | O | X | O | X | • | O | X | 184.00 | |||||||||||||||||
| 182.00 | 9 | O | X | A | X | O | X | 1 | • | O | X | 182.00 | |||||||||||||||||
| 180.00 | X | O | X | O | B | C | • | O | X | 180.00 | |||||||||||||||||||
| 178.00 | X | O | O | X | • | O | • | 178.00 | |||||||||||||||||||||
| 176.00 | X | O | X | • | • | 176.00 | |||||||||||||||||||||||
| 174.00 | X | O | • | 174.00 | |||||||||||||||||||||||||
| 172.00 | X | • | 172.00 | ||||||||||||||||||||||||||
| 170.00 | O | X | X | • | 170.00 | ||||||||||||||||||||||||
| 168.00 | O | X | X | O | X | • | Bot | 168.00 | |||||||||||||||||||||
| 166.00 | O | X | X | O | X | O | X | • | 166.00 | ||||||||||||||||||||
| 164.00 | O | X | 7 | O | X | O | X | O | • | 164.00 | |||||||||||||||||||
| 162.00 | O | X | O | X | O | X | 8 | X | • | 162.00 | |||||||||||||||||||
| 160.00 | O | X | O | X | O | • | O | • | 160.00 | ||||||||||||||||||||
| 158.00 | O | X | 6 | X | • | • | 158.00 | ||||||||||||||||||||||
| 156.00 | O | O | • | 156.00 | |||||||||||||||||||||||||
| 26 |
| AAPL Apple Inc. ($266.43) - Computers - AAPL moved higher Wednesday to break a double top at $264. This stock has a 5 for 5 TA rating and sits in the top half of the computers sector RS matrix. The stock has been on an RS buy signal against the market since 2004 and maintained a positive trend since last July. The weight of the technical evidence is positive and improving again. Initial support can be seen at $248 with further support at $244. |
| DRI Darden Restaurants, Inc. ($202.09) - Restaurants - DRI broke a triple top at $200 to return the stock to a buy signal and penetrate the bearish resistance line, shifting the trend back to positive. The trend change will increase the stock to a 4 for 5'er that maintains positive long-term RS versus the market and its peer group. From here, resistance lies at $208 and $220, the February 2026 rally high. Initial support lies at $188, the bullish support line, as well as at $184. |
| LLY Eli Lilly and Company ($903.93) - Drugs - LLY inched lower to complete a bearish triangle at $896, marking its second consecutive sell signal. The 2 for 5'er moved down from a 4 at the start of this month, after reversing back into Os against and its peers and moving back into a negative trend. Additionally, the stock ranks in the bottom half of the drugs sector matrix. A sell can be made here. Initial strong resistance is between $960-$976, with additional strong resistance at $1056. |
| SCCO Southern Copper Corporation ($189.80) - Metals Non Ferrous - SCCO fell to a sell signal Wednesday when it broke a double bottom at $188. The outlook for the stock remains positive, however, as SCCO is a 5 for 5'er. From here, the next level of support sits at $172. |
| TSLA Tesla Inc. ($390.31) - Autos and Parts - TSLA broke a double top at $368 to complete a bearish signal reversal pattern as shares rallied to $392. The move not only returns the stock to a buy signal but flips the trend back to positive, increasing the stock up to a 3 for 5'er. Whille maintaining long-term RS buy signals, the stock continues to show negative near-term RS against the market and its peer group. From here, the next level of notable resistance lies at $416 on the chart. Initial support lies at $340, the bullish support line. |
| TTWO Take-Two Interactive Software, Inc. ($213.23) - Leisure - TTWO broke a double top at $208 for a third buy signal as shares rallied to $212. This breakout follows the stock shifting the trend back to positive during trading last week, increasing the stock up to a 3 for 5'er. TTWO maintains positive long-term RS buy signal, but continues to maintained negative near-term RS against the market and its peer group. From here, the next notable levels of resistance lies at $220 and $228. Initial support lies in the mid $190s, while additional can be found at $188. |
| Name | Option Symbol | Action | Stop Loss |
|---|---|---|---|
| Palo Alto Networks Inc - $164.82 | O: 26G165.00D17 | Buy the July 165.00 calls at 15.80 | 150.00 |
| Name | Option | Action |
|---|---|---|
| Apple Inc. ( AAPL) | Jul. 260.00 Calls | Initiate an option stop loss of 16.65 (CP: 18.65) |
| Delta Air Lines Inc. ( DAL) | Jul. 67.50 Calls | Raise the option stop loss to 7.15 (CP: 9.15) |
| Name | Option Symbol | Action | Stop Loss |
|---|---|---|---|
| Paychex, Inc. - $90.31 | O: 26U90.00D18 | Buy the September 90.00 puts at 8.00 | 97.00 |
| Name | Option | Action |
|---|---|---|
| Zoom Communications Inc. ( ZM) | Aug. 82.50 Puts | Stopped at 88.00 (CP: 89.37) |
| Paypal Holdings Inc ( PYPL) | Jul. 45.00 Puts | Stopped at 49.00 (CP: 49.72) |
| Name | Option Sym. | Call to Sell | Call Price | Investment for 500 Shares | Annual Called Rtn. | Annual Static Rtn. | Downside Protection |
|---|---|---|---|---|---|---|---|
| DHT Holdings, Inc. $ 17.18 | O: 26E18.00D15 | May. 18.00 | 0.90 | $ 8,407.15 | 73.11% | 51.79% | 4.08% |
| Name | Action |
|---|---|
| Palantir Technologies Inc. Class A ( PLTR) - 135.70 | Sell the July 150.00 Calls. |
| Alcoa Inc. ( AA) - 71.84 | Sell the July 75.00 Calls. |
| Dow, Inc. ( DOW) - 39.16 | Sell the May 40.00 Calls. |
| Frontline PLC ( FRO) - 34.16 | Sell the August 40.00 Calls. |
| Target Corporation ( TGT) - 119.53 | Sell the July 120.00 Calls. |
| Name | Covered Write |
|---|---|
|
|
|
Daily Equity & Market Analysis
LISTEN TO PODCAST
Apr 09, 2026
Loading, Please Wait...
