Most Requested Symbols

The curve has an average reading of 12.47%.
Today's featured stock is Aramark (ARMK).
Comments include: CAVA & SPB.
Call: Amazon.com (AMZN); Put: Cenovus Energy (CVE); Covered Write: Freeport-McMoRan (FCX).
NDW Morning Update Video - May 28, 2024
NDW Morning Update Video – May 28, 2024.
Click here to download MP3
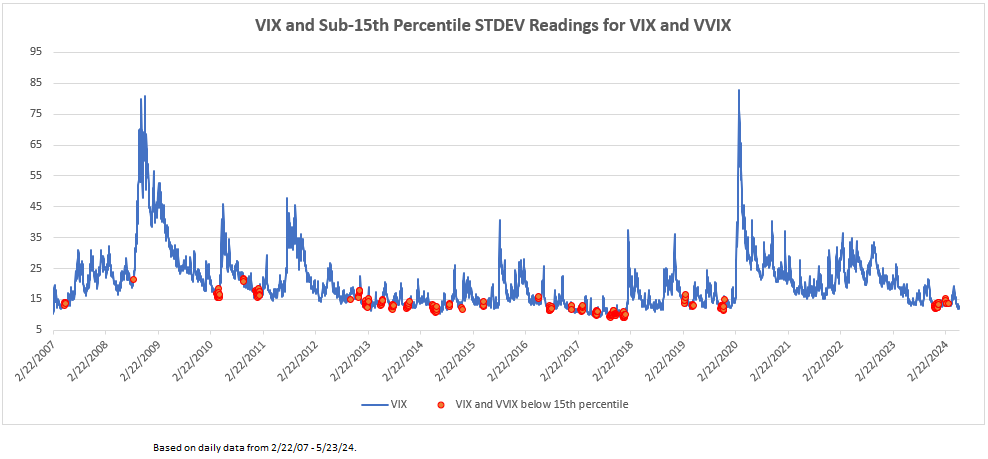
At various points over the last few weeks, we have discussed the recent decline in US equity volatility – the S&P 500 Volatility Index (VIX) has given multiple consecutive sell signals and fallen to its lowest level since 2019. Historically, when the VIX has dropped to extremely low levels it has often been followed by a spike in volatility. In an extreme example, the VIX hit an all-time low just above 8.5 in late November 2017, then spiked to 14.50 in December. By early January, the market had calmed and the VIX sat around 9, just above its all-time low. Roughly a month later, we experienced one of the largest one-day volatility increases ever when the VIX made a 10 standard deviation jump during “Volmageddon.” Of course, every period of low volatility doesn’t necessarily result in a VIX spike.
One method/indicator for anticipating VIX spikes is looking at the standard deviation of the VIX and the VIX Volatility Index (VVIX). A study that has previously been cited has shown that when the 20-day standard deviation of VIX and VVIX simultaneously drop below the 15th percentile, it has historically been followed by an average increase of 30-45% in the VIX over the next 30 days.
The graph below shows the price history of the VIX since 2007 with periods when the 20-day standard deviation of the VIX and VVIX fell below the 15th percentile indicated in red. We can see that a rise follows most red periods in the VIX – sometimes a relatively moderate rise, as we saw earlier this year – and sometimes by a dramatic spike, like in early 2018. You will also notice that there are red dots at the bottom right edge of the graph. While the VIX currently sits near multi-year lows, there has been enough volatility of volatility to keep this indicator from triggering. There is, of course, no guarantee that we won’t see a volatility spike, but this indicator is signaling that the low volatility we’ve experienced recently could continue, at least for the short term.

AI-focused “Fab Five” lift large caps to best earnings growth in almost 2 years
We wanted to hold off until we got Nvidia’s earnings before doing our Q1 earnings recap… and they did not disappoint (+468% YoY earnings growth for Nvidia)!
Now, Q1 earnings season is all but done for the S&P 500 (96% reported), and it turned out pretty well for large caps (and especially mega caps).
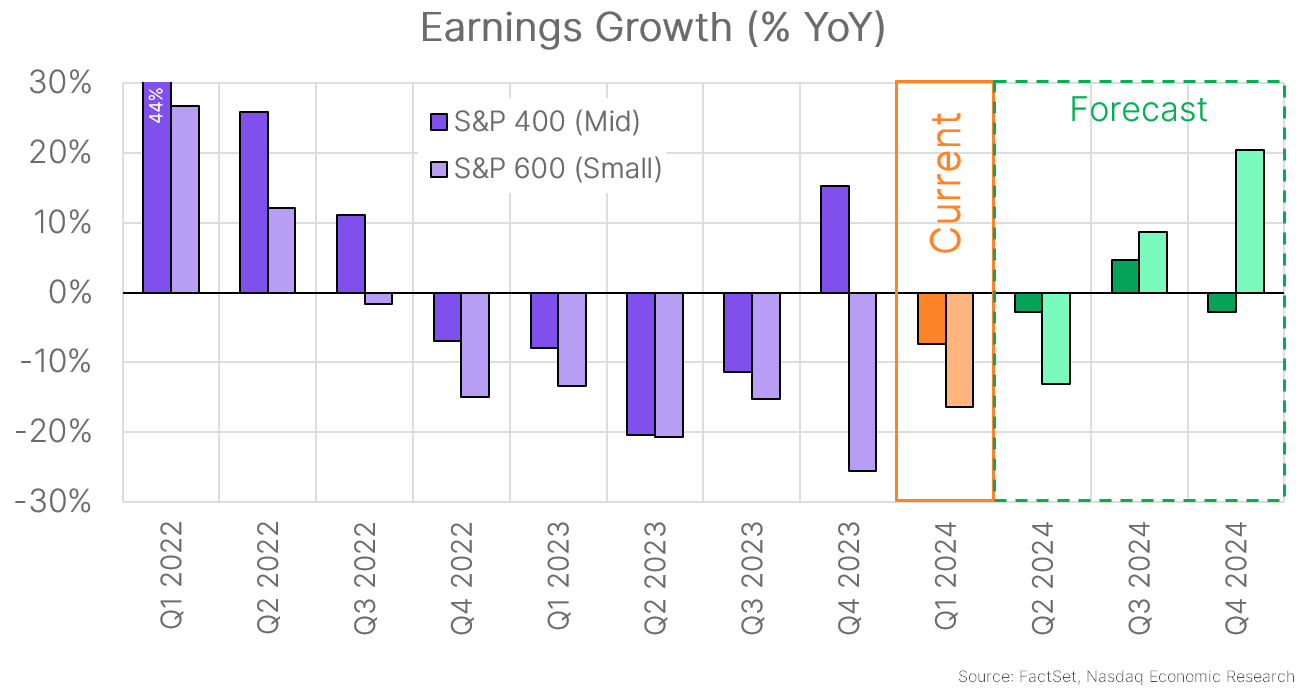
S&P 500 earnings grew +6% YoY in Q1 (chart below, orange bar) – the strongest growth in nearly two years.
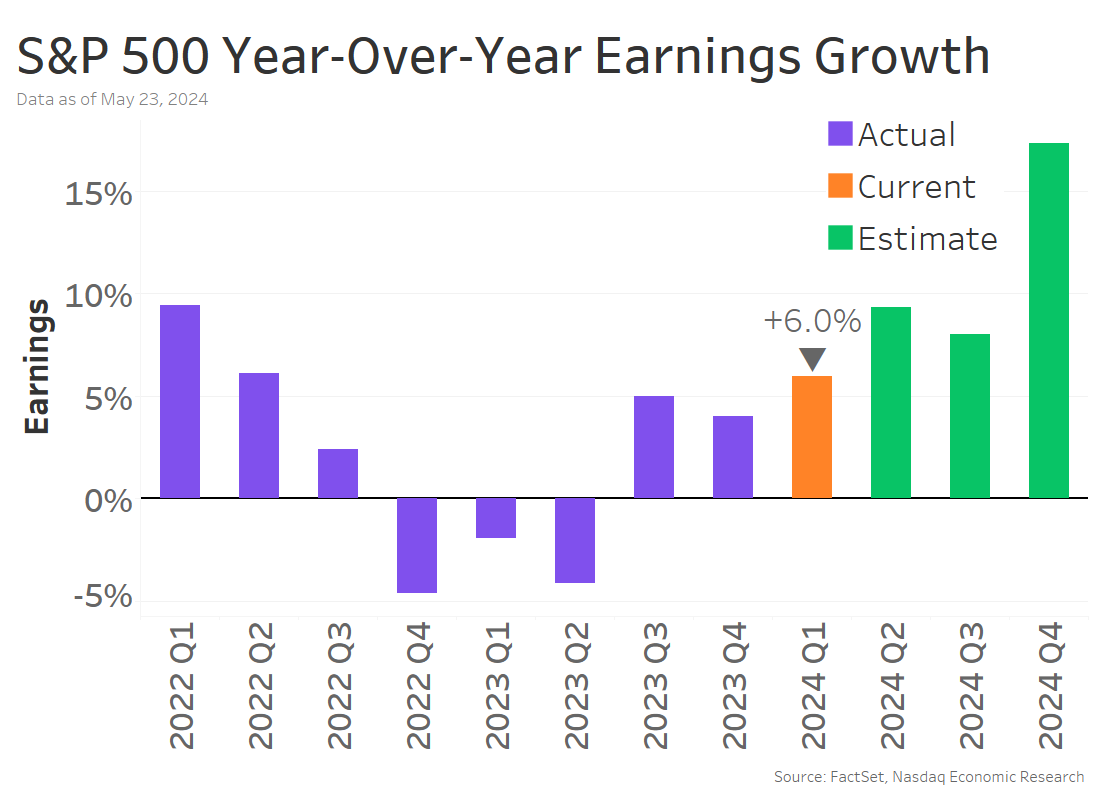
But, as we showed a month ago, earnings were top heavy. Earnings for the AI-related “Fab Five” (Amazon, Google, Meta, Microsoft, and Nvidia) grew +85% YoY, while earnings actually fell 2% YoY for the rest of the S&P 500.
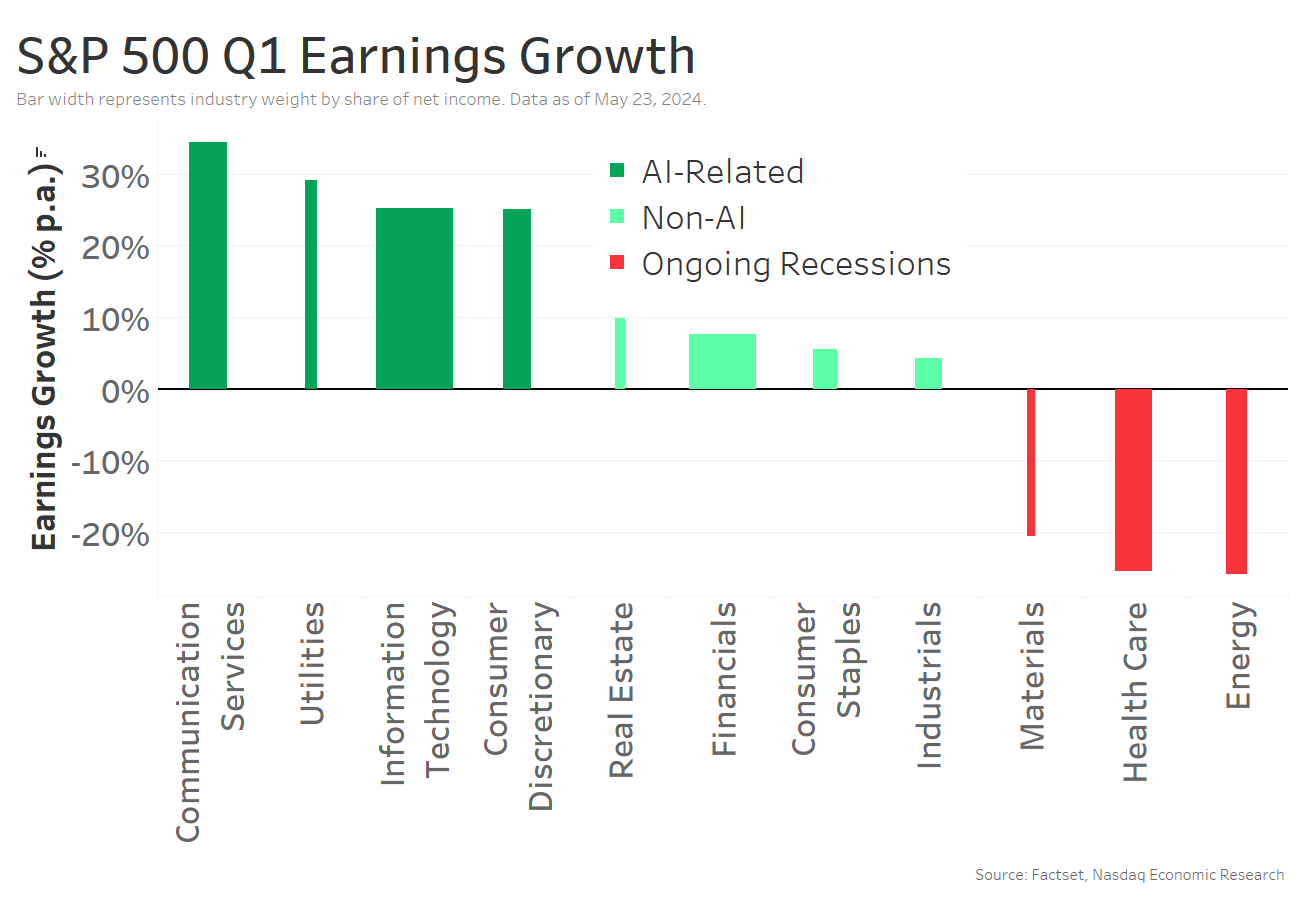
3 buckets of sector earnings: AI-related, ongoing earnings recessions, and everyone else
At the sector level, the divide wasn’t quite so stark. Instead they fell into three buckets: AI-related sectors, those still in earnings recessions, and everyone else (chart below).
Utilities benefitting from AI and relatively low valuations
Some may be wondering why Utilities is an AI-related sector. That’s because AI requires lots of computing power (a ChatGPT query takes 10x the energy of a Google search), which means big data centers that draw lots of power.
So, after two decades of flat electricity demand in the US, the rise of AI is creating demand for new energy infrastructure, and Utilities companies are benefitting.
In fact, since the start of earnings season, Utilities has actually seen the highest price gains (chart below, black line) over the other AI-related sectors.
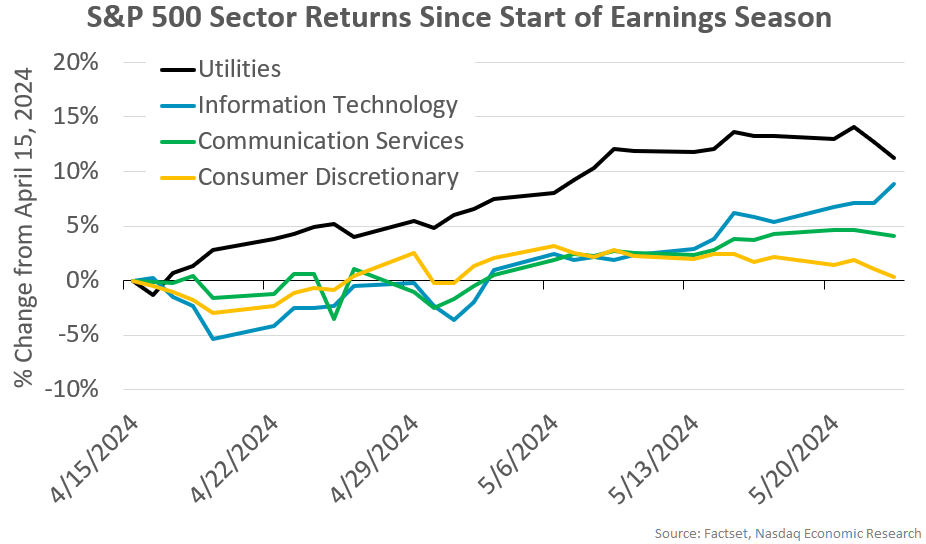
In part, that has to do with Utilities valuations being roughly 10% to 40% lower than the other AI-related sectors. So investors can get exposure to AI, without paying as much for future earnings.
Floating rate debt exposure, manufacturing tilt, and worse pricing power explains small cap recession
Looking at smaller companies, the earnings recession we highlighted previously for small caps continued. Small cap earnings fell 17% YoY (chart below, light orange bar).
There are a few reasons for this.
Manufacturing revival and (slowly) falling rates to boost small caps
The good news for small caps is that a nascent manufacturing revival is underway – as confirmed by the May manufacturing PMI, which stayed in expansion for the 5th straight month. So that sector tilt should become a boost to small caps.
And, eventually, the Fed will start cutting rates (I promise!), starting to ease the rate burden on small caps.
That helps explain why small cap earnings are expected to increase +20% YoY in Q4 2024 (chart above, rightmost light green bar) – even above the +17% YoY projected for large caps (first chart, rightmost bar)! So hopefully the worst is behind them for small caps.
Howard Marks, an American investor and co-founder of Oaktree Capital Management famously described the pendulum effect in markets, and Robert Kirby, an investment advisor in the late 1990s, gave one of the better interpretations:
“Long ago, I began to look at the stock market as a kind of pendulum swinging back and forth with no discernible pattern or rhythm. It swings between three o’clock on one side and nine o’clock on the other. At three o’clock, fear takes over and it’s full panic. At nine o’clock, greed takes over and it’s full manic. At six o’clock there’s a point where logic and balance exist and where valuations make a lot of sense to most rational people. Unfortunately, the pendulum doesn’t spend much time at six o’clock.”
While investor sentiment has digressed from euphoric levels, as previously discussed here, we have seen a slew of constructive technical developments recently…the latest being a key breakout in the copper-gold ratio.
The copper-gold ratio (orange line in the image below) simply takes the price of copper, divides it by the price of gold, and plots the reading daily – very similar to our relative strength Point & Figure charts. When the ratio is rising that means copper is outperforming gold and when the ratio is falling that means gold is outperforming copper.

What is the significance? Gold is considered a safe haven for investors, and with far less industrial/economic use, its role as a store of value is further emphasized. Rising gold prices have often signaled economic contraction and/or investor fear. Conversely, copper is a key industrial metal with countless economic applications, especially in building construction and electronics. Thus, copper tends to perform well when the economy is strong or expected to be strong.
The grey line on the chart above is the US Treasury 10YR Yield (TNX). As we can see, interest rates tend to run parallel with the copper-gold ratio. Intuitively this makes sense because rising interest rates typically come during economic expansions and falling interest rates are often characteristic of accommodative monetary action taken during times of economic hardship.
Notice today that the copper-gold ratio has recently climbed out of a visible trough and interest rates have generally trended upwards too – this adds credibility to the deferral of rate cuts and higher for longer narrative. This could also provide tangential support that investors want to see a soft landing more than they want to see rate cuts.
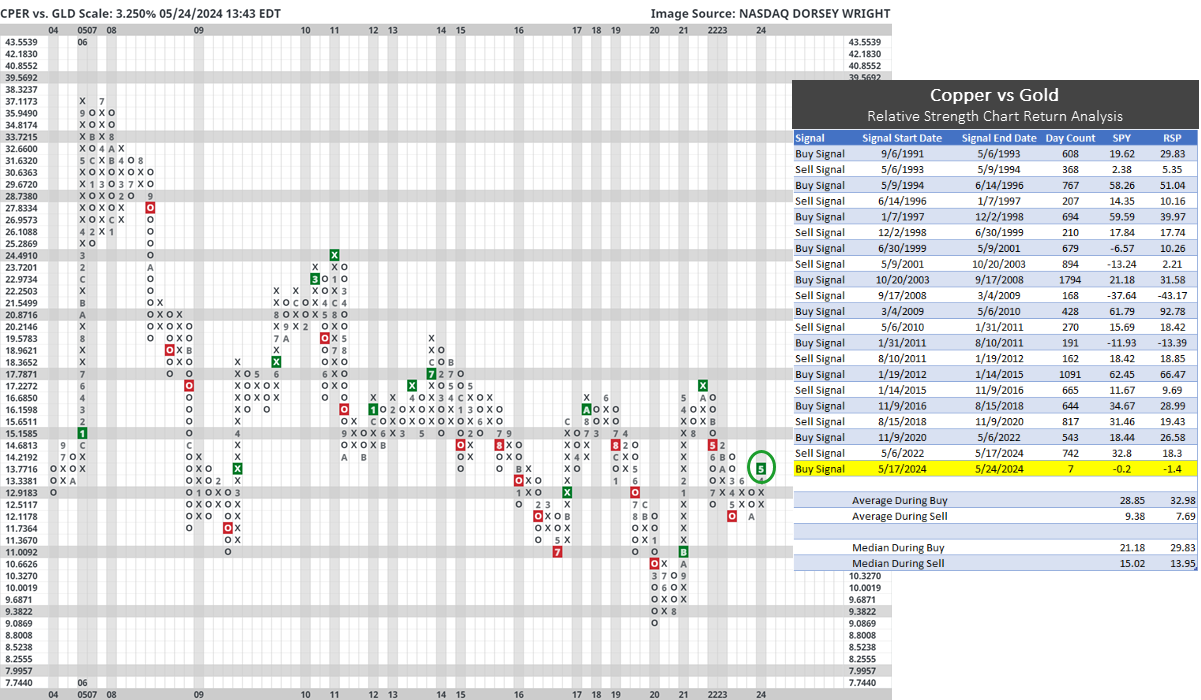
As it relates to equities, consider the image above. We constructed a relative strength chart between the United States Copper Index Fund (CPER) and the SPDR Gold Trust (GLD) on a 3.25% scale, which simply means that each column change (into either Xs or Os) requires about 10% of outperformance. When this chart is in Xs CPER is outperforming and when the chart is in Os GLD is outperforming. The buy/sell signals (green and red boxes, respectively) are objective long-term indications of relative price strength while the columns Xs/Os indicate shorter-term trends of relative price strength. Notice that CPER returned to a relative strength buy signal against GLD earlier this week! (The highlighted row is ongoing, and not projected to end today.)
We computed performance for the S&P 500 via cap weight ETF (SPY) and equal weight ETF (RSP). Note that before ETF inception we used underlying index data. While CPER was on a relative strength buy signal against GLD (green box on the chart) SPY generated an average return of 29% and a median return of 21%. When CPER was on a relative strength sell signal against GLD (red box on the chart) SPY generated an average return of 9% and median return of 15% - which is not bad, but materially lower than when on a buy signal. We observe similar performance patterns for RSP.
Point being – the recent buy signal in favor of CPER has historically been a good sign for stocks. In fact, the worst return SPY has experienced (between signal changes, not necessarily drawdown, since the early 1990s) was when CPER was on a buy signal with a 12% decline in 2011…which is pretty tame.
There will never be an “all clear” signal when investing and no two markets are the same. After all, there were plenty of periods in the table above where equities continued to perform well amidst relatively weak copper prices. For instance, the S&P 500 just gained 30% while CPER was on a sell signal against GLD.
Another thing to note today is that copper prices are in steep backwardation, as recently discussed here, along with the term structure of interest rates. Said differently, investors expect copper prices and interest rates to be lower in the future which is potentially a big qualifier to the copper-gold ratio and its implications.
That said, most investment advisors should work off probabilities instead of precision. Markets are unpredictable. Things can change in a flash. The ability to be precise, repeatedly, is improbable. So, given the weight of market history, the recent copper-gold development should probably be chalked up as a net positive.

| Symbol | Name | Price | Yield | PnF Trend | RS Signal | RS Col. | Fund Score | 200 Day MA | Weekly Mom |
|---|---|---|---|---|---|---|---|---|---|
| DIA | SPDR Dow Jones Industrial Average ETF Trust | 390.66 | 1.82 | Positive | Sell | X | 3.73 | 367.07 | + 2W |
| EEM | iShares MSCI Emerging Markets ETF | 42.90 | 2.58 | Positive | Sell | O | 3.30 | 39.62 | + 4W |
| EFA | iShares MSCI EAFE ETF | 80.39 | 2.91 | Positive | Sell | X | 4.05 | 74.05 | + 2W |
| FM | iShares Frontier and Select EM ETF | 28.34 | 3.44 | Positive | Sell | O | 3.42 | 26.81 | + 1W |
| IJH | iShares S&P MidCap 400 Index Fund | 59.02 | 1.37 | Positive | Buy | O | 4.59 | 54.26 | + 2W |
| IJR | iShares S&P SmallCap 600 Index Fund | 107.81 | 1.36 | Positive | Sell | O | 3.02 | 101.77 | + 2W |
| QQQ | Invesco QQQ Trust | 453.66 | 0.62 | Positive | Buy | X | 5.69 | 403.65 | + 2W |
| RSP | Invesco S&P 500 Equal Weight ETF | 164.85 | 1.59 | Positive | Sell | O | 3.05 | 154.01 | + 2W |
| SPY | SPDR S&P 500 ETF Trust | 525.96 | 1.34 | Positive | Sell | X | 4.30 | 474.16 | + 2W |
| XLG | Invesco S&P 500 Top 50 ETF | 43.17 | 0.88 | Positive | Buy | X | 5.71 | 38.13 | + 2W |
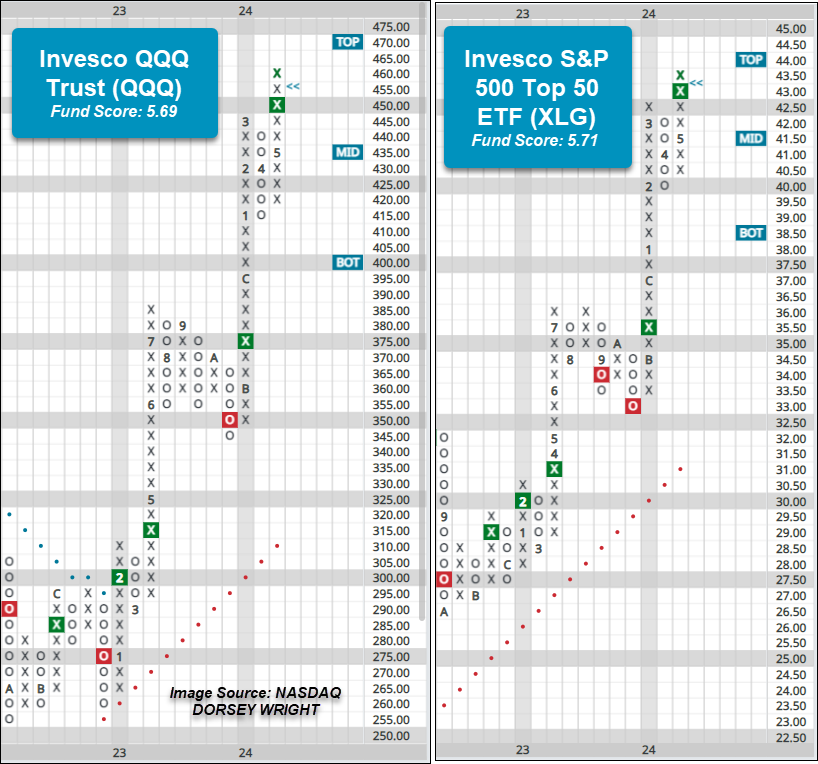
Though most equity indices were negative for the week, the Invesco QQQ Trust QQQ and Invesco S&P 500 Top 50 ETF XLG bucked the fad and were at least somewhat in the black through Thursday, up 42 and 12 basis points. These two funds were able to improve on their current chart position during Friday’s intraday action as each marked a new all-time chart high. This follows the funds – along with most equity indices – giving buy signals during last week’s trading. QQQ and XLG possess strong fund scores above 5 and positive score directions, highlighting the near-term improvement. Both ETFs reside in actionable territory, but are on the verge of moving into highly overbought territory. Those seeking to execute larger positions may look to add on a pullback, with reversals into Os potentially occurring with a move below $445 for the QQQs and below $42 for XLG. Support for the QQQs lies at $415 and $40 for XLG.
Additional Comments:
The past few weeks the Major Market piece has highlighted action within the international equity space, and this week another international fund deserves a shoutout for positive chart action. Following last Friday’s action the iShares Frontier and Select EM ETF FM reversed back into Xs at $28.50 on its default chart. FM possesses a fund score north of 3 and the fund has maintained a buy signal since July 2023. From here, a move above $29 would mark a third consecutive buy signal. Initial support lies at $27, while the bullish support line resides at $25.50.
Average Level
12.47
| < - -100 | -100 - -80 | -80 - -60 | -60 - -40 | -40 - -20 | -20 - 0 | 0 - 20 | 20 - 40 | 40 - 60 | 60 - 80 | 80 - 100 | 100 - > |
|---|---|---|---|---|---|---|---|---|---|---|---|
|
Sell signalicf
|
|||||||||||
|
Buy signalshy
|
|||||||||||
|
Buy signalief
|
|||||||||||
|
Buy signalgsg
|
Sell signaliwm
|
||||||||||
|
Buy signalhyg
|
Buy signalVOOV
|
||||||||||
|
Sell signallqd
|
Buy signalijr
|
Buy signalQQQ
|
|||||||||
|
Buy signaltlt
|
Buy signaldia
|
Buy signalgld
|
Buy signaloneq
|
||||||||
|
Buy signalagg
|
Buy signaldx/y
|
Buy signalefa
|
Buy signalvoog
|
||||||||
|
Buy signalIJH
|
Sell signalfxe
|
Buy signalspy
|
Buy signalXLG
|
||||||||
|
Buy signalUSO
|
Buy signalrsp
|
Buy signaldvy
|
Buy signalgcc
|
Buy signaleem
|
|||||||
| < - -100 | -100 - -80 | -80 - -60 | -60 - -40 | -40 - -20 | -20 - 0 | 0 - 20 | 20 - 40 | 40 - 60 | 60 - 80 | 80 - 100 | 100 - > |
| AGG | iShares US Core Bond ETF |
| USO | United States Oil Fund |
| DIA | SPDR Dow Jones Industrial Average ETF |
| DVY | iShares Dow Jones Select Dividend Index ETF |
| DX/Y | NYCE U.S.Dollar Index Spot |
| EFA | iShares MSCI EAFE ETF |
| FXE | Invesco CurrencyShares Euro Trust |
| GLD | SPDR Gold Trust |
| GSG | iShares S&P GSCI Commodity-Indexed Trust |
| HYG | iShares iBoxx $ High Yield Corporate Bond ETF |
| ICF | iShares Cohen & Steers Realty ETF |
| IEF | iShares Barclays 7-10 Yr. Tres. Bond ETF |
| LQD | iShares iBoxx $ Investment Grade Corp. Bond ETF |
| IJH | iShares S&P 400 MidCap Index Fund |
| ONEQ | Fidelity Nasdaq Composite Index Track |
| QQQ | Invesco QQQ Trust |
| RSP | Invesco S&P 500 Equal Weight ETF |
| IWM | iShares Russell 2000 Index ETF |
| SHY | iShares Barclays 1-3 Year Tres. Bond ETF |
| IJR | iShares S&P 600 SmallCap Index Fund |
| SPY | SPDR S&P 500 Index ETF Trust |
| TLT | iShares Barclays 20+ Year Treasury Bond ETF |
| GCC | WisdomTree Continuous Commodity Index Fund |
| VOOG | Vanguard S&P 500 Growth ETF |
| VOOV | Vanguard S&P 500 Value ETF |
| EEM | iShares MSCI Emerging Markets ETF |
| XLG | Invesco S&P 500 Top 50 ETF |

| Symbol | Company | Sector | Current Price | Action Price | Target | Stop | Notes |
|---|---|---|---|---|---|---|---|
| KRG | Kite Realty Group Trust | Real Estate | $21.00 | 19 - 21 | 34.50 | 16 | 5 for 5'er, 11 of 113 in REAL sector matrix, LT pos mkt RS, spread quintuple top, 4.65% yield |
| OEC | Orion SA | Chemicals | $24.40 | 22 - 24 | 45.50 | 19 | 4 for 5'er, top third of CHEM sector matrix, LT pos mkt RS, spread quad top, R-R>5 |
| CCEP | Coca-Cola Europacific Partners PLC | Food Beverages/Soap | $72.94 | 60s | 97 | 56 | 5 for 5'er, top 25% of FOOD sector matrix, spread quad top, R-R~3.0, 3% yield |
| CXT | Crane NXT Co. | Electronics | $60.96 | hi 50s - low 60s | 76 | 48 | Top half of MACH sector matrix, bullish catapult |
| MMC | Marsh & McLennan Companies, Inc. | Insurance | $207.99 | 190s - low 200s | 234 | 180 | 5 for 5'er, favored INSU sector, LT pos mkt RS, quad top breakout, 1.4% yield |
| RPM | RPM, Inc. | Chemicals | $111.96 | mid 100s - hi 110s | 159 | 91 | 5 TA rating, LT RS buy, consec. buy signals, top 50% of CHEM sector matrix, buy-on-pullback, R-R > 2, Earn. 5/22 |
| BAH | Booz Allen Hamilton Holding | Business Products | $152.36 | 140s | 193 | 114 | 5 for 5'er, top 25% of favored BUSI sector matrix, LT pos peer RS, pullback from ATH, 1.5% yield, Earn. 5/24 |
| GBX | The Greenbrier Companies, Inc. | Transports/Non Air | $50.14 | hi 40s - low 50s | 87 | 43 | 5 for 5'er, top 20% of favored TRAN sector matrix, pullback from multi-year high, R-R>4.0, 2.3% yield |
| JPM | J.P. Morgan Chase & Co. | Banks | $196.92 | lo 180s - hi 190s | 258 | 148 | 5 TA rating, RS buy, top 10% of BANK sector matrix, consec. buy signals |
| WSM | Williams-Sonoma, Inc. | Retailing | $284.56 | 280s - 290s | 362 | 232 | 5 for 5'er, #2 of 84 in RETA sector matrix, multi buy signals, pullback from ATH, 1.6% yield |
| ORCL | Oracle Corporation | Software | $124.09 | 110s - low 120s | 150 | 99 | 4 for 5'er, top half of SOFT sector matrix. LT pos mkt RS, spread triple top, pullback from ATH, 1.4% yield, Earn. 6/18 |
| AMP | Ameriprise Financial | Wall Street | $434.15 | 390s - 410s | 532 | 368 | 5 for 5'er, top half of FINA sector matrix, LT pos peer & mkt RS, triple top, pullback from ATH, 1.4% yield |
| LIN | Linde Plc | Chemicals | $432.30 | hi 410s - lo 460s | 572 | 360 | 5 TA rating, consec. buy signals, LT RS buy, buy-on-pullback |
| OMF | OneMain Holdings Inc. | Finance | $47.89 | hi 40s - low 50s | 81 | 43 | 5 for 5'er, top half of FINA sector matrix, LT pos mkt RS, multiple buy signals, R-R>3.0, 7.9% yield |
| DHI | D.R. Horton, Inc. | Building | $142.82 | mid 140s - 150s | 178 | 134 | 5 for 5'er, favored BUIL sector, LT pos peer RS, bearish signal reversal |
| LPLA | LPL Investment Holdings Inc | Finance | $274.49 | hi 250s - lo 280s | 348 | 228 | 4 TA rating, top half FINA sector matrix, LT RS buy, consec. buy signals, recent pos. wkly. mom. |
| HLI | Houlihan Lokey Inc | Banks | $134.08 | 120s - low 130s | 177 | 110 | 5 for 5'er, 14 of 122 in BANK sector matrix, LT pos mkt RS, spread triple top, R-R>2.0, 1.6% yield |
| WDC | Western Digital Corporation | Computers | $74.16 | hi 60s - low 70s | 84 | 58 | 5 for 5'er, #2 of 42 in COMP sector matrix, triple top breakout |
| HCA | HCA Healthcare Inc. | Healthcare | $315.32 | 304 - mid 330s | 400 | 260 | 5 TA rating, top third of HEAL sector matrix, consec. buy signals, LT RS buy |
| FSS | Federal Signal Corporation | Autos and Parts | $86.26 | 80s | 111 | 71 | 5 for 5'er, LT pos mkt & peer RS, triple top |
| BAP | Credicorp Limited (Peru) | Banks | $163.13 | 164 - hi 170s | 214 | 144 | 5 TA rating, top 33% of BANK sector matrix, LT RS buy, pos. wkly. mom., buy-on-pullback |
| AFL | AFLAC Incorporated | Insurance | $86.78 | 80s | 103 | 75 | 5 for 5'er, favored INSU sector matrix, spread triple top, 2.3% yield |
| EVR | Evercore Inc. | Finance | $200.09 | hi 180s - low 200s | 262 | 166 | 5 for 5'er, top 20% of FINA sector matrix, spread quad top, 1.6% yield |
| LLY | Eli Lilly and Company | Drugs | $808.45 | hi 760s - low 800s | 944 | 704 | 5 for 5'er, top 20% of DRUG sector matrix, LT pos mkt RS, bullish triangle |
| ARES | Ares Management Corp | Finance | $144.75 | mid 130s - mid 140s | 200 | 124 | 5 for 5'er, top 20% of FINA sector matrix, LT pos mkt RS, spread triple top, R-R~3.0 |
| ETN | Eaton Corporation | Machinery and Tools | $338.42 | 324 to 348 | 392 | 300 | ATH at $344 after 3rd buy signal. 5 for 5'er that ranks 3rd in Machinery and Tools matrix. R-R > 3. 1.1% yield. |
| ARMK | Aramark | Food Beverages/Soap | $31.61 | low 30s | 54 | 26 | 4 for 5'er, top third of FOOD sector matrix, LT pos mkt RS, spread triple top, R-R>3.0 |
| Symbol | Company | Sector | Current Price | Action Price | Target | Stop | Notes |
|---|---|---|---|---|---|---|---|
| MTCH | Match Group, Inc. | Internet | $29.48 | (mid 30s) | 26 | 40 | 0 for 5'er, bottom half of INET sector matrix, LT neg trend & RS |
| Symbol | Company | Sector | Current Price | Action Price | Target | Stop | Notes |
|---|---|---|---|---|---|---|---|
| CI | CIGNA Group/The | Insurance | $337.83 | 332 - lo 360s | 428 | 288 | CI fell to a sell signal on Friday. OK to hold here. Maintain $288 stop. |
| Comment | |||||||
|---|---|---|---|---|---|---|---|
|
|
|||||||
ARMK Aramark R ($31.99) - Food Beverages/Soap - ARMK is a 4 for 5'er that ranks in the top third of the food beverages/soap sector matrix and has been on a market RS buy signal since 2020. On its default chart, the stock has give three consecutive buy signals, most recently breaking a spread triple top earlier this month that took out resistance dating back to January 2023. Long exposure may be added in the low $30s and we will set our initial stop at $26, the potential trend line violation on ARMK's default chart. We will use the bullish price objective, $54, as our target price, giving us a reward-to-risk ratio north of 3.0. ARMK also carries a 1.2% yield.
| 20 | 21 | 22 | 23 | 24 | ||||||||||||||||||||||||||||||||||||||||||||||||
| 34.00 | X | • | X | 34.00 | ||||||||||||||||||||||||||||||||||||||||||||||||
| 33.00 | 1 | O | • | X | X | X | 33.00 | |||||||||||||||||||||||||||||||||||||||||||||
| 32.00 | A | O | • | 1 | O | 3 | O | X | Mid | 32.00 | ||||||||||||||||||||||||||||||||||||||||||
| 31.00 | 9 | 2 | • | X | C | O | X | X | O | X | 31.00 | |||||||||||||||||||||||||||||||||||||||||
| 30.00 | X | O | • | 3 | O | X | 2 | X | O | 2 | 5 | 30.00 | ||||||||||||||||||||||||||||||||||||||||
| 29.00 | X | O | • | X | O | • | X | O | 6 | O | 1 | 29.00 | ||||||||||||||||||||||||||||||||||||||||
| 28.00 | X | O | • | 1 | 2 | O | B | 4 | • | • | X | O | X | 8 | B | Bot | 28.00 | |||||||||||||||||||||||||||||||||||
| 27.00 | 8 | O | • | X | O | X | O | X | O | 1 | 2 | X | O | X | • | B | O | 5 | O | X | 27.00 | |||||||||||||||||||||||||||||||
| 26.00 | X | O | • | X | O | X | 6 | A | O | X | O | X | O | X | O | X | O | A | 3 | X | 9 | X | • | 26.00 | ||||||||||||||||||||||||||||
| 25.00 | X | O | • | X | O | 7 | X | O | X | O | X | O | X | 5 | 8 | O | X | O | X | O | X | • | 25.00 | |||||||||||||||||||||||||||||
| 24.00 | X | 3 | • | • | X | O | X | C | O | 3 | • | O | 7 | 9 | X | O | • | A | • | 24.00 | ||||||||||||||||||||||||||||||||
| 23.00 | X | O | • | X | • | X | 9 | • | O | X | O | • | • | • | 23.00 | |||||||||||||||||||||||||||||||||||||
| 22.00 | X | O | • | X | O | • | B | • | 6 | X | • | 22.00 | ||||||||||||||||||||||||||||||||||||||||
| 21.00 | X | O | • | X | X | O | • | X | X | • | O | • | 21.00 | |||||||||||||||||||||||||||||||||||||||
| 20.00 | X | O | X | X | • | X | O | 6 | O | • | X | O | A | • | • | 20.00 | ||||||||||||||||||||||||||||||||||||
| 19.50 | X | O | X | O | X | O | X | X | O | X | O | • | • | X | O | X | • | 19.50 | ||||||||||||||||||||||||||||||||||
| 19.00 | X | O | X | O | X | O | X | O | X | O | X | O | X | X | • | X | 9 | X | • | 19.00 | ||||||||||||||||||||||||||||||||
| 18.50 | • | O | X | X | O | X | 5 | X | O | X | O | O | X | O | X | O | X | O | X | • | 18.50 | |||||||||||||||||||||||||||||||
| 18.00 | O | X | O | X | O | X | O | X | O | X | O | X | O | X | O | X | O | • | 18.00 | |||||||||||||||||||||||||||||||||
| 17.50 | O | X | O | X | X | O | X | O | X | O | O | X | O | X | O | X | • | 17.50 | ||||||||||||||||||||||||||||||||||
| 17.00 | O | X | O | X | O | X | O | X | O | X | O | O | X | X | O | • | 17.00 | |||||||||||||||||||||||||||||||||||
| 16.50 | O | X | O | X | X | O | X | O | X | O | X | O | X | O | X | • | 16.50 | |||||||||||||||||||||||||||||||||||
| 16.00 | O | X | O | X | O | X | O | X | O | X | X | O | X | O | X | O | X | • | 16.00 | |||||||||||||||||||||||||||||||||
| 15.50 | O | X | O | X | O | X | O | X | O | X | O | X | O | O | X | O | X | • | 15.50 | |||||||||||||||||||||||||||||||||
| 15.00 | O | X | O | X | O | X | O | X | O | X | O | X | • | 7 | 8 | • | 15.00 | |||||||||||||||||||||||||||||||||||
| 14.50 | O | X | O | X | O | X | O | X | O | O | • | • | 14.50 | |||||||||||||||||||||||||||||||||||||||
| 14.00 | O | O | X | O | X | 4 | X | • | 14.00 | |||||||||||||||||||||||||||||||||||||||||||
| 13.50 | O | X | O | X | O | X | • | 13.50 | ||||||||||||||||||||||||||||||||||||||||||||
| 13.00 | O | X | O | X | O | X | • | 13.00 | ||||||||||||||||||||||||||||||||||||||||||||
| 12.50 | O | X | O | X | O | X | • | 12.50 | ||||||||||||||||||||||||||||||||||||||||||||
| 12.00 | O | X | O | X | O | • | 12.00 | |||||||||||||||||||||||||||||||||||||||||||||
| 11.50 | O | X | O | • | 11.50 | |||||||||||||||||||||||||||||||||||||||||||||||
| 11.00 | O | X | • | 11.00 | ||||||||||||||||||||||||||||||||||||||||||||||||
| 10.50 | O | X | • | 10.50 | ||||||||||||||||||||||||||||||||||||||||||||||||
| 10.00 | O | X | • | 10.00 | ||||||||||||||||||||||||||||||||||||||||||||||||
| 9.50 | O | X | • | 9.50 | ||||||||||||||||||||||||||||||||||||||||||||||||
| 9.00 | O | X | • | 9.00 | ||||||||||||||||||||||||||||||||||||||||||||||||
| 8.50 | O | X | • | 8.50 | ||||||||||||||||||||||||||||||||||||||||||||||||
| 8.00 | O | X | • | 8.00 | ||||||||||||||||||||||||||||||||||||||||||||||||
| 7.50 | O | X | • | 7.50 | ||||||||||||||||||||||||||||||||||||||||||||||||
| 7.00 | O | • | 7.00 | |||||||||||||||||||||||||||||||||||||||||||||||||
| 20 | 21 | 22 | 23 | 24 |
| CAVA CAVA Group, Inc. ($83.17) - Restaurants - CAVA broke a double top at $82 for a fifth consecutive buy signal as the stock rallied to a new chart high at $84. CAVA is a 5 for 5'er that could be considering the upper $70 to lower $80 range. Initial support liesin the mid to low $70s, while longer-term support lies at $67. |
| SPB Spectrum Brands Holdings ($91.83) - Food Beverages/Soap - Shares of SPB printed their first sell signal since March on Friday, at $91. That said, the stock remains a healthy 5 for 5'er at this time and ranks in the upper quartile of the food beverages/soap stock sector matrix. Strong support is offered at around $78. |
| Name | Option Symbol | Action | Stop Loss |
|---|---|---|---|
| Amazon.com Inc. - $180.44 | O: 24I180.00D20 | Buy the September 180.00 calls at 13.45 | 164.00 |
| Name | Option | Action |
|---|---|---|
| The TJX Companies, Inc. ( TJX) | Jul. 95.00 Calls | Raise the option stop loss to 6.05 (CP: 8.05) |
| Automatic Data Processing, Inc. ( ADP) | Aug. 250.00 Calls | Stopped at 9.70 (CP: 8.20) |
| General Electric Company ( GE) | Sep. 160.00 Calls | Initiate an option stop loss of 11.80 (CP: 54.00) |
| Name | Option Symbol | Action | Stop Loss |
|---|---|---|---|
| Cenovus Energy Inc. - $20.29 | O: 24U21.00D20 | Buy the September 21.00 puts at 1.55 | 23.00 |
| Name | Option | Action |
|---|---|---|
| eBay Inc. ( EBAY) | Jul. 50.00 Puts | Stopped at 54.00 (CP: 54.32) |
| Snowflake, Inc. Class A ( SNOW) | Aug. 160.00 Puts | Stopped at 12.10 (CP: 11.90) |
| American Electric Power Company, Inc. ( AEP) | Aug. 92.50 Puts | Raise the option stop loss to 2.60 (CP: 4.60) |
| BILL Holdings Inc. ( BILL) | Sep. 60.00 Puts | Raise the option stop loss to 8.50 (CP: 10.50) |
| Name | Option Sym. | Call to Sell | Call Price | Investment for 500 Shares | Annual Called Rtn. | Annual Static Rtn. | Downside Protection |
|---|---|---|---|---|---|---|---|
| Freeport-McMoRan Inc. $ 51.20 | O: 24I55.00D20 | Sep. 55.00 | 3.00 | $ 24,465.85 | 34.94% | 15.40% | 4.78% |
| Name | Action |
|---|---|
| United Airlines Holdings Inc. ( UAL) - 51.76 | Sell the August 55.00 Calls. |
| Palantir Technologies Inc. Class A ( PLTR) - 20.72 | Sell the August 23.00 Calls. |
| Palantir Technologies Inc. Class A ( PLTR) - 20.72 | Sell the August 22.00 Calls. |
| Bath & Body Works Inc. ( BBWI) - 48.31 | Sell the August 50.00 Calls. |
| Micron Technology, Inc. ( MU) - 126.27 | Sell the August 135.00 Calls. |
| Micron Technology, Inc. ( MU) - 126.27 | Sell the September 130.00 Calls. |
| Comerica Incorporated ( CMA) - 50.24 | Sell the September 52.50 Calls. |
| Name | Covered Write |
|---|---|
|
|
|
Daily Equity & Market Analysis
Loading, Please Wait...
