Copper prices hit a record high this week, not sure they will hang around too long though.
Remember, these are technical comments only. Just as you must be aware of fundamental data for the stocks we recommend based on technical criteria in the report, so too must you be aware of important data regarding delivery, market moving government releases, and other factors that may influence commodity pricing. We try to limit our technical comments to the most actively traded contracts in advance of delivery, but some contracts trade actively right up to delivery while others taper off well in advance. Be sure you check your dates before trading these contracts. For questions regarding this section or additional coverage of commodities email will.gibson@nasdaq.com.
Data represented in the table below is through 5/14/2024:
Broad Market Commodities Report
Portfolio View - Commodity Indices
| Symbol | Name | Price | PnF Trend | RS Signal | RS Col. | 200 Day MA | Weekly Mom |
|---|---|---|---|---|---|---|---|
| CL/ | Crude Oil Continuous | 78.02 | Negative | Buy | X | 79.99 | - 4W |
| DBLCIX | Deutsche Bank Liquid Commodities Index | 486.42 | Positive | Sell | O | 487.42 | - 3W |
| DWACOMMOD | DWA Continuous Commodity Index | 866.12 | Positive | Buy | O | 815.91 | - 3W |
| GC/ | Gold Continuous | 2353.40 | Positive | Sell | X | 2048.92 | - 3W |
| HG/ | Copper Continuous | 4.95 | Positive | Buy | X | 3.89 | + 14W |
| ZG/ | Corn (Electronic Day Session) Continuous | 467.50 | Negative | Sell | O | 459.70 | + 11W |
Copper has been ripping. For instance, the continuous chart (HG/) took out its all-time high from March 2022 and gained over 16% in the past month alone.
We keep a close eye on copper prices due to their economic implications and correlations with other groups, like Small Caps and Emerging Markets. Furthermore, some may remember this piece that showed large cap domestic equity markets performing better when copper prices rise more than other commodities.
In short, advancing copper prices have historically been a good sign for the economy and markets.
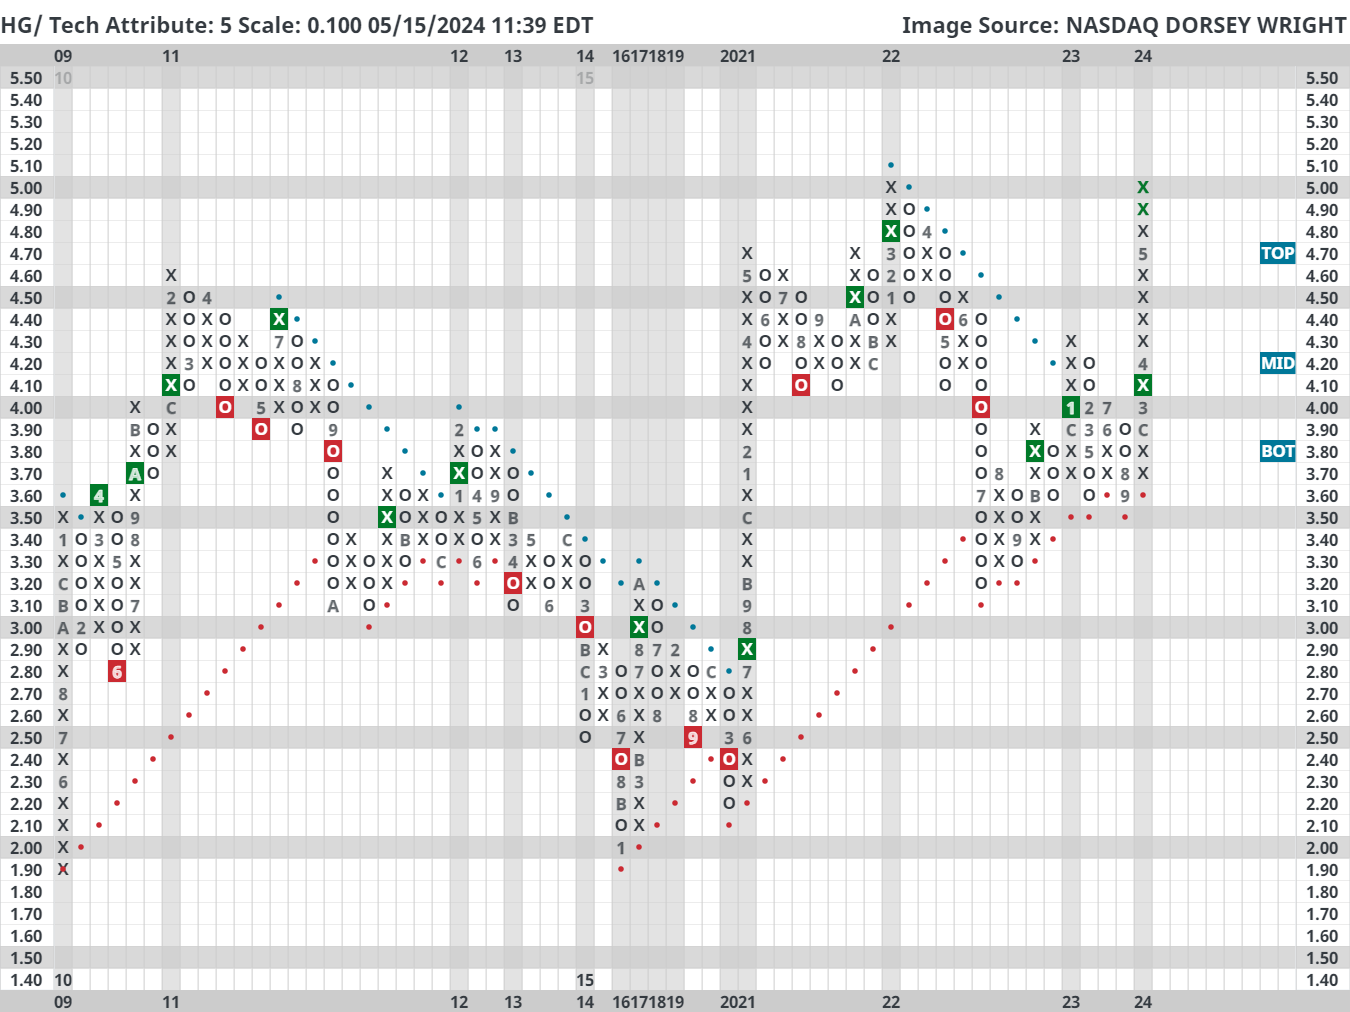
Positive macro implications aside, there are some valid reasons to think the current rally could stall. First, copper is currently sitting at an OBOS (overbought) reading of 155% on our platform which is the highest since April 2006. In other words, the current price is extremely stretched compared to its 50-day moving average.
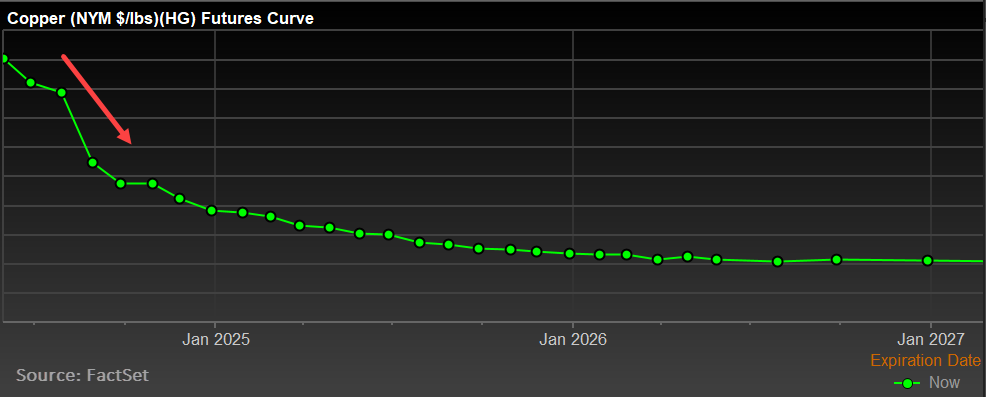
Second, the futures curve is in steep backwardation. In fact, “the spike also pushed the Comex market into its biggest-ever backwardation — indicating tight nearby supply — with July trading nearly 30 cents a pound above the September contract on Wednesday” (Source: Bloomberg).
This degree of backwardation is bearish for prices, at least in the short term, suggesting that demand for copper is lower in the future. That is not a rosy economic implication given the premise and introduction today. That said, things can change rather quickly - so for trend followers, the current direction is clearly up and to the right.