At various points over the last few weeks, we have discussed the recent decline in US equity volatility – the S&P 500 Volatility Index (VIX) has given multiple consecutive sell signals and fallen to its lowest level since 2019.
At various points over the last few weeks, we have discussed the recent decline in US equity volatility – the S&P 500 Volatility Index (VIX) has given multiple consecutive sell signals and fallen to its lowest level since 2019. Historically, when the VIX has dropped to extremely low levels it has often been followed by a spike in volatility. In an extreme example, the VIX hit an all-time low just above 8.5 in late November 2017, then spiked to 14.50 in December. By early January, the market had calmed and the VIX sat around 9, just above its all-time low. Roughly a month later, we experienced one of the largest one-day volatility increases ever when the VIX made a 10 standard deviation jump during “Volmageddon.” Of course, every period of low volatility doesn’t necessarily result in a VIX spike.
One method/indicator for anticipating VIX spikes is looking at the standard deviation of the VIX and the VIX Volatility Index (VVIX). A study that has previously been cited has shown that when the 20-day standard deviation of VIX and VVIX simultaneously drop below the 15th percentile, it has historically been followed by an average increase of 30-45% in the VIX over the next 30 days.
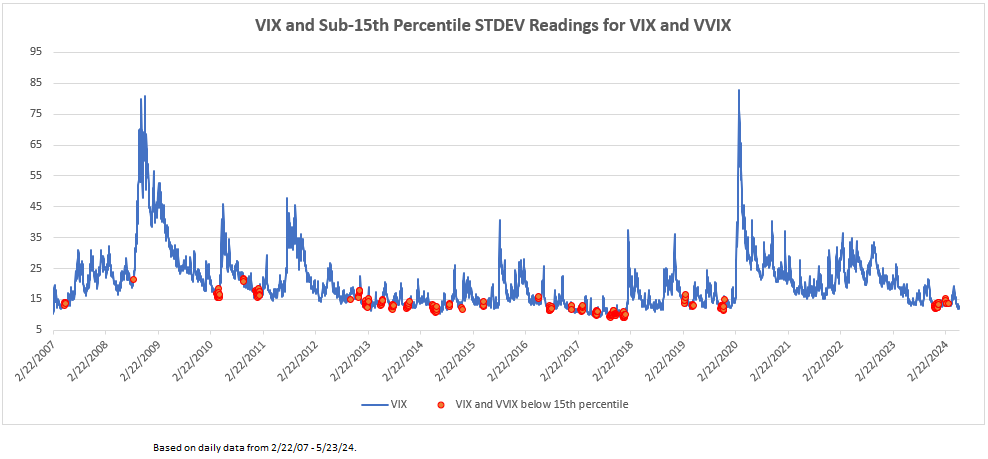
The graph below shows the price history of the VIX since 2007 with periods when the 20-day standard deviation of the VIX and VVIX fell below the 15th percentile indicated in red. We can see that a rise follows most red periods in the VIX – sometimes a relatively moderate rise, as we saw earlier this year – and sometimes by a dramatic spike, like in early 2018. You will also notice that there are red dots at the bottom right edge of the graph. While the VIX currently sits near multi-year lows, there has been enough volatility of volatility to keep this indicator from triggering. There is, of course, no guarantee that we won’t see a volatility spike, but this indicator is signaling that the low volatility we’ve experienced recently could continue, at least for the short term.