
With the start of May, we have also officially moved into the “seasonally weak” half of the year, which lasts from May through October. We are all familiar with the saying "sell in May and go away," which proposes that portfolio growth would do just as well if all holdings were sold as they would be if invested in the market from May through October.
With the start of May, we have also officially moved into the “seasonally weak” half of the year, which lasts from May through October. We are all familiar with the saying "sell in May and go away," which proposes that portfolio growth would do just as well if all holdings were sold as they would be if invested in the market from May through October. Typically, conjecture doesn’t mature into an adage without basis and market seasonality is just such an example as it has shown an impressive trend in terms of magnitude, consistency, and longevity. We’ve discussed seasonality many times over the years and as we switch between seasonally biased periods, we wanted to revisit the subject today.
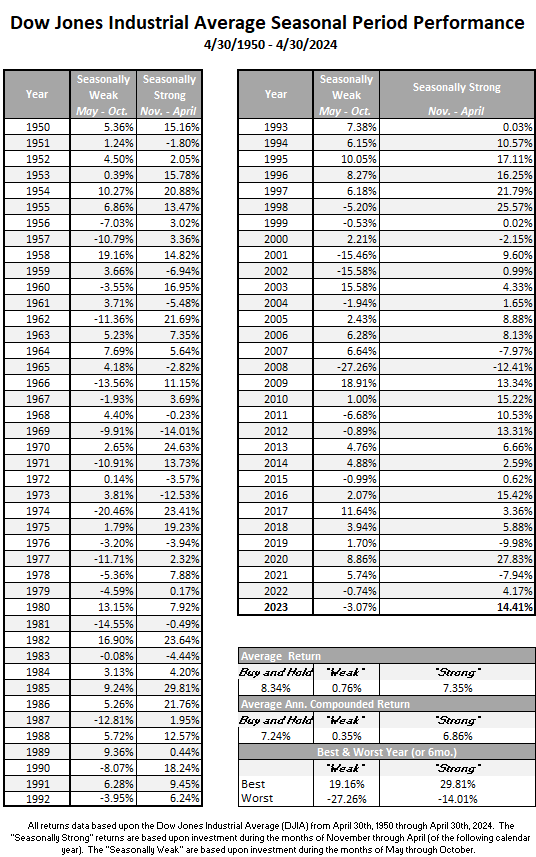
The end of trading on Tuesday, April 30 brought the end of the seasonally strong period, which began with the close of the market on Tuesday, October 31, 2023. Over this period, the Dow Jones Industrial Average (.DJIA) returned 14.41%, which is almost double the historical average return during the seasonally strong period.
Years ago, we began using the Stock Trader's Almanac, a reference tool published by Yale Hirsch that has been a fantastic source of information on the stock market ever since. In fact, we always order several copies for the office each year (if you would like a copy, you can visit www.stocktradersalmanac.com). The premise of the "Market Seasonality" study is that historically speaking, the market performs far better during the November to May period than it does from May to November. On its own, that isn't a particularly profound statement, however, when we examine the magnitude of this effect over the years, its significance becomes clear. Consider this: if you had invested $10,000 in the Dow Jones on April 30 and sold it on October 31 each year since 1950, your cumulative return would be only about $13,497. Meanwhile, the same $10,000, invested only during the seasonally strong six months of the year, would now be worth just almost $1.4 million. Put another way, almost all the growth of the Dow since 1950 has effectively occurred during the "good" six months of the year.
In the graph below, we have reproduced the US Market Seasonality strategy that was first published in the Stock Trader's Almanac beginning in 1950 based upon the Dow Jones Industrial Average. The purple line reflects the seasonally weak period, while the green line shows the seasonally strong six months. You will note that a theoretical $10,000 initial investment in 1950 is barely on the positive side when invested only from May through November. On the other hand, an identical $10,000 initial investment grew to $1,363,575 with an average annualized return of 7.35% if invested only from November through May each year.

*All returns data is based upon the Dow Jones Industrial Average (DJIA) from April 30, 1950 through Aprill 30, 2024. The "Seasonally Strong" returns are based upon investment during the months of November through April (of the following year). The "Seasonally Weak" are based upon investment during the months of May through October. Performance of the switching strategy is the result of back-testing. Back-tested performance results have certain limitations. Such results do not represent the impact of material economic and market factors might have on an investment advisor’s decision-making process if the advisor were actually managing client money. Back-testing performance also differs from actual performance because it is achieved through retroactive application of a model investment methodology designed with the benefit of hindsight. The performance numbers above are pure price returns, not inclusive of dividends or all potential transaction costs. Investors cannot invest directly in an Index. Past performance is not indicative of future results. Potential for profits is accompanied by possibility of loss.
Market Seasonality Notes
- Since April 28, 2000, the Dow has gained a little over 250%. However, the Dow is up less than 13% if we isolate only the seasonally weak periods over the same timeframe.
- During the seasonally weak May to November periods, 29 out of the 74 years examined finished down, while there were only 16 years during which the seasonally strong period produced a negative return.
- The best strong seasonal period came in 1986 as the Dow gained over 29%, while the worst seasonally strong period came in 1970 at a 14% loss.
- The best seasonally weak period came in 1958 at a 19% gain. Only eight of the past 74 weak periods have seen double-digit gains, with the last occurring in 2017.
- The worst seasonally weak stretch came in 2008 when the Dow lost over 27%. There have been eleven seasonally weak periods to lose more than 10%, with 2008 being the last occurrence.
- 2022’s loss during the seasonally weak period ended a six-year streak of positive returns from May through October, tied for the longest streak of positive “weak” periods in our study timeframe (also 1950 – 1956).
- Only seven weak periods have seen back-to-back negative returns, which last occurred from 2022 - 2023. The longest stretch of consecutive losing weak periods was three years from 1977 – 1979.
We acknowledge that this study is not a sophisticated tool for risk management, but it is interesting and does expose biases within the market. As mentioned above, we are coming off a seasonally “strong” period in the market which saw the Dow post a gain of more than 14%, well above the average strong period return of 7.35%. Currently, US equities are on strong footing, as they lead the DALI asset class rankings, followed by international equities and commodities. Meanwhile, technology remains atop the sector rankings. So, although we are now entering what has been the traditionally weak period for the market, this does not guarantee that these trends will reverse to produce a weak equity market over the next six months. It does, however, provide an opportunity to consider seasonal strategies that can position portfolios to take advantage of these historical biases. We will discuss a few such strategies in this report over the next few days.
