Most Requested Symbols

Trend following as a strategy has been around for decades. The basic idea is by buying when price is moving up and selling/hedging when price is moving down, one can outperform a buy and hold strategy. Typically, it is thought of as an equity-based strategy but it has been applied to many other asset classes including Fixed Income.
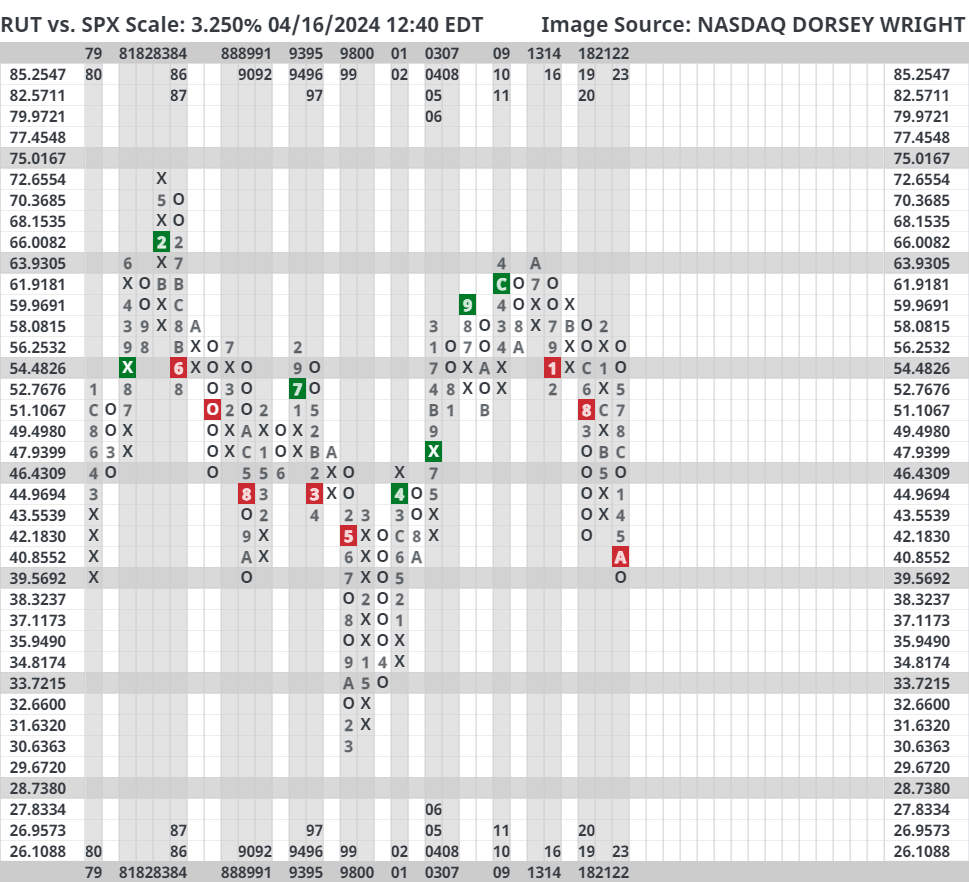
Small caps have been laggards for the last decade when compared to large caps. Since 2014, the Russell 2000 Index ([RUT]) has only beaten the S&P 500 Index ([SPX]) in a calendar year twice, in 2016 and 2020. As it stands today, RUT is looking to mark its fourth consecutive year of underperformance against the SPX which would mean that RUT would have outperformed the SPX only once in the last eight years if this were to hold.
The curve has an average reading of -16.88%.
Today's featured stock is The Cigna Group (CI).
BDX, SKYW, DHI, HIBB, EIX, ROKU, ARCH, SMCI, & SNOW.
Call: American International Group (AIG); Put: Marvell Technology Inc (MRVL); Covered Write: Bath & Body Works (BBWI).
NDW Morning Update Video - April 17, 2024
NDW Morning Update Video – April 17, 2024.
Click here to download MP3
The purpose of the KraneShares Tactical Emerging Markets Model is to identify major themes in emerging markets. The Model is designed to provide overweight exposure toward Chinese equities during periods of strength, while reducing or eliminating exposure toward Chinese equities during periods of weakness.
Last week’s higher-than-expected CPI print on Wednesday was followed by the highest PPI print since April 2023, though the PPI was lower than anticipated. Both garnered the market’s attention as equity and fixed income indices have fallen through the end of last week and on into this week’s action. Following yesterday’s action, the US Treasury 10-Year Yield Index TNX moved above 4.6% (46.00 on the chart) and back into a positive trend after trading in a negative trend since mid-December 2023. This follows a second buy signal on the point and figure chart for TNX earlier this month after returning to a buy signal in mid-February. Before TNX moved back into a positive trend this week, the US Treasury 5-Year Yield Index FVX moved back into a positive trend earlier this month, and this week’s action has brought the US Treasury 30-Year Yield Index TYX to within one box of shifting its trend back to positive. Meanwhile, the iShares US Core Bond ETF AGG gave a second sell signal earlier this month and fell into a negative trend during Monday’s trading. Intraday action Tuesday saw AGG fall to $95 and its most oversold level since the October 2023 chart lows.
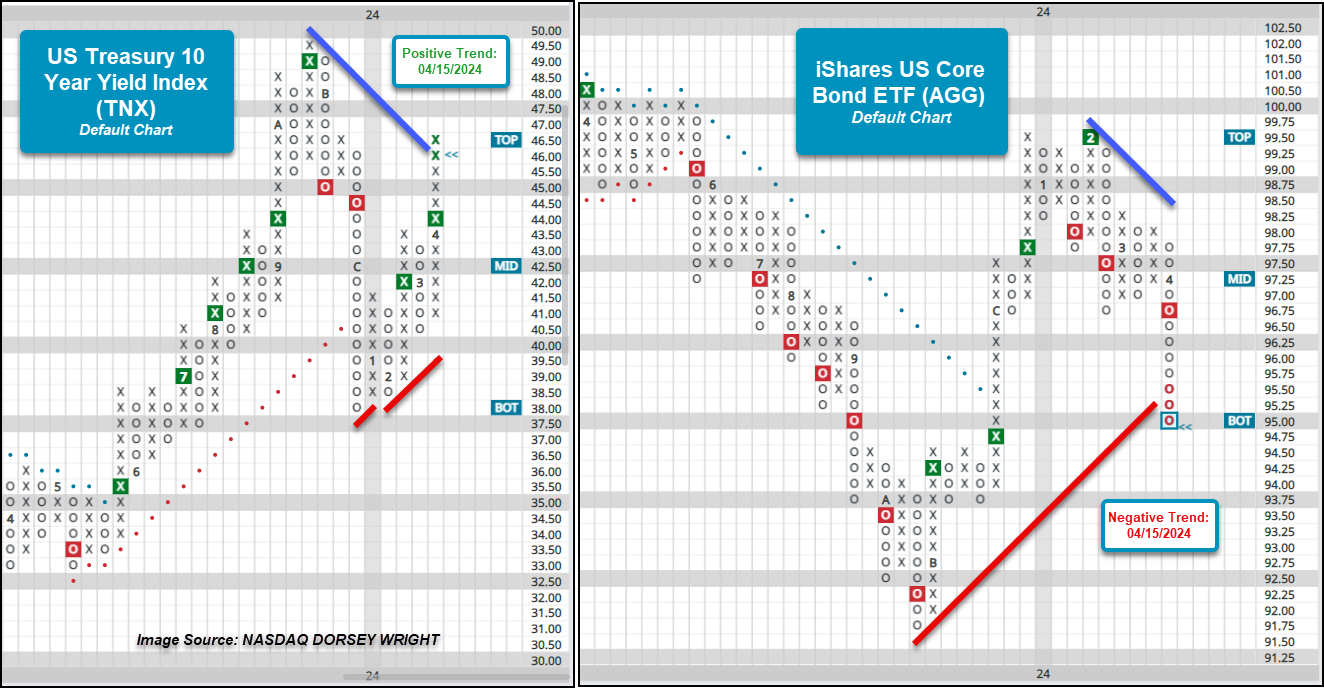
The trend flips following last week’s economic data, along with a change in narrative, suggests that the Fed may keep rates stable into the second half of 2024. Looking at the longer-term charts of both TNX and AGG slows the chart action and supports the “higher for longer” narrative. On 1 point per box chart, AGG reversed into Os following last Wednesday's action while intraday action this Tuesday saw the fund fall below the $95 level. This places another lower top on the point and figure chart and shows a series of lower tops that began early last year. It suggests that supply remains in control of the long-term technical picture for AGG, with the path of least resistance suggesting lower prices for the ETF. Meanwhile, the long-term 1/10 of a percent per box chart (i.e. 46.00 on the chart is equal to 4.60% for the 10-year yield) has seen TNX push up to the top of the 10-week trading band. The chart has been in Xs since January of this year and has continued to maintain a buy signal since May of last year, suggesting that demand is in control on the TNX chart and the path of least resistance being higher interest rates – or at least remaining more elevated than many may have anticipated at this time in 2024.
Not only can viewing long-term, slower-moving point and figure charts provide a different perspective, but they can often it can help provide a clearer picture when the short-term picture seems to be changing almost monthly or quarterly. While investors await a decision from the Fed, it is worth consulting these longer-term charts of TNX and AGG to understand how impactful some of the short and intermediate-term rate movements may be. A change in signal – a move to sell signal for TNX and buy signal for AGG – on their long-term charts would be an initial domino in the sequence of chart developments that may provide evidence of possible changes within the broader fixed income space. Users can set alerts for these signal changes on these particular scales within the Alerts tool on the NDW platform.


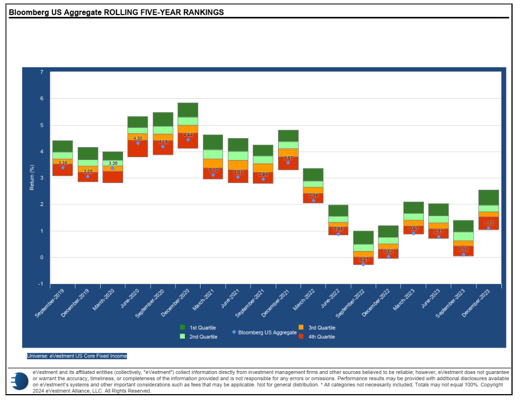
Trend following as a strategy has been around for decades. The basic idea is by buying when price is moving up and selling/hedging when price is moving down, one can outperform a buy and hold strategy. Typically, it is thought of as an equity-based strategy but it has been applied to many other asset classes including Fixed Income. In fact, we often find outperformance can be more consistent in Fixed Income due to the nature of Fixed Income index construction. Most indexes are market-cap weighted meaning the most indebted areas of the market get the highest weight. This tends to become a problem when these areas start to have issues (ex. being overweight mortgage-backed securities in 2008). Because of this issue, passive Fixed Income benchmarks tend to perform worse relative to active management (see below). This provides an opportunity for trend following approaches which, in theory, should be able to rotate out of poorly performing areas when passive indexes cannot.
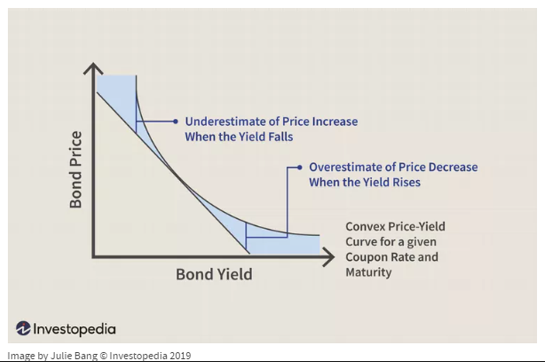
Fixed Income markets have seen historic declines since the Federal Reserve began raising interest rates in early 2022. In fact, 2022 was the worst year for bonds in at least 250 years. Why was it so bad? How could calamities such as the Great Depression, World War II, and the Civil War not cause more substantial issues for the market? Part of it comes down to the convex nature of bond pricing. When rates are low, more of a bond’s return comes from the return of principal at maturity vs. coupon payments made along the way. This naturally lengthens the duration of bonds (making them more sensitive to changes in interest rates) with greater price changes occurring the lower interest rates get (see below). Given that the period leading up to 2022 saw the lowest interest rates in recorded history, this had a major effect on bond prices and explains why similar rate changes in the past didn’t have the same impact on prices we saw here. Additionally, the Aggregate Bond Index is also more weighted towards US Treasuries now which further increases its interest rate sensitivity. All of this, combined with the speed of the rate increase led to the historic decline.
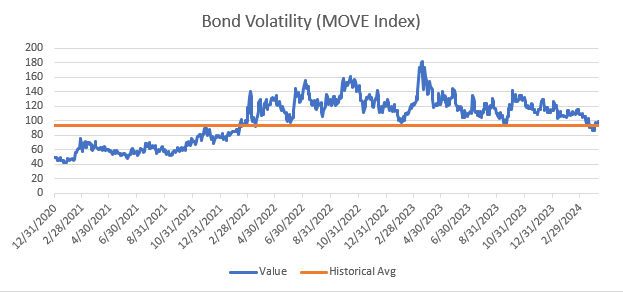
If the market only went down though a trend following approach likely would have done well as it could have allocated more of the portfolio toward the short end of the curve and sidestepped steeper declines in longer dated securities. However, along with the increase in rates we also saw a sustained increase in bond volatility. One way to measure this is through the ICE BofA MOVE Index which is like the VIX index for equities in that it uses options to calculate the implied volatility for treasury bonds. The average value of this index over time is 93. The average value since the beginning of 2022 is 119 (almost 30% higher). This is a difficult environment for a trend following strategy as by definition it requires the markets to form stable trends in one direction or another to succeed. In volatile markets though, even if the markets trend, the countertrend moves are often significant enough to cause the strategy to generate false signals. It also doesn’t help when the period of high volatility is sustained as it has been. In fact, the MOVE index recently traded below the long-term historical average (93) for the first time in two years (see below). Looking at historical data, levels of sustained high volatility like this have only been seen in 2008/2009 and 1994/1995 before this. The good news is that we seem to be moving back to a more normal environment which should allow trend following-based approaches to resume their previous success.
Nasdaq Dorsey Wright is a registered Investment advisory firm. Registration does not relfect any certain level of skill or training.
Past performance does not guarantee future results. In all securities trading, there is a potential for loss as well as profit. It should not be assumed that recommendations made in the future will be profitable or will equal the performance as shown. Investors should have long-term financial objectives when working with Dorsey Wright. The relative strength strategy is NOT a guarantee. There can be times where all investments, asset classes, and strategies are unfavorable and depreciate in value. Relative Strength is a measure of price momentum based on historical price activity. Relative Strength is not predictive and there is no assurance that forecasts based on relative strength can be relied upon.
The information contained herein has been prepared without regard to any particular investor’s investment objectives, financial situation, and needs. Accordingly, investors should not act on any recommendation (express or implied) or information in this material without obtaining specific advice from their financial advisors and should not rely on information herein as the primary basis for their investment decisions. Information contained herein is based on data obtained from recognized statistical services, issuer reports or communications, or other sources believed to be reliable (“information providers”). However, such information has not been verified by DWA or the information provider and DWA and the information providers make no representations or warranties or take any responsibility as to the accuracy or completeness of any recommendation or information contained herein. DWA and the information provider accept no liability to the recipient whatsoever whether in contract, in tort, for negligence, or otherwise for any direct, indirect, consequential, or special loss of any kind arising out of the use of this document or its contents or of the recipient relying on any such recommendation or information (except insofar as any statutory liability cannot be excluded). Any statements nonfactual in nature constitute only current opinions, which are subject to change without notice. Neither the information nor any opinion expressed shall constitute an offer to sell or a solicitation or an offer to buy any securities, commodities or exchange traded products. This document does not purport to be complete description of the securities or commodities, markets or developments to which reference is made. Advice from a financial professional is strongly advised.
There are risks inherent in international investments, which can make such investments unsuitable for certain clients. These include, for example, economic, political, currency exchange, rate fluctuations, and limited availability of information on international securities. Dorsey Wright, and its affiliates make no representation that the companies which issue securities.
Indexes are unmanaged. It is not possible to invest directly in an index.
©Copyright 2024. All rights reserved. Nasdaq® and the Nasdaq Stock Market® are registered trademarks, or service marks, of Nasdaq, Inc. in the United Stated and other countries.
Small caps have been laggards for the last decade when compared to large caps. Since 2014, the Russell 2000 Index (RUT) has only beaten the S&P 500 Index (SPX) in a calendar year twice, in 2016 and 2020. As it stands today, RUT is looking to mark its fourth consecutive year of underperformance against the SPX which would mean that RUT would have outperformed the SPX only once in the last eight years if this were to hold. It would be easy to say that large caps are simply more dominant and perform better than small caps if one looked back at the last few years. However, despite small caps’ struggles over the last decade, RUT has more often than not outperformed the SPX annually with data going back to 1979. RUT has outperformed SPX in just over half of all years (54.35%) since 1979. If one ignores the last decade, the percentage of years RUT outperformed SPX jumps up to 65.71%. The underperformance of RUT against the SPX is abnormal by historical standards but it’s also not without precedent. The chart below displays the excess return of RUT against the SPX for every year since 1979. A second data point is included, the 5-year average annual excess return, to help highlight longer periods of strength and weakness for small caps.
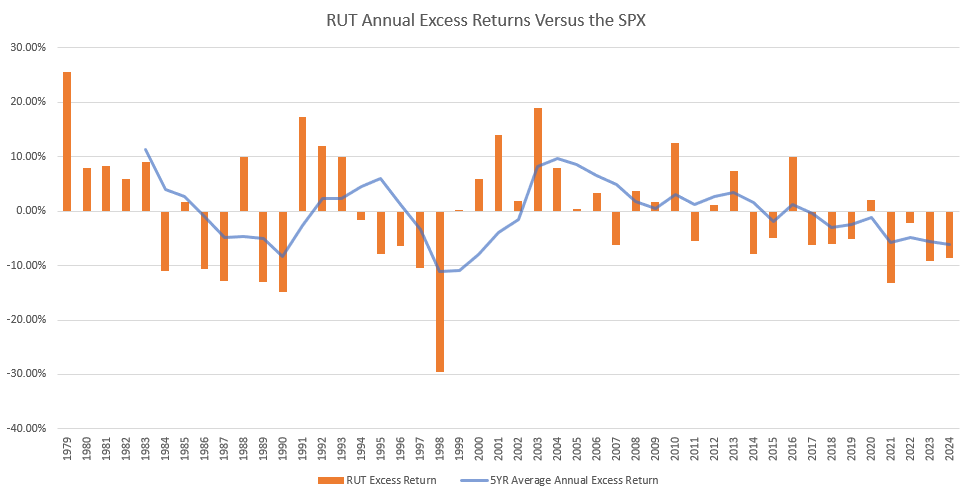
There are what seems to be two periods when small caps underperformed large caps for a lengthy period. The two periods took place during the mid-to-late 1980s and the mid-to-late 1990s. However, this could be considered a much longer stretch of underperformance with a three-year respite from 1991 to 1993. This would make it a 16-year-long period in which RUT outperformed the SPX in only five years. Sounds a bit familiar, doesn’t it? Entering the new millennium, RUT found a firm footing which led to a decade of consistent relative outperformance against the SPX. So, the RUT outperforms the SPX in about half of all calendar years doesn’t mean they each switch off years of outperformance. The inclination is for there to be long-running trends between the two in terms of leadership. From a technical perspective, there is no evidence yet that the current leadership from large caps is abating in any way. Whether it’s asset allocation tools like DALI or Asset Class Group Scores, fund scores, or trend charts, large caps are the clear leader. That isn’t to say it will be indefinite, but leadership roles between large and small caps don’t change frequently and the current paradigm can continue for years.
Fundamentally, small caps have some more pronounced issues than large caps. Other than companies in the Russell 2000 more likely to lose money in recent years relative to large caps, it is debt that is most concerning for small caps. Small cap companies are much more leveraged than large caps. While being more in debt than large caps, small caps also have a much different structure to their debt as they utilize floating rate debt much more than large caps. For the Russell 2000, roughly 38% of the debt is made up of floating rate debt while the S&P 500 contains just 6%. This means that rising interest rates have a more notable impact on small caps versus large caps. On top of being more indebted and directly impacted by higher interest rates, small caps need to refinance their debt more frequently. Over half of the S&P 500’s debt outstanding matures after 2030 relative to the Russell 2000’s 14% (JPM).
While the fundamental and technical pictures are worse for small caps than large caps, one notable dynamic seen in the small cap space is beneficial for momentum and relative strength investors. There is major sector dispersion in the small cap space, as we touched on in depth a few weeks ago (click here for more). The evidence is overwhelmingly in favor of large caps and has been the case for the last decade for the most part. However, as we stated before, leadership between large and small caps has historically been a long-term ordeal that can last more than a decade. Today, we are well into a long-term leadership regime by large caps. While there aren’t any signs this is going to change soon, it would be atypical if this did not change over the next decade.

Average Level
-16.88
| < - -100 | -100 - -80 | -80 - -60 | -60 - -40 | -40 - -20 | -20 - 0 | 0 - 20 | 20 - 40 | 40 - 60 | 60 - 80 | 80 - 100 | 100 - > |
|---|---|---|---|---|---|---|---|---|---|---|---|
|
Buy signalijr
|
|||||||||||
|
Buy signaliwm
|
|||||||||||
|
Buy signalVOOV
|
|||||||||||
|
Buy signalrsp
|
Buy signaloneq
|
||||||||||
|
Sell signallqd
|
Sell signalfxe
|
Buy signalQQQ
|
Buy signaldvy
|
||||||||
|
Sell signalief
|
Buy signalshy
|
Buy signalefa
|
Buy signalXLG
|
Buy signalUSO
|
|||||||
|
Sell signalagg
|
Buy signalhyg
|
Buy signalspy
|
Buy signaleem
|
Buy signaldx/y
|
Buy signalgcc
|
||||||
|
Sell signaltlt
|
Sell signalicf
|
Buy signaldia
|
Buy signalIJH
|
Buy signalvoog
|
Buy signalgsg
|
Buy signalgld
|
|||||
| < - -100 | -100 - -80 | -80 - -60 | -60 - -40 | -40 - -20 | -20 - 0 | 0 - 20 | 20 - 40 | 40 - 60 | 60 - 80 | 80 - 100 | 100 - > |
| AGG | iShares US Core Bond ETF |
| USO | United States Oil Fund |
| DIA | SPDR Dow Jones Industrial Average ETF |
| DVY | iShares Dow Jones Select Dividend Index ETF |
| DX/Y | NYCE U.S.Dollar Index Spot |
| EFA | iShares MSCI EAFE ETF |
| FXE | Invesco CurrencyShares Euro Trust |
| GLD | SPDR Gold Trust |
| GSG | iShares S&P GSCI Commodity-Indexed Trust |
| HYG | iShares iBoxx $ High Yield Corporate Bond ETF |
| ICF | iShares Cohen & Steers Realty ETF |
| IEF | iShares Barclays 7-10 Yr. Tres. Bond ETF |
| LQD | iShares iBoxx $ Investment Grade Corp. Bond ETF |
| IJH | iShares S&P 400 MidCap Index Fund |
| ONEQ | Fidelity Nasdaq Composite Index Track |
| QQQ | Invesco QQQ Trust |
| RSP | Invesco S&P 500 Equal Weight ETF |
| IWM | iShares Russell 2000 Index ETF |
| SHY | iShares Barclays 1-3 Year Tres. Bond ETF |
| IJR | iShares S&P 600 SmallCap Index Fund |
| SPY | SPDR S&P 500 Index ETF Trust |
| TLT | iShares Barclays 20+ Year Treasury Bond ETF |
| GCC | WisdomTree Continuous Commodity Index Fund |
| VOOG | Vanguard S&P 500 Growth ETF |
| VOOV | Vanguard S&P 500 Value ETF |
| EEM | iShares MSCI Emerging Markets ETF |
| XLG | Invesco S&P 500 Top 50 ETF |
| Symbol | Company | Sector | Current Price | Action Price | Target | Stop | Notes |
|---|---|---|---|---|---|---|---|
| KRG | Kite Realty Group Trust | Real Estate | $20.02 | 19 - 21 | 34.50 | 16 | 5 for 5'er, 11 of 113 in REAL sector matrix, LT pos mkt RS, spread quintuple top, 4.65% yield, Earn. 4/30 |
| OEC | Orion SA | Chemicals | $24.33 | 22 - 24 | 45.50 | 19 | 4 for 5'er, top third of CHEM sector matrix, LT pos mkt RS, spread quad top, R-R>5, Earn. 5/2 |
| ROP | Roper Technologies Inc. | Software | $528.26 | 510s - 540s | 648 | 432 | 4 for 5'er, top half of favored SOFT sector matrix, LT pos mkt RS, quad top breakout, Earn. 4/26 |
| NUE | Nucor Corporation | Steel/Iron | $194.01 | 170s - 180s | 234 | 150 | 4 for 5'er, top half of STEE sector matrix, spread triple top, pullback from ATH, 1.2% yield, Earn. 4/22 |
| BYD | Boyd Gaming Corp | Gaming | $64.56 | 61 - hi 60s | 87 | 52 | 4 TA rating, top 33% of GAME sector matrix, LT RS buy, buy-on-pullback, Earn. 4/23 |
| CCEP | Coca-Cola Europacific Partners PLC | Food Beverages/Soap | $67.08 | 60s | 97 | 56 | 5 for 5'er, top 25% of FOOD sector matrix, spread quad top, R-R~3.0, 3% yield |
| CXT | Crane NXT Co. | Electronics | $61.03 | hi 50s - low 60s | 76 | 48 | Top half of MACH sector matrix, bullish catapult, Earn. 5/8 |
| ODFL | Old Dominion Freight Line, Inc. | Transports/Non Air | $220.06 | 212 - 220s | 258 | 182 | 4 for 5'er, favored TRAN sector matrix, LT pos mkt RS, bullish triangle, Earn. 4/24 |
| ANSS | Ansys Inc | Software | $328.16 | 330s - 350s | 412 | 300 | 5 for 5'er, favored SOFT sector matrix, triple top, LT pos mkt RS, good R-R, Earn. 5/1 |
| MMC | Marsh & McLennan Companies, Inc. | Insurance | $197.32 | 190s - low 200s | 234 | 180 | 5 for 5'er, favored INSU sector, LT pos mkt RS, quad top breakout, 1.4% yield, Earn. 4/18 |
| IT | Gartner, Inc. | Business Products | $463.59 | 440s - 470s | 556 | 380 | 5 for 5'er, top 20% of favored BUSI sector matrix, LT pos mkt RS, quad top breakout, Earn. 4/30 |
| BLMN | Bloomin' Brands Inc | Restaurants | $26.80 | hi 20s - low 30s | 41 | 24 | 5 for 5'er, #10 of 27 in REST sector matrix, LT pos mkt RS, quintuple top, R-R>2.0, 3.2% yield, Earn. 4/26 |
| HEI | Heico Corporation | Aerospace Airline | $193.73 | 184 - hi 190s | 262 | 152 | 5 TA rating, top half of AERO sector matrix, LT RS buy, near-term consolidation |
| HRB | H&R Block, Inc. | Business Products | $46.32 | mid 40s - lo 50s | 71 | 39 | 5 TA rating, top 33% of BUSI sector matrix, LT pos trend, LT pos. mkt. RS, buy-on-pullback, R-R > 2, Earn. 5/7 |
| RRR | Red Rock Resorts Inc | Gaming | $59.96 | hi 50s - lo 60s | 87 | 49 | 5 TA rating, top 25% of GAME sector matrix, consec. buy signals, new ATH, R-R > 2, Earn. 5/7 |
| ITW | Illinois Tool Works Inc. | Machinery and Tools | $253.83 | low 250s - hi 260s | 356 | 216 | 5 for 5'er, LT pos mkt RS, spread quad top, 2.1% yield, Earn. 4/30 |
| MGM | MGM Resorts International | Gaming | $42.85 | 42-hi 40s | 66 | 38 | 4 TA rating, top 50% of GAME sector matrix, LT RS buy, consec. buy signals, pos. wkly. mom., R-R > 2, Earn. 5/1 |
| DKNG | DraftKings Inc Class A | Gaming | $43.70 | mid-to-hi 40s | 72 | 40 | 5 for 5'er, #2 of 17 in GAME sector matrix, triple top breakout, R-R>3.0, Earn. 5/2 |
| RPM | RPM, Inc. | Chemicals | $108.40 | mid 100s - hi 110s | 159 | 91 | 5 TA rating, LT RS buy, consec. buy signals, top 50% of CHEM sector matrix, buy-on-pullback, R-R > 2 |
| ARCB | ArcBest Corp. | Transports/Non Air | $149.95 | 140s - low 150s | 206 | 124 | 5 for 5'er, top 20% of favored TRAN sector matrix, LT pos mkt RS, R-R>2.0, Earn. 4/30 |
| CRC | California Resources Corporation | Oil | $55.00 | mid-to-hi 50s | 77 | 45 | 4 for 5'er, LT pos mkt RS, spread quad top, R-R ~ 2.0, 2.2% yield, Earn. 5/7 |
| GS | Goldman Sachs Group, Inc. | Wall Street | $400.88 | hi 380s - low 410s | 484 | 348 | 4 for 5'er, top half of WALL sector matrix, one box from mkt RS buy signal, quad top breakout, 2.75% yield |
| CI | CIGNA Group/The | Insurance | $348.90 | 332 - lo 360s | 428 | 288 | 5 TA rating, top half of INSU sector matrix, LT RS buy, buy-on-pullback |
| Symbol | Company | Sector | Current Price | Action Price | Target | Stop | Notes |
|---|---|---|---|---|---|---|---|
| MTCH | Match Group, Inc. | Internet | $31.96 | (mid 30s) | 26 | 40 | 0 for 5'er, bottom half of INET sector matrix, LT neg trend & RS, Earn. 4/30 |
| Symbol | Company | Sector | Current Price | Action Price | Target | Stop | Notes |
|---|---|---|---|---|---|---|---|
| MNST | Monster Beverage Corp. | Food Beverages/Soap | $54.10 | 47 | MNST moved to a sell signal this week. Current exposure may maintain the $47 stop. | ||
| SPB | Spectrum Brands Holdings | Food Beverages/Soap | $78.58 | 65 | SPB moved to a sell signal this week. Current exposure may maintain the $65 stop. | ||
| EAT | Brinker International Inc | Restaurants | $45.02 | 37 | EAT moved to a sell signal this week. Current exposure may maintain the $37 stop. | ||
| TMHC | Taylor Morrison Home Corporation | Building | $55.66 | 50 | TMHC moved to a sell signal this week. Current exposure may maintain the $50 stop. | ||
| DASH | DoorDash, Inc. Class A | Retailing | $132.94 | 108 | DASH reversed down and hit our stop at $132. Long term investors may continue using the $108 stop. |
| Comment | |||||||
|---|---|---|---|---|---|---|---|
|
|
|||||||
CI CIGNA Group/The R ($346.85) - Insurance - CI has a 5 for 5 TA rating and sits in the top half of the favored insurance sector RS matrix. The stock has moved sharply higher this year, giving three consecutive buy signals while ascending to a new all-time high at $364 last month. The market action this week saw CI retract from that high to the current chart position at $348, offering a more opportune entry point for potential long exposure. The overall weight of the technical evidence is favorable and has remained resilient, as the stock has been on an RS buy signal against the market since 2022. Exposure may be considered on this pullback from $332 to the low $360s. Our initial stop will be positioned at $288, which would violate all support from this year. The bullish price objective of $428 will serve as our price target. Note that earnings are also expected on 5/2.
| 23 | 24 | |||||||||||||||||||||||||||||||||||||||||||||||||||
| 364.00 | X | 364.00 | ||||||||||||||||||||||||||||||||||||||||||||||||||
| 360.00 | X | O | 360.00 | |||||||||||||||||||||||||||||||||||||||||||||||||
| 356.00 | X | O | 356.00 | |||||||||||||||||||||||||||||||||||||||||||||||||
| 352.00 | X | 4 | 352.00 | |||||||||||||||||||||||||||||||||||||||||||||||||
| 348.00 | X | O | 348.00 | |||||||||||||||||||||||||||||||||||||||||||||||||
| 344.00 | • | X | 3 | Mid | 344.00 | |||||||||||||||||||||||||||||||||||||||||||||||
| 340.00 | X | • | • | X | O | X | 340.00 | |||||||||||||||||||||||||||||||||||||||||||||
| 336.00 | X | O | X | • | X | O | X | 336.00 | ||||||||||||||||||||||||||||||||||||||||||||
| 332.00 | C | O | X | O | • | X | O | 332.00 | ||||||||||||||||||||||||||||||||||||||||||||
| 328.00 | B | X | O | X | O | • | X | 328.00 | ||||||||||||||||||||||||||||||||||||||||||||
| 324.00 | X | O | X | O | 1 | • | X | 324.00 | ||||||||||||||||||||||||||||||||||||||||||||
| 320.00 | X | O | X | O | • | • | X | 320.00 | ||||||||||||||||||||||||||||||||||||||||||||
| 316.00 | X | O | X | O | X | X | • | X | B | • | X | Bot | 316.00 | |||||||||||||||||||||||||||||||||||||||
| 312.00 | X | O | X | O | X | O | X | O | • | X | O | X | O | • | X | X | 312.00 | |||||||||||||||||||||||||||||||||||
| 308.00 | X | O | X | O | X | O | X | O | • | X | O | X | O | • | X | O | X | 308.00 | ||||||||||||||||||||||||||||||||||
| 304.00 | X | O | X | O | X | O | 2 | • | X | O | O | 1 | O | 2 | 304.00 | |||||||||||||||||||||||||||||||||||||
| 300.00 | X | O | X | O | • | O | X | • | 8 | X | O | X | O | X | 300.00 | |||||||||||||||||||||||||||||||||||||
| 296.00 | 9 | X | O | X | • | O | X | O | • | X | O | A | O | X | O | X | 296.00 | |||||||||||||||||||||||||||||||||||
| 292.00 | X | O | X | O | • | O | X | O | • | X | O | X | O | X | O | 292.00 | ||||||||||||||||||||||||||||||||||||
| 288.00 | X | O | A | • | O | 3 | • | X | O | 9 | O | X | 288.00 | |||||||||||||||||||||||||||||||||||||||
| 284.00 | X | O | X | • | O | • | X | O | X | O | X | 284.00 | ||||||||||||||||||||||||||||||||||||||||
| 280.00 | X | 8 | O | X | • | O | • | X | X | O | X | O | X | 280.00 | ||||||||||||||||||||||||||||||||||||||
| 276.00 | X | O | X | X | O | • | O | • | X | O | X | O | X | • | O | X | • | 276.00 | ||||||||||||||||||||||||||||||||||
| 272.00 | X | 7 | O | X | O | X | • | O | X | • | X | O | X | O | X | • | O | C | X | • | 272.00 | |||||||||||||||||||||||||||||||
| 268.00 | X | X | O | X | O | X | O | X | • | O | X | X | X | X | O | X | 7 | O | • | O | X | O | X | • | 268.00 | |||||||||||||||||||||||||||
| 264.00 | O | X | O | X | O | X | O | O | • | O | X | 4 | O | X | O | X | O | X | O | X | • | • | O | X | O | X | • | 264.00 | ||||||||||||||||||||||||
| 260.00 | O | X | O | X | 6 | X | • | O | X | O | X | O | X | O | X | O | X | O | X | • | O | O | X | • | 260.00 | |||||||||||||||||||||||||||
| 256.00 | O | O | O | X | • | O | X | O | X | O | X | O | 6 | O | O | • | O | • | 256.00 | |||||||||||||||||||||||||||||||||
| 252.00 | O | X | • | O | O | O | X | O | X | • | • | • | 252.00 | |||||||||||||||||||||||||||||||||||||||
| 248.00 | O | X | • | O | X | O | X | • | 248.00 | |||||||||||||||||||||||||||||||||||||||||||
| 244.00 | O | • | 5 | O | • | 244.00 | ||||||||||||||||||||||||||||||||||||||||||||||
| 23 | 24 |

| ARCH Arch Resources Inc ($164.15) - Oil - ARCH returned to a buy signal on Tuesday when it broke a double top at $164. The technical picture for the stock remains negative, however, as it is a 2 for 5'er that ranks in the bottom quintile of the oil sector matrix. From here, overhead resistance sits at $168, while support can be found at $152. Earnings are expected on 4/25. |
| BDX Becton, Dickinson and Company ($231.81) - Healthcare - BDX shares moved lower today to break a double bottom at $232 to mark its third consecutive sell signal. This 0 for 5'er has been in a negative trend since October and on an RS sell signal versus the market since March. BDX is trading below the middle of its trading band with a weekly overbought/oversold reading of -27%. From here, support is offered at $232. |
| DHI D.R. Horton, Inc. ($146.59) - Building - DHI broke a double bottom at $148 to return to a sell signal as the stock fell to $146. This action followed the stock rally to an all-time high at $164 before the recent action brought the stock back toward the middle of the trading band. DHI remains a 5 for 5'er, but the stock has fallen into the bottom half of the Building sector matrix. Long-term holders should not support now lies at $140, while the bullish support line sits at $124. |
| EIX Edison International ($67.06) - Utilities/Electricity - EIX reversed into Os and broke a double bottom at $67 to return the stock to a sell signal. The stock remains a 3 for 5'er coupled with a yield north of 4.5% and the stock ranks in the top quintile of the Electric Utilities sector matrix. The breakdown here brings EIX down to test its bullish support line, which would be violated with a move below $66. From here, additional support lies at $64 and $62. |
| HIBB Hibbett Inc. ($70.25) - Retailing - HIBB broke a double bottom at $69 for a second sell signal since the stock's near-term peak at $83 in March. This follows the stock moving back into a negative trend in mid-March, which dropped the stock to a 3 for 5'er. From here, long-term holders should note support lies in the $63 to $64 range, while additional can be found at $58. |
| ROKU Roku, Inc. Class A ($58.36) - Media - Continue to avoid. Now down over 35% so far this year, this 0/5'er has moved lower throughout 2024 and relative strength continues to leave the name. Lows from late 2023 are in sight now at $56. While this is nearby, the path of least resistance is lower for now. |
| SKYW Skywest Inc ($66.35) - Aerospace Airline - SKYW broke a double bottom at $66 to complete a bearish signal reversal pattern as the stock fell to $65. This marks the first sell signal for the stock since initially giving a buy signal back into November of last year. SKYW remains a 5 for 5'er and ranks 2nd (out of 43) in the Aerospace Airline sector matrix, but the stock is testing near-term support on the default chart at current chart levels. Additional support on the default chart isn't found until the $49 level, while support on the more sensitive 0.50 point per box chart lies in the upper-$50s. |
| SMCI Super Micro Computer, Inc. ($976.30) - Computers - SMCI rose Tuesday to break a double top at $960, returning the stock to a buy signal after a string of four consecutive sell signals. This 3 for 5'er moved to a positive trend in February and has been on an RS buy signal against the market since 2018, highlighting its long-term strength. The weight of the technical evidence is mixed but improving once again. Initial support can be seen at $896 with further support offered at $880 and $864. Overhead resistance may be seen initially at $1056. |
| SNOW Snowflake, Inc. Class A ($150.30) - Software - SNOW fell Tuesday to break a spread triple bottom at $150, marking a second consecutive sell signal. This 0 for 5'er moved to a negative trend in February and sits in the lower quintile of the software sector RS matrix. The weight of the technical evidence is weak and showing further deterioration. Additional support can be seen at the $142 to $140 level from last fall. Overhead resistance can be seen initially at $160. |
| Name | Option Symbol | Action | Stop Loss |
|---|---|---|---|
| American International Group, Inc. - $74.38 | O: 24G72.50D19 | Buy the July 72.50 calls at 5.10 | 67.00 |
| Name | Option | Action |
|---|---|---|
|
|
||
| Name | Option Symbol | Action | Stop Loss |
|---|---|---|---|
| Marvell Technology Inc. - $68.65 | O: 24T70.00D16 | Buy the August 70.00 puts at 7.15 | 73.00 |
| Name | Option | Action |
|---|---|---|
| LKQ Corporation ( LKQ) | Aug. 52.50 Puts | Raise the option stop loss to 2.80 (CP: 4.80) |
| Alibaba Group Holding Ltd (China) ADR ( BABA) | Jun. 75.00 Puts | Raise the option stop loss to 5.05 (CP: 7.05) |
| Prudential Financial, Inc. ( PRU) | Jun. 110.00 Puts | Raise the option stop loss to 3.60 (CP: 5.60) |
| Match Group, Inc. ( MTCH) | Jun. 37.50 Puts | Raise the option stop loss to 4.05 (CP: 6.05) |
| Albemarle Corp ( ALB) | Sep. 130.00 Puts | Raise the option stop loss to 22.10 (CP: 24.10) |
| Apple Inc. ( AAPL) | Jul. 180.00 Puts | Initiate an option stop loss of 11.45 (CP: 13.45) |
| Name | Option Sym. | Call to Sell | Call Price | Investment for 500 Shares | Annual Called Rtn. | Annual Static Rtn. | Downside Protection |
|---|---|---|---|---|---|---|---|
| Bath & Body Works Inc. $ 44.59 | O: 24H45.00D16 | Aug. 45.00 | 3.70 | $ 20,317.80 | 28.90% | 23.74% | 7.35% |
| Name | Action |
|---|---|
| Applied Materials, Inc. ( AMAT) - 205.68 | Sell the June 210.00 Calls. |
| Palantir Technologies Inc. Class A ( PLTR) - 21.90 | Sell the June 26.00 Calls. |
| Lyft Inc Class A ( LYFT) - 17.98 | Sell the July 20.00 Calls. |
| Delta Air Lines Inc. ( DAL) - 46.65 | Sell the September 50.00 Calls. |
| DraftKings Inc Class A ( DKNG) - 43.70 | Sell the July 45.00 Calls. |
| Bath & Body Works Inc. ( BBWI) - 44.59 | Sell the August 47.50 Calls. |
| The Gap, Inc. ( GPS) - 21.88 | Sell the June 23.00 Calls. |
| Name | Covered Write |
|---|---|
| Live Nation Entertainment Inc. ( LYV - 99.77 ) | July 105.00 covered write. |
Daily Equity & Market Analysis
Loading, Please Wait...
