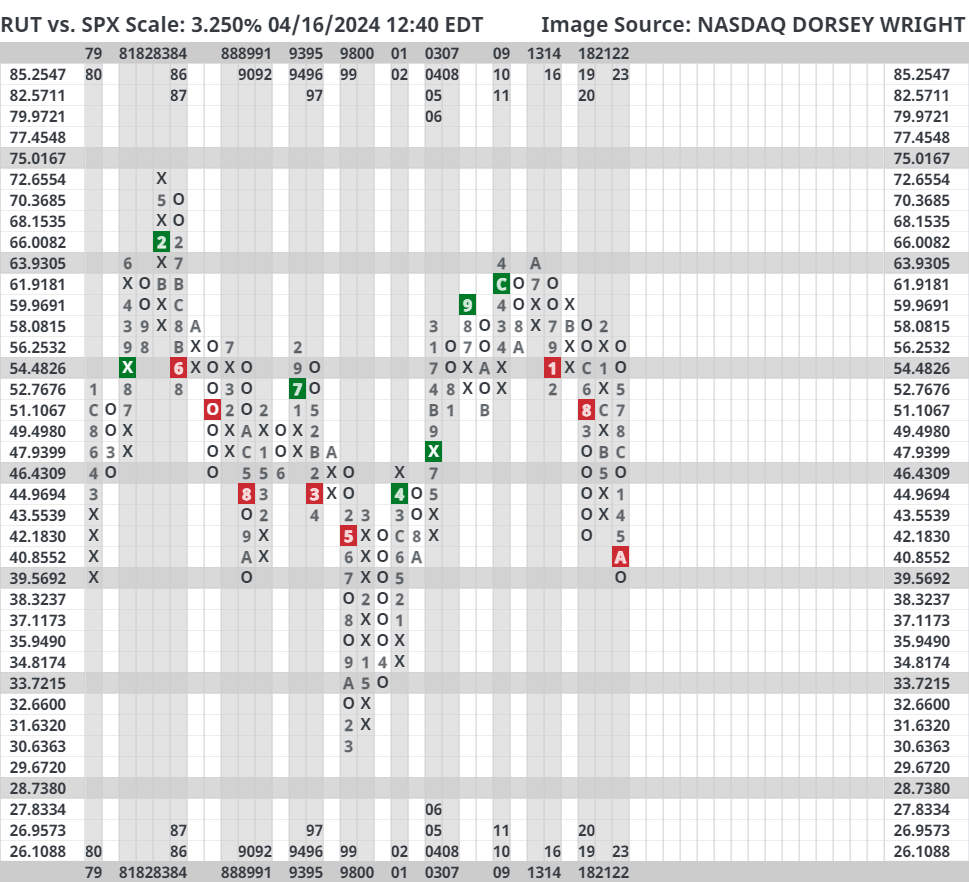
Small caps have been laggards for the last decade when compared to large caps. Since 2014, the Russell 2000 Index ([RUT]) has only beaten the S&P 500 Index ([SPX]) in a calendar year twice, in 2016 and 2020. As it stands today, RUT is looking to mark its fourth consecutive year of underperformance against the SPX which would mean that RUT would have outperformed the SPX only once in the last eight years if this were to hold.
Small caps have been laggards for the last decade when compared to large caps. Since 2014, the Russell 2000 Index (RUT) has only beaten the S&P 500 Index (SPX) in a calendar year twice, in 2016 and 2020. As it stands today, RUT is looking to mark its fourth consecutive year of underperformance against the SPX which would mean that RUT would have outperformed the SPX only once in the last eight years if this were to hold. It would be easy to say that large caps are simply more dominant and perform better than small caps if one looked back at the last few years. However, despite small caps’ struggles over the last decade, RUT has more often than not outperformed the SPX annually with data going back to 1979. RUT has outperformed SPX in just over half of all years (54.35%) since 1979. If one ignores the last decade, the percentage of years RUT outperformed SPX jumps up to 65.71%. The underperformance of RUT against the SPX is abnormal by historical standards but it’s also not without precedent. The chart below displays the excess return of RUT against the SPX for every year since 1979. A second data point is included, the 5-year average annual excess return, to help highlight longer periods of strength and weakness for small caps.
There are what seems to be two periods when small caps underperformed large caps for a lengthy period. The two periods took place during the mid-to-late 1980s and the mid-to-late 1990s. However, this could be considered a much longer stretch of underperformance with a three-year respite from 1991 to 1993. This would make it a 16-year-long period in which RUT outperformed the SPX in only five years. Sounds a bit familiar, doesn’t it? Entering the new millennium, RUT found a firm footing which led to a decade of consistent relative outperformance against the SPX. So, the RUT outperforms the SPX in about half of all calendar years doesn’t mean they each switch off years of outperformance. The inclination is for there to be long-running trends between the two in terms of leadership. From a technical perspective, there is no evidence yet that the current leadership from large caps is abating in any way. Whether it’s asset allocation tools like DALI or Asset Class Group Scores, fund scores, or trend charts, large caps are the clear leader. That isn’t to say it will be indefinite, but leadership roles between large and small caps don’t change frequently and the current paradigm can continue for years.
Fundamentally, small caps have some more pronounced issues than large caps. Other than companies in the Russell 2000 more likely to lose money in recent years relative to large caps, it is debt that is most concerning for small caps. Small cap companies are much more leveraged than large caps. While being more in debt than large caps, small caps also have a much different structure to their debt as they utilize floating rate debt much more than large caps. For the Russell 2000, roughly 38% of the debt is made up of floating rate debt while the S&P 500 contains just 6%. This means that rising interest rates have a more notable impact on small caps versus large caps. On top of being more indebted and directly impacted by higher interest rates, small caps need to refinance their debt more frequently. Over half of the S&P 500’s debt outstanding matures after 2030 relative to the Russell 2000’s 14% (JPM).
While the fundamental and technical pictures are worse for small caps than large caps, one notable dynamic seen in the small cap space is beneficial for momentum and relative strength investors. There is major sector dispersion in the small cap space, as we touched on in depth a few weeks ago (click here for more). The evidence is overwhelmingly in favor of large caps and has been the case for the last decade for the most part. However, as we stated before, leadership between large and small caps has historically been a long-term ordeal that can last more than a decade. Today, we are well into a long-term leadership regime by large caps. While there aren’t any signs this is going to change soon, it would be atypical if this did not change over the next decade.