
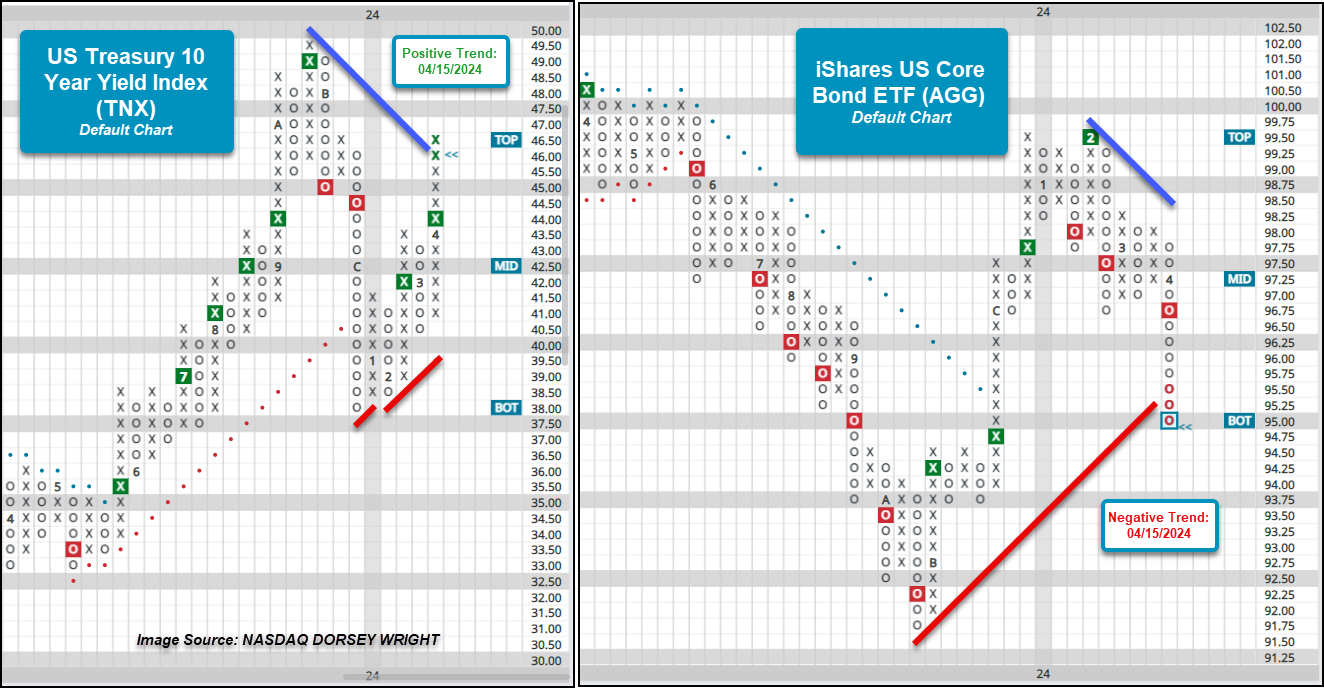
The US Treasury 10-Year Yield Index (TNX) moved into a positive trend, while the iShares US Core Bond ETF [AGG] moved into a negative trend during Monday's trading.
Introducing the KraneShares Tactical Emerging Markets Model
The purpose of the KraneShares Tactical Emerging Markets Model is to identify major themes in emerging markets. The Model is designed to provide overweight exposure toward Chinese equities during periods of strength, while reducing or eliminating exposure toward Chinese equities during periods of weakness.
Last week’s higher-than-expected CPI print on Wednesday was followed by the highest PPI print since April 2023, though the PPI was lower than anticipated. Both garnered the market’s attention as equity and fixed income indices have fallen through the end of last week and on into this week’s action. Following yesterday’s action, the US Treasury 10-Year Yield Index TNX moved above 4.6% (46.00 on the chart) and back into a positive trend after trading in a negative trend since mid-December 2023. This follows a second buy signal on the point and figure chart for TNX earlier this month after returning to a buy signal in mid-February. Before TNX moved back into a positive trend this week, the US Treasury 5-Year Yield Index FVX moved back into a positive trend earlier this month, and this week’s action has brought the US Treasury 30-Year Yield Index TYX to within one box of shifting its trend back to positive. Meanwhile, the iShares US Core Bond ETF AGG gave a second sell signal earlier this month and fell into a negative trend during Monday’s trading. Intraday action Tuesday saw AGG fall to $95 and its most oversold level since the October 2023 chart lows.
The trend flips following last week’s economic data, along with a change in narrative, suggests that the Fed may keep rates stable into the second half of 2024. Looking at the longer-term charts of both TNX and AGG slows the chart action and supports the “higher for longer” narrative. On 1 point per box chart, AGG reversed into Os following last Wednesday's action while intraday action this Tuesday saw the fund fall below the $95 level. This places another lower top on the point and figure chart and shows a series of lower tops that began early last year. It suggests that supply remains in control of the long-term technical picture for AGG, with the path of least resistance suggesting lower prices for the ETF. Meanwhile, the long-term 1/10 of a percent per box chart (i.e. 46.00 on the chart is equal to 4.60% for the 10-year yield) has seen TNX push up to the top of the 10-week trading band. The chart has been in Xs since January of this year and has continued to maintain a buy signal since May of last year, suggesting that demand is in control on the TNX chart and the path of least resistance being higher interest rates – or at least remaining more elevated than many may have anticipated at this time in 2024.
Not only can viewing long-term, slower-moving point and figure charts provide a different perspective, but they can often it can help provide a clearer picture when the short-term picture seems to be changing almost monthly or quarterly. While investors await a decision from the Fed, it is worth consulting these longer-term charts of TNX and AGG to understand how impactful some of the short and intermediate-term rate movements may be. A change in signal – a move to sell signal for TNX and buy signal for AGG – on their long-term charts would be an initial domino in the sequence of chart developments that may provide evidence of possible changes within the broader fixed income space. Users can set alerts for these signal changes on these particular scales within the Alerts tool on the NDW platform.

