Today we look at an RS Switching Strategy between RSP and SPY.
Beginners Series Webinar: Join us on Friday, June 16th at 2 PM (ET) for our NDW Beginners Series Webinar. This week's topic is: Fund Score Composition and the Asset Class Group Scores Page. Register Here
Yesterday’s Were You Aware discussed a recent development on the Asset Class Group Scores (ACGS) page, which saw cap-weighted assets move above equal-weighted assets for the first time in over two years from an average score perspective. This comes off the back of a stellar rally for the broad indices, seeing SPX journey within 10% of all-time highs from December of 2021. While plenty of work is left to do before such a level would be a serious consideration, the mention alone of such a feat after a rocky 2022 speaks to the magnitude of recent upside participation. Yesterday’s article briefly discussed such an idea, with cap-weighted assets earning strong marks across many parts of our platform.
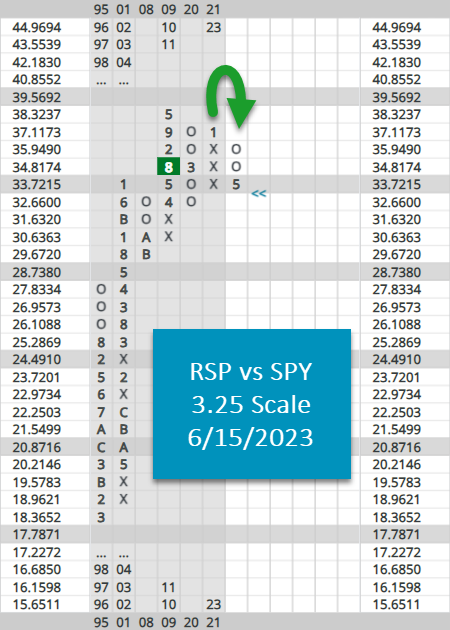
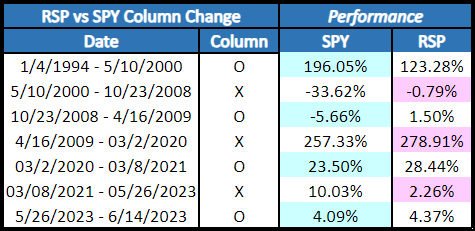
One of those areas was the recent flip of near-term relative strength (RS) between cap-weighted proxy SPY and equal-weighted proxy RSP on a 3.25 scale. As the funds are so similar, reversals (or eventual signal changes) are certainly worth noting and could be used as a sign of market attitude for the time being. As seen in the chart below, May’s reversal will mark only the 6th instance of such a change in nearly three decades. As with other relative strength charts on the platform, one could choose to employ a “switching” strategy, which simply invests in the asset that is in a column of X’s (or on a buy signal, but that won’t be used for today’s report), focusing your assets into the “winner” of the battle. Included below is a table of such a strategy. Note that the chart below considers being in a column of O’s as a preference for SPY, while a column of X’s suggests an investment in RSP. While not each reversal has been a “hit” by an outperformance standard, its worth mentioning that the strategy did shield investors (from a purely relative standpoint) from a bulk of the GFC, and has an impressive 42% average outperformance when the indicator is on the right side of the trade. Take that, in comparison to a 5% underperformance when the reversal “misses”.
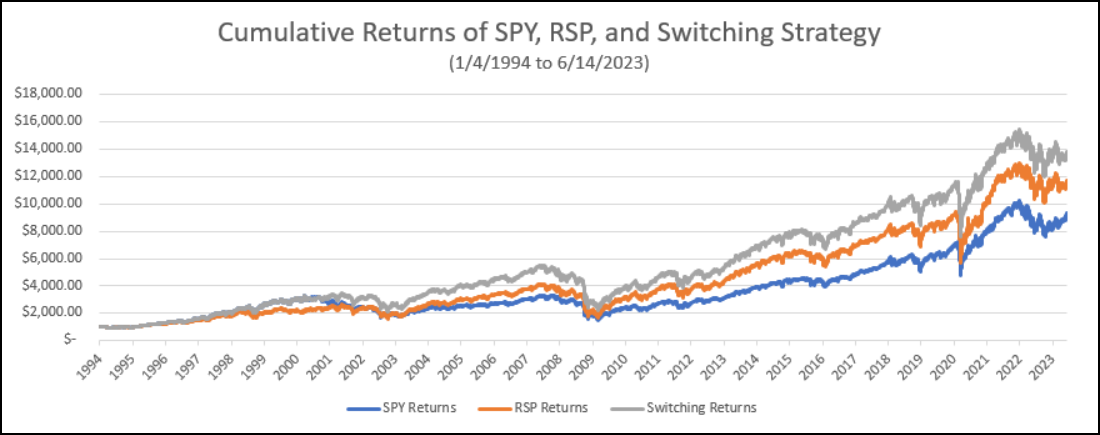
As an added test, we ran our “switching” portfolio up against simply owning each asset on its own throughout the entire period (1/4/1994-6/15/23). The point being, we know our reversal portfolio does experience occasional “head fakes”, and are aiming to isolate a pure point A to point B scenario. As seen in the chart below, following such a strategy does indeed best a pure “buy and hold” strategy for each asset on its own.