Most Requested Symbols

The Bullish Percent for the S&P 500 (^BPSPX) reversed back up into a column of Xs Thursday from 64% to 70%.
Save the date for Catapult 2024, our refreshed annual conference that will be held October 15 - 17, 2024, in Nashville! Registration is opening soon.
The curve has an average reading of 52.97%.
Today's featured stock is Gartner, Inc. (IT).
BMY, IOT, and MOD
Call: CoStar Group Inc (CSGP); Put: Alcoa Inc (AA); Covered Write: Seagate Technology (STX).
NDW Morning Update Video - March 11, 2024
NDW Morning Update Video – March 11, 2024.
Click here to download MP3
The Bullish Percent for the S&P 500 ^BPSPX reversed back up into a column of Xs Thursday from 64% to 70%. As a refresher, this indicator measures the percentage of stocks in the S&P 500 Index SPX that currently sit on a buy signal on their default point & figure charts. Typically viewed as an intermediate term breadth indicator, this chart helps us understand context around just how many stocks are participating in movement to the upside. Bullish percent charts have been utilized in many ways over the years, but there is no need to make the indicator more complicated than it needs to be.
The are two main data points that should be focused on: the current chart level and the current chart column. This tells us what percent of stocks are participating in upwards movement, and whether that participation is improving or declining. Seeing it reverse higher while indices make new all-time highs is a good sign for the technical posture of the core US equity market.
This is different than what we saw over the first two months of the year. The BPSPX reversed down into Os from the 78% level in mid-January while the broader market continued to close at record highs. So, indexes were storming higher, but not as many stocks were participating in that upwards movement. That set up the potential for amplified weakness if the names carrying the market higher begin to show cracks in their armor. The next few weeks saw those cracks begin to show up with weakness from the “Magnificent 7’ stocks that carried the market throughout last year. Tesla TSLA dropped to a 0 for 5 TA rating by the end of January. Alphabet GOOGL moved to a sell signal in February and dropped two technical attributes in the first few days of March. Apple AAPL gave consecutive sell signals, moved into a negative trend, and dropped to a 2 for 5 TA rating this week.
Even amidst this abundance of negativity, the S&P 500 Index continued to march higher. Other names picked up the slack from those weakening stocks, ultimately leading to higher overall participation levels with the BPSPX reversal back to 70%. This highlights the importance of perspective for these participation indicators. A reversal lower from a high position may seem ominous, but as long as it remains in a generally elevated territory, we find that markets tend to continue performing well. In other words, pullbacks in the indicator are natural just as they are with the underlying stocks it represents.


Earlier this week the Invesco S&P 500 Equal Weight ETF (RSP) reached all-time highs for the first time in over two years. This development is big news for a couple of related reasons. First, RSP’s breakout highlights the expansion of participation; in other words, clearly more than seven stocks are making gains. Remember that for the majority of the last year, investors were complaining about breadth, and justifiably so in most cases. Second, RSP’s breakout comes at a time when members of the Mag 7 (which are a huge weight in the S&P 500) have shown signs of deterioration. Take for example Apple (AAPL) which fell into a negative trend earlier this week and was consequently demoted to a 2 for 5’er. Tesla (TSLA) is another example with its -28% year-to-date return and 0 for 5 attribute rating.
Cap weighted funds like the SPDR S&P 500 ETF Trust (SPY) are fantastic when the biggest players produce outsized returns; however, when these same positions flounder the rest of the pack can offer little help to hold up the benchmark. On the other hand, RSP does not have the same concentration risk as SPY which can be a benefit or detriment depending on market conditions.

Over the past decade (arguably two decades) SPY has overshadowed RSP. For instance, from 3/7/2014 to 3/7/2024 SPY gained 228% while RSP added just 167%. Over the past 20 years, the story is the same, but the outperformance is less pronounced - SPY advanced 557% and RSP added 535%.
20 years is relatively short in stock market history. What if we looked back further?
We have S&P 500 Equal Weight Index (SPXEWI) data starting in 1990. Of course, the other S&P 500 Index (cap weight, SPX) dates back much further, but for comparison purposes, we ran a hypothetical growth with a common start date in 1990. Below are the results.
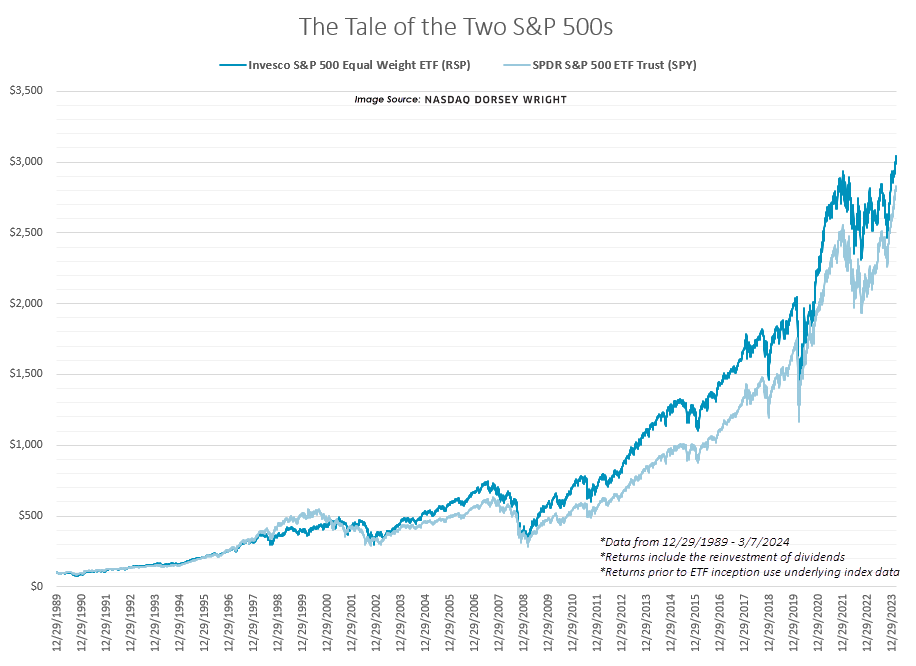
Perhaps to some surprise, the equal weight index has outperformed the cap weight index since its inception. Furthermore, the cap weight index has been playing catch up for a vast majority of the last 30+ years. SPXEWI has gained 2970% since inception while SPX has gained 2745% over the same period (12/29/1989 - 3/7/2024). So, technically speaking, the equal weight has been a tougher benchmark since inception.
There are a couple of rebuttals to that statement. First, no one really cares because SPY has done better as of late (recency bias) which could keep the outperformance trend going (fund flows). Second, what if equal weight is just mechanically disadvantaged now? Its efficacy for alpha is decaying. In other words, equal weighting S&P 500 stocks is a thing of the past destined to die.
In our view, a more reasonable conclusion is that sometimes it is better to own equal weight and other times cap weight; in fact, the data supports this conclusion. Perhaps the simplest way of deciding when to own equal or cap weight is using our relative strength column switching strategy, last discussed here. Although, that is not the only technical evidence we can look toward. A more nuanced observation we want to make today relates to the latest breakout for RSP.
As we said at the beginning, RSP hit an all-time high earlier this week for the first time in over two years; more specifically, it had been 790 calendar days since RSP last printed an all-time high (1/4/2022). Does an elongated period without all-time highs matter concerning forward performance? The data says yes. We bulleted some observations below the following table.

As you would expect us to conclude with a small sample size, weigh these performance implications lightly. Nonetheless, the technical significance stands, and hopes for a catch-up trade seem more plausible with multi-year resistance in the rearview mirror.

| Symbol | Name | Price | Yield | PnF Trend | RS Signal | RS Col. | Fund Score | 200 Day MA | Weekly Mom |
|---|---|---|---|---|---|---|---|---|---|
| DIA | SPDR Dow Jones Industrial Average ETF Trust | 388.45 | 1.74 | Positive | Sell | X | 4.06 | 354.58 | - 9W |
| EEM | iShares MSCI Emerging Markets ETF | 40.86 | 2.63 | Negative | Sell | O | 2.54 | 39.23 | + 4W |
| EFA | iShares MSCI EAFE ETF | 79.51 | 2.90 | Positive | Sell | X | 4.16 | 72.29 | + 3W |
| FM | iShares Frontier and Select EM ETF | 27.62 | 3.51 | Positive | Sell | O | 3.14 | 26.37 | + 2W |
| IJH | iShares S&P MidCap 400 Index Fund | 59.32 | 1.40 | Positive | Buy | O | 4.53 | 52.34 | + 3W |
| IJR | iShares S&P SmallCap 600 Index Fund | 108.10 | 1.32 | Positive | Sell | O | 2.93 | 99.69 | + 1W |
| QQQ | Invesco QQQ Trust | 445.45 | 0.58 | Positive | Buy | X | 5.74 | 383.88 | - 3W |
| RSP | Invesco S&P 500 Equal Weight ETF | 165.70 | 1.58 | Positive | Sell | O | 3.15 | 149.60 | + 3W |
| SPY | SPDR S&P 500 ETF Trust | 514.81 | 1.30 | Positive | Sell | X | 4.45 | 453.60 | + 5W |
| XLG | Invesco S&P 500 Top 50 ETF | 41.71 | 0.89 | Positive | Buy | X | 5.77 | 36.19 | - 1W |

Featured Chart: iShares MSCI Emerging Markets ETF (EEM)
EEM moved higher this week, breaking past its bearish resistance line and returning to a positive trend on its default chart. This mostly comes as China continues to try and find a near-term bottom. While this is a positive for the space (and international equities in general), developed markets should still make up the majority of your international sleeve as EFA holds a higher fund score. Bulls will keep an eye on the low $40’s, points of stiff resistance from the highs of 2023.
Additional Comments:
Invesco S&P 500 Equal Weight ETF (RSP):
Perhaps equally as deserving of this week’s featured chart as previously mentioned EEM, RSP moved to new all-time chart highs over the last seven days. While this by no means signals the end of cap-weighted dominance, the NDW analyst team is encouraged by the additional upside participation coming from outside the core of the market. While the rally has brought the fund into heavily overbought territory, it does provide the opportunity for equal-weighted assets to take a larger technical role in market action to close Q1.
Average Level
52.97
| < - -100 | -100 - -80 | -80 - -60 | -60 - -40 | -40 - -20 | -20 - 0 | 0 - 20 | 20 - 40 | 40 - 60 | 60 - 80 | 80 - 100 | 100 - > |
|---|---|---|---|---|---|---|---|---|---|---|---|
|
Buy signalrsp
|
|||||||||||
|
Buy signalicf
|
Buy signalIJH
|
||||||||||
|
Buy signalijr
|
Buy signaleem
|
Buy signalVOOV
|
|||||||||
|
Buy signaldx/y
|
Sell signalagg
|
Sell signalfxe
|
Buy signaldia
|
Sell signalgcc
|
Buy signalspy
|
||||||
|
Sell signallqd
|
Buy signalhyg
|
Buy signalUSO
|
Buy signaliwm
|
Buy signaloneq
|
Buy signalvoog
|
Buy signalefa
|
|||||
|
Buy signalshy
|
Sell signalief
|
Buy signaltlt
|
Buy signalgsg
|
Buy signaldvy
|
Buy signalQQQ
|
Buy signalXLG
|
Buy signalgld
|
||||
| < - -100 | -100 - -80 | -80 - -60 | -60 - -40 | -40 - -20 | -20 - 0 | 0 - 20 | 20 - 40 | 40 - 60 | 60 - 80 | 80 - 100 | 100 - > |
| AGG | iShares US Core Bond ETF |
| USO | United States Oil Fund |
| DIA | SPDR Dow Jones Industrial Average ETF |
| DVY | iShares Dow Jones Select Dividend Index ETF |
| DX/Y | NYCE U.S.Dollar Index Spot |
| EFA | iShares MSCI EAFE ETF |
| FXE | Invesco CurrencyShares Euro Trust |
| GLD | SPDR Gold Trust |
| GSG | iShares S&P GSCI Commodity-Indexed Trust |
| HYG | iShares iBoxx $ High Yield Corporate Bond ETF |
| ICF | iShares Cohen & Steers Realty ETF |
| IEF | iShares Barclays 7-10 Yr. Tres. Bond ETF |
| LQD | iShares iBoxx $ Investment Grade Corp. Bond ETF |
| IJH | iShares S&P 400 MidCap Index Fund |
| ONEQ | Fidelity Nasdaq Composite Index Track |
| QQQ | Invesco QQQ Trust |
| RSP | Invesco S&P 500 Equal Weight ETF |
| IWM | iShares Russell 2000 Index ETF |
| SHY | iShares Barclays 1-3 Year Tres. Bond ETF |
| IJR | iShares S&P 600 SmallCap Index Fund |
| SPY | SPDR S&P 500 Index ETF Trust |
| TLT | iShares Barclays 20+ Year Treasury Bond ETF |
| GCC | WisdomTree Continuous Commodity Index Fund |
| VOOG | Vanguard S&P 500 Growth ETF |
| VOOV | Vanguard S&P 500 Value ETF |
| EEM | iShares MSCI Emerging Markets ETF |
| XLG | Invesco S&P 500 Top 50 ETF |

| Symbol | Company | Sector | Current Price | Action Price | Target | Stop | Notes |
|---|---|---|---|---|---|---|---|
| KRG | Kite Realty Group Trust | Real Estate | $21.34 | 19 - 21 | 34.50 | 16 | 5 for 5'er, 11 of 113 in REAL sector matrix, LT pos mkt RS, spread quintuple top, 4.65% yield |
| ORCL | Oracle Corporation | Software | $114.54 | mid 100s - mid 110s | 138 | 96 | LT pos mkt RS, trend chart signal flip, 1.5% yield, Earn. 3/7 |
| ING | Ing Groep N.V. -Sponsored (Netherlands) ADR | Insurance | $14.64 | 13.50 - 15 | 27 | 12 | 4 for 5'er, triple top, R-R>5, 6% yield |
| OEC | Orion SA | Chemicals | $22.30 | 22 - 24 | 45.50 | 19 | 4 for 5'er, top third of CHEM sector matrix, LT pos mkt RS, spread quad top, R-R>5 |
| MNST | Monster Beverage Corp. | Food Beverages/Soap | $59.38 | mid-to-hi 50s | 70 | 47 | 5 for 5'er, top third of FOOD sector matrix, LT pos mkt RS |
| RUSHA | Rush Enterprises, Inc. | Autos and Parts | $47.98 | 43 - hi 40s | 81 | 37 | 5 TA rating, top 33% of AUTO sector matrix, LT RS buy, R-R > 3.5 |
| CAH | Cardinal Health, Inc. | Drugs | $113.67 | low-to-mid 100s | 136 | 85 | 5 for 5'er, top half of favored DRUG sector matrix, multiple buy signal, pullback from ATH, 1.8% yield |
| INTU | Intuit Inc. | Software | $649.34 | 600s - 650s | 824 | 504 | 5 TA rating, top 20% of SOFT sector matrix, consec. buy signals, LT RS buy, buy on pullback |
| ROP | Roper Technologies Inc. | Software | $546.32 | 510s - 540s | 648 | 432 | 4 for 5'er, top half of favored SOFT sector matrix, LT pos mkt RS, quad top breakout |
| NUE | Nucor Corporation | Steel/Iron | $186.41 | 170s - 180s | 234 | 150 | 4 for 5'er, top half of STEE sector matrix, spread triple top, pullback from ATH, 1.2% yield |
| TPX | Tempur Sealy International Inc. | Household Goods | $55.34 | 49 - 53 | 80 | 41 | 5 for 5'er, top 25% of HOUS sector matrix, LT pos mkt RS, R-R>3.0 |
| BYD | Boyd Gaming Corp | Gaming | $63.91 | 61 - hi 60s | 87 | 52 | 4 TA rating, top 33% of GAME sector matrix, LT RS buy, buy-on-pullback |
| CCEP | Coca-Cola Europacific Partners PLC | Food Beverages/Soap | $70.56 | 60s | 97 | 56 | 5 for 5'er, top 25% of FOOD sector matrix, spread quad top, R-R~3.0, 3% yield |
| CXT | Crane NXT Co. | Electronics | $60.23 | hi 50s - low 60s | 76 | 48 | Top half of MACH sector matrix, bullish catapult |
| GD | General Dynamics Corporation | Aerospace Airline | $273.03 | mid 250s - mid 270s | 352 | 220 | 4 TA rating, top 33% of AERO matrix, LT RS buy, consec. buy signals, pos. wkly. mom. |
| ODFL | Old Dominion Freight Line, Inc. | Transports/Non Air | $443.07 | 400s - 430s | 516 | 356 | 4 for 5'er, favored TRAN sector matrix, LT pos mkt RS, bullish triangle |
| SPB | Spectrum Brands Holdings | Food Beverages/Soap | $83.06 | hi 70s - mid 80s | 112 | 65 | 4 TA rating, top quartile of FOOD sector RS matrix, consec. buy signals, buy-on-pullback, R-R > 2 |
| ANSS | Ansys Inc | Software | $339.37 | 330s - 350s | 412 | 300 | 5 for 5'er, favored SOFT sector matrix, triple top, LT pos mkt RS, good R-R |
| MMC | Marsh & McLennan Companies, Inc. | Insurance | $204.29 | 190s - low 200s | 234 | 180 | 5 for 5'er, favored INSU sector, LT pos mkt RS, quad top breakout, 1.4% yield |
| STLD | Steel Dynamics Inc. | Steel/Iron | $132.41 | lo 120s - mid 130s | 174 | 106 | 4 TA rating, top 33% of STEE sector matrix, LT RS buy, buy-on-pullback, R-R > 2 |
| GMS | GMS Inc. | Building | $90.58 | hi 80s - low 90s | 106 | 77 | 5 for 5'er, top half of BUIL sector matrix, LT pos mkt RS, multiple consec buy signals, 1.5% yield |
| ALLY | Ally Financial Inc. | Finance | $36.54 | 32 - hi 30s | 60 | 29 | 4 TA rating, top 20% of FINA sector matrix, LT RS buy, buy-on-pullback, R-R > 3 |
| IT | Gartner, Inc. | Business Products | $470.00 | 440s - 470s | 556 | 380 | 5 for 5'er, top 20% of favored BUSI sector matrix, LT pos mkt RS, quad top breakout |
| Symbol | Company | Sector | Current Price | Action Price | Target | Stop | Notes |
|---|---|---|---|---|---|---|---|
| PYPL | Paypal Holdings Inc | Finance | $58.50 | hi 50s - low 60s | 47 | 69 | 0 for 5'er, bottom 20% of FINA sector matrix, LT neg mkt RS, neg trend change |
| Symbol | Company | Sector | Current Price | Action Price | Target | Stop | Notes |
|---|---|---|---|---|---|---|---|
| AER | AerCap Holdings NV | Aerospace Airline | $82.13 | mid 70s - low 80s | 99 | 62 | AER has moved into heavily overbought territory. OK to hold here. Raise stop to $70. |
| Comment | |||||||
|---|---|---|---|---|---|---|---|
|
|
|||||||
IT Gartner, Inc. R ($463.56) - Business Products - IT is a 5 for 5'er that ranks in the top quintile of the favored business products sector matrix and has been on a market RS buy signal since 2006. On its default chart, IT has completed three consecutive buy signals, most recently breaking a quadruple top at $472 earlier this week. Long exposure may be added in the $440s to $470s and we will set our initial stop at $380, which would take out multiple levels of support on IT's default chart. We will use the bullish price objective, $556, as our target price.
| 23 | 24 | |||||||||||||||||||||||||||||||||||||||||||||||||||
| 472.00 | 3 | 472.00 | ||||||||||||||||||||||||||||||||||||||||||||||||||
| 464.00 | X | X | X | X | 464.00 | |||||||||||||||||||||||||||||||||||||||||||||||
| 456.00 | X | O | X | O | X | O | X | 456.00 | ||||||||||||||||||||||||||||||||||||||||||||
| 448.00 | X | O | X | O | X | O | X | Mid | 448.00 | |||||||||||||||||||||||||||||||||||||||||||
| 440.00 | C | O | X | 2 | X | O | 440.00 | |||||||||||||||||||||||||||||||||||||||||||||
| 432.00 | X | 1 | O | 432.00 | ||||||||||||||||||||||||||||||||||||||||||||||||
| 424.00 | X | 424.00 | ||||||||||||||||||||||||||||||||||||||||||||||||||
| 416.00 | X | 416.00 | ||||||||||||||||||||||||||||||||||||||||||||||||||
| 408.00 | X | 408.00 | ||||||||||||||||||||||||||||||||||||||||||||||||||
| 400.00 | X | X | Bot | 400.00 | ||||||||||||||||||||||||||||||||||||||||||||||||
| 396.00 | X | O | X | 396.00 | ||||||||||||||||||||||||||||||||||||||||||||||||
| 392.00 | X | O | X | 392.00 | ||||||||||||||||||||||||||||||||||||||||||||||||
| 388.00 | X | O | X | 388.00 | ||||||||||||||||||||||||||||||||||||||||||||||||
| 384.00 | X | O | 384.00 | |||||||||||||||||||||||||||||||||||||||||||||||||
| 380.00 | • | X | 380.00 | |||||||||||||||||||||||||||||||||||||||||||||||||
| 376.00 | X | • | X | 376.00 | ||||||||||||||||||||||||||||||||||||||||||||||||
| 372.00 | X | O | • | X | 372.00 | |||||||||||||||||||||||||||||||||||||||||||||||
| 368.00 | X | O | • | X | 368.00 | |||||||||||||||||||||||||||||||||||||||||||||||
| 364.00 | X | O | • | • | X | 364.00 | ||||||||||||||||||||||||||||||||||||||||||||||
| 360.00 | • | X | X | O | X | • | X | • | X | 360.00 | ||||||||||||||||||||||||||||||||||||||||||
| 356.00 | X | X | X | • | X | O | X | O | 9 | X | O | A | O | X | • | 356.00 | ||||||||||||||||||||||||||||||||||||
| 352.00 | C | O | X | O | X | X | O | • | X | O | 7 | O | X | O | X | O | X | O | X | • | 352.00 | |||||||||||||||||||||||||||||||
| 348.00 | X | O | X | O | X | O | X | O | • | X | X | O | X | 8 | X | O | X | O | X | O | X | • | 348.00 | |||||||||||||||||||||||||||||
| 344.00 | X | X | O | O | X | O | X | O | • | X | O | X | O | X | O | X | O | O | O | X | • | 344.00 | ||||||||||||||||||||||||||||||
| 340.00 | X | O | X | O | X | 2 | O | X | O | X | • | X | O | X | O | X | O | X | O | X | • | 340.00 | ||||||||||||||||||||||||||||||
| 336.00 | X | O | X | O | X | O | X | X | O | X | O | X | O | • | X | 6 | O | O | X | • | O | B | • | 336.00 | ||||||||||||||||||||||||||||
| 332.00 | X | O | X | O | X | O | X | O | X | O | X | O | X | O | • | X | O | X | • | O | X | • | 332.00 | |||||||||||||||||||||||||||||
| 328.00 | X | X | O | 1 | O | X | O | X | O | X | O | X | O | • | X | O | • | O | X | • | 328.00 | |||||||||||||||||||||||||||||||
| 324.00 | X | O | X | O | O | O | X | 3 | • | O | X | X | • | • | X | X | • | O | • | 324.00 | ||||||||||||||||||||||||||||||||
| 320.00 | X | O | X | O | • | • | O | X | O | X | X | O | X | • | X | O | X | • | • | 320.00 | ||||||||||||||||||||||||||||||||
| 316.00 | X | O | X | • | O | X | O | X | O | X | O | X | O | X | O | X | • | 316.00 | ||||||||||||||||||||||||||||||||||
| 312.00 | X | O | • | O | O | X | O | X | 4 | X | O | X | O | X | • | 312.00 | ||||||||||||||||||||||||||||||||||||
| 308.00 | B | • | O | X | O | X | O | O | 5 | O | X | • | 308.00 | |||||||||||||||||||||||||||||||||||||||
| 304.00 | X | • | O | X | O | O | X | O | X | • | 304.00 | |||||||||||||||||||||||||||||||||||||||||
| 300.00 | X | • | O | O | X | O | X | • | 300.00 | |||||||||||||||||||||||||||||||||||||||||||
| 296.00 | X | • | O | • | O | • | 296.00 | |||||||||||||||||||||||||||||||||||||||||||||
| 292.00 | X | • | • | • | 292.00 | |||||||||||||||||||||||||||||||||||||||||||||||
| 288.00 | X | • | 288.00 | |||||||||||||||||||||||||||||||||||||||||||||||||
| 284.00 | X | • | 284.00 | |||||||||||||||||||||||||||||||||||||||||||||||||
| 280.00 | • | 280.00 | ||||||||||||||||||||||||||||||||||||||||||||||||||
| 23 | 24 |
| BMY Bristol-Myers Squibb Company ($53.98) - Drugs - BMY shares moved higher today to break a triple top at $54 to mark its first buy signal. This 0 for 5'er has been in a negative trend since February 2023 and on an RS sell signal versus the market since January 2017. BMY shares are trading in overbought territory with a weekly overbought/oversold reading of 57%. From here, support is offered at $48. |
| IOT Samsara, Inc. Class A ($38.90) - Software - IOT moved higher Friday after their earnings release to break a spread quadruple top at $37 before reaching a new all-time high at $39 intraday. This marks the fourth consecutive buy signal for the 5 for 5'er that has been in a positive trend since December 2022. Weekly momentum also recently flipped positive, suggesting the potential for further upside from here. The weight of the technical evidence is positive and improving. Initial support can be seen at $33 with further support offered from $32 to $30. |
| MOD Modine Manufacturing Company ($84.30) - Autos and Parts - MOD broke a double bottom at $88 for the first sell signal since November as the stock fell to $83. MOD still maintains a 5 attribute rating and ranks 2nd (out of 51) in the Autos and Parts. This is the first sell signal in a strong uptrend, so long-term holders of MOD are likely looking to hold here, while short-term holders may look to lock in their potential gain. Support now lies at $80 and $76. |
| Name | Option Symbol | Action | Stop Loss |
|---|---|---|---|
| CoStar Group Inc. - $86.11 | O: 24F85.00D21 | Buy the June 85.00 calls at 6.60 | 79.00 |
| Name | Option | Action |
|---|---|---|
| Edwards Lifesciences Corporation ( EW) | Jun. 87.50 Calls | Raise the option stop loss to 7.50 (CP: 9.50) |
| Alphabet Inc. Class A ( GOOGL) | Jun. 132.50 Calls | Initiate an option stop loss of 9.05 (CP: 11.05) |
| Name | Option Symbol | Action | Stop Loss |
|---|---|---|---|
| Alcoa Inc. - $29.84 | O: 24R30.00D21 | Buy the June 30.00 puts at 3.30 | 33.00 |
| Name | Option | Action |
|---|---|---|
| Bank of America ( BAC) | Apr. 33.00 Puts | Stopped at 36.00 (CP: 35.70) |
| Bristol-Myers Squibb Company ( BMY) | Jun. 50.00 Puts | Stopped at 54.00 (CP: 54.02) |
| Name | Option Sym. | Call to Sell | Call Price | Investment for 500 Shares | Annual Called Rtn. | Annual Static Rtn. | Downside Protection |
|---|---|---|---|---|---|---|---|
| Seagate Technology $ 93.81 | O: 24F95.00D21 | Jun. 95.00 | 6.65 | $ 43,663.15 | 26.85% | 22.51% | 6.08% |
| Name | Action |
|---|---|
| Cleveland-Cliffs Inc. ( CLF) - 20.93 | Sell the June 21.00 Calls. |
| Carnival Corporation ( CCL) - 15.66 | Sell the June 16.00 Calls. |
| Uber Technologies, Inc. ( UBER) - 79.41 | Sell the June 80.00 Calls. |
| Bath & Body Works Inc. ( BBWI) - 43.79 | Sell the June 47.50 Calls. |
| Applied Materials, Inc. ( AMAT) - 212.61 | Sell the June 210.00 Calls. |
| Trimble Inc. ( TRMB) - 62.50 | Sell the August 65.00 Calls. |
| The Gap, Inc. ( GPS) - 19.33 | Sell the June 20.00 Calls. |
| Western Digital Corporation ( WDC) - 64.28 | Sell the June 65.00 Calls. |
| Micron Technology, Inc. ( MU) - 98.98 | Sell the June 97.50 Calls. |
| Fifth Third Bancorp ( FITB) - 36.38 | Sell the June 37.00 Calls. |
| Name | Covered Write |
|---|---|
|
|
|
Daily Equity & Market Analysis
Loading, Please Wait...
