Most Requested Symbols

The curve has an average reading of 86.36%.
Today's featured stock is Brown & Brown, Inc. (BRO).
Comments include: APOG, AZO, CENX, FLEX, HSY, and OLLI.
Call: Asana Inc (ASAN); Put: Las Vegas Sands (LVS); Covered Write: Equitrans Midstream Corp (ETRN).
NDW Morning Update Video - December 18, 2023
NDW Morning Update Video – December 18, 2023.
Click here to download MP3
The S&P 500 Index SPX has seen a historic move higher over the past several weeks, as seen through the default point & figure chart. That chart reversed up from 4120 on October 31, and most recently topped out at 4720 with Thursday’s market action to mark 30 Xs in a single column. As you might imagine just by looking at the default chart, it is very rare to get that many Xs in a row. In fact, this is tied for the third largest X column dating back to 1927. The largest column of Xs the default chart has seen was on October 16, 2008, at 36 Xs. However, that was a very different X column as it was in the midst of a massive downdraft for SPX, with 48 consecutive Os in the immediately previous column. If we just look at X columns that are also on buy signals at the time of their conclusion, the current column is tied for the second largest. Other dates that saw large movement include February 1991 at 30, then May 1961 at 32.
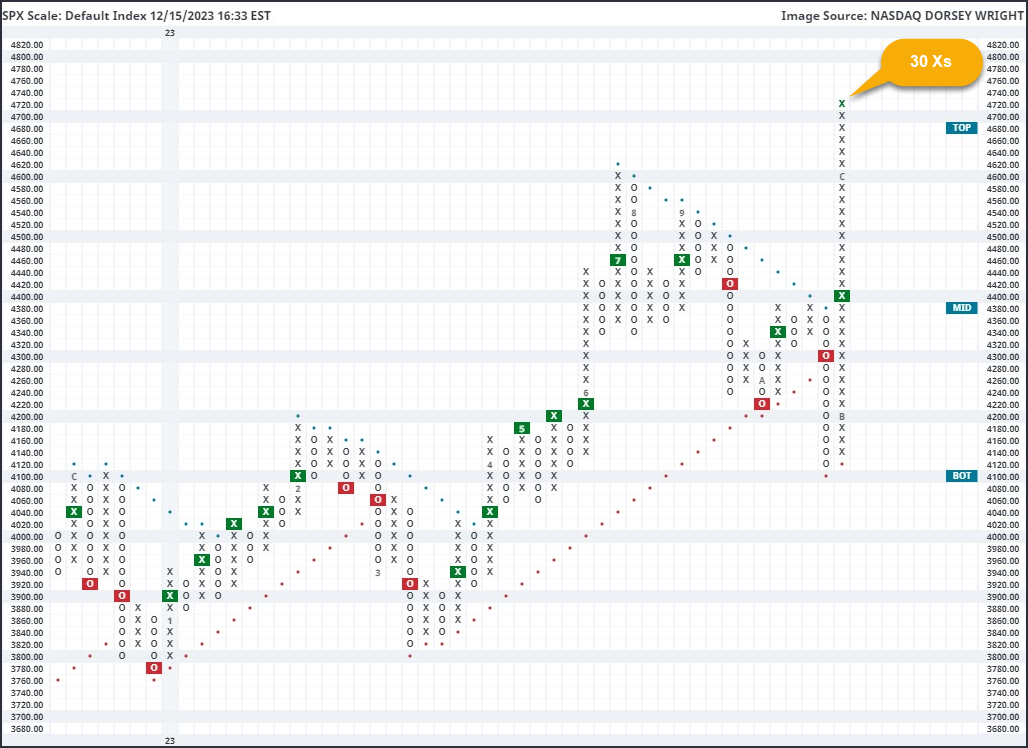
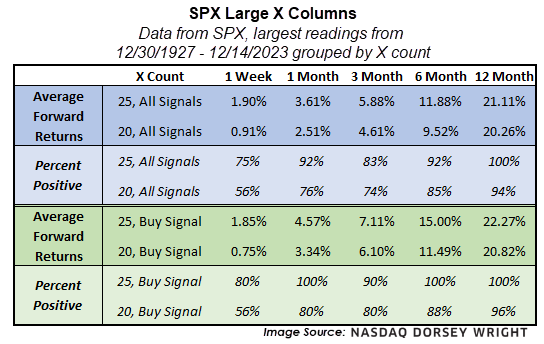
At first glance, seeing SPX sitting on such an extended column may seem a cause for concern. After all, we do not see initial support until the October low of 4120, which is also right at the bottom of the current trading band. The S&P 500 is also in heavily overbought territory, as we touched on in yesterday’s "Were You Aware?". With that said, massive columns of Xs typically are not followed by significant deterioration down the road. There have been 12 other times that SPX has seen at least 25 consecutive Xs on its default chart, with 10 of those instances occurring while the chart was also on a buy signal. Forward returns from those instances are typically very positive, seeing further improvement one month after each instance 92% of the time for any X column and 100% of the time for X columns on buy signals. This theme carries over if we look at just X columns that lasted for 20 Xs, which saw 34 total occurrences and 25 occurrences on buy signals. That led to an 76% positive hit rate one month out, which improves to 80% if we just look at the buy signal instances.

Equity and bond markets had another tremendous week. Most notably, the Russell 2000 (RUT) led the pack with a gain of 5.55% and the S&P 500 (SPX) added 2.49% to extend its weekly win streak to seven.
The bulk of market action this week came on Wednesday afternoon as the Fed wrapped up its December meeting, leaving rates unchanged as had widely been expected. Yields fell significantly following the meeting with the US Treasury 10YR Yield Index (TNX) and 30YR Yield Index (TYX) each breaking into negative Point & Figure trends.
The impetus for the rally in bonds (and equities) appeared to be the Fed’s statement of economic projections which showed FOMC’s median projection for the level of the Fed Funds in 2024 had fallen to 4.6%, down from 5.1% in September, implying roughly 75 basis points of cuts next year. While this is less than the 100-125 basis points of cuts the market had been pricing in, it shows that Fed officials do foresee lowering rates next year.
The Dow hit an all-time high this week and other major indices are not far off. Due to the widespread and aggressive advance, many of our technical indicators now sit in historically high field positions – and because sentiment tends to follow price, euphoria could be creeping into the minds of investors.
Howard Marks, American investor and co-founder of Oaktree Capital Management famously described the pendulum effect in markets, and Robert Kirby, an investment adviser in the late 1990s, gave one of the better interpretations:
“Long ago, I began to look at the stock market as a kind of pendulum swinging back and forth with no discernible pattern or rhythm. It swings between three o’clock on one side and nine o’clock on the other. At three o’clock, fear takes over and it’s full panic. At nine o’clock, greed takes over and it’s full manic. At six o’clock there’s a point where logic and balance exist and where valuations make a lot of sense to most rational people. Unfortunately, the pendulum doesn’t spend much time at six o’clock.”
One thing that could cause the current market pendulum (clock in the analogy above) to swing back in the other direction is an answer to a rather simple question: why are interest rates (and expectations for rates) coming down so quickly? We will share our thoughts with a few charts, per usual.
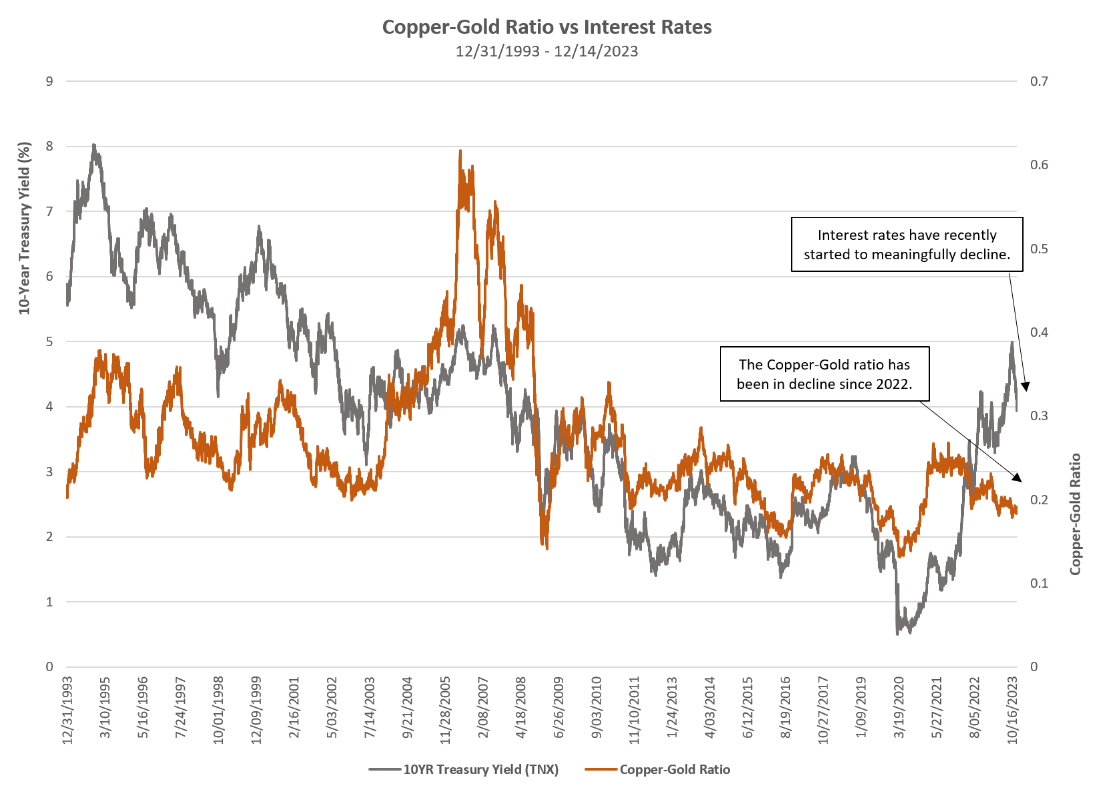
The copper-gold ratio (orange line in the image above) simply takes the price of copper (HG/), divides it by the price of gold (GC/), and plots the reading daily – very similar to our relative strength Point & Figure charts. When the ratio is rising that means copper is outperforming gold and when the ratio is falling that means gold is outperforming copper.
What is the significance? Gold is considered a safe haven for investors, and with far fewer industrial/economic uses, its role as a store of value is further emphasized. Rising gold prices have often signaled economic contraction and/or investor fear. Conversely, copper is a key industrial metal with countless economic applications, especially in building construction and electronics. Thus, copper tends to perform well when the economy is strong and/or when the economy is expected to be strong.
The grey line on the chart above is the US Treasury 10YR Yield (TNX). As we can see, interest rates tend to run parallel with the copper-gold ratio. Intuitively this makes sense because rising interest rates typically come during economic expansions and falling interest rates are often characteristic of accommodative monetary action taken during times of economic hardship.
The takeaway today is that the copper-gold ratio has been in a downtrend since early 2022 and is currently showing no technical signs of turning around. Interest rates have recently started to meaningfully decline and run parallel with the copper-gold ratio, which is in line with expectations.

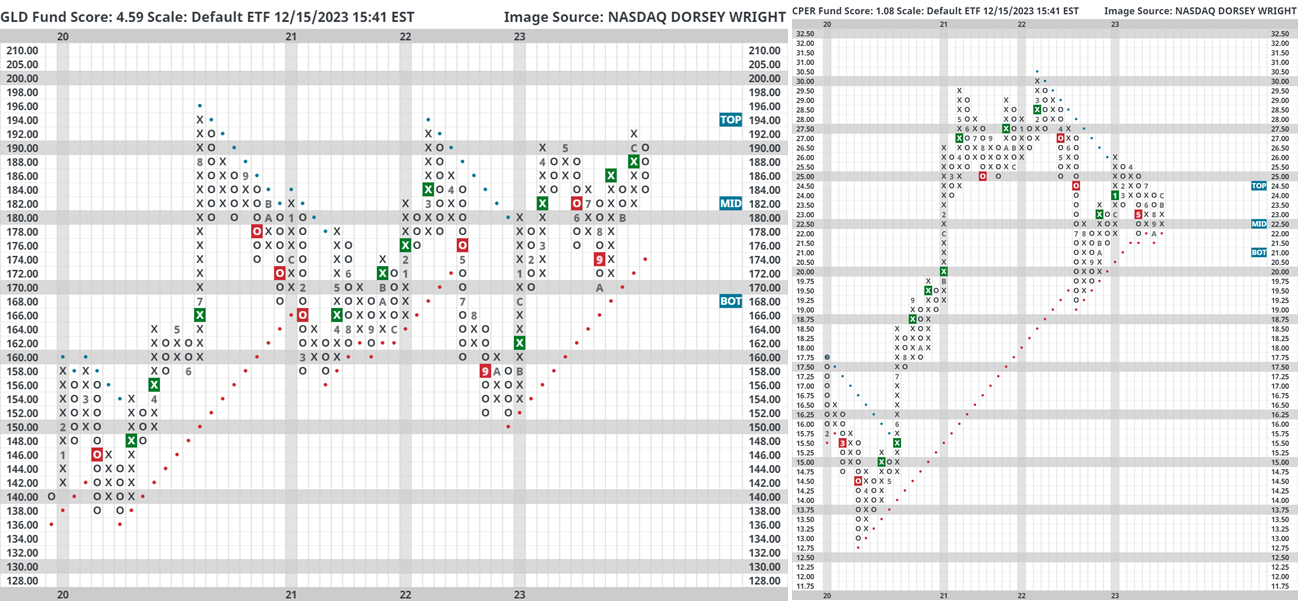
As it relates to equities, consider the image above. We constructed a relative strength chart between the United States Copper Index Fund (CPER) and the SPDR Gold Trust (GLD) on a 3.25% scale, which simply means that each column change (into either Xs or Os) requires about 10% of outperformance. When this chart is in Xs CPER is outperforming and when the chart is in Os GLD is outperforming. The buy/sell signals (green and red boxes, respectively) are objective long-term indications of relative price strength while the columns Xs/Os indicate shorter-term trends of relative price strength.
We also computed performance for the S&P 500 via cap weight ETF (SPY) and equal weight ETF (RSP). Note: before ETF inception we used underlying index data. While CPER was on a relative strength buy signal against GLD (green box on the chart) SPY generated an average return of 31.75% and a median return of 27.93%. While CPER was on a relative strength sell signal against GLD (red box on the chart) SPY generated an average return of 7.85% and median return of 15.02% - which is not bad, but materially lower than when on a buy signal. We observe similar performance patterns for RSP. The point being – we should want to see this turnaround in favor of copper.
Gold sits just shy of its all-time chart highs while copper is still trying to fight its way out of a downtrend that has been in place since April of 2022.
There will never be an “all clear” signal when investing and no two markets are the same. After all, there were plenty of periods in the table above where equities continued to perform well amidst relatively weak copper prices. The market is forward looking they say. So, simply consider today’s piece to be a conversation starter and perhaps serve as a reminder that after a rather euphoric week, it is not all sunshine and rainbows…especially in light of what investors may be inadvertently cheering for as interest rates (and expectations) plummet.
| Symbol | Name | Price | Yield | PnF Trend | RS Signal | RS Col. | Fund Score | 200 Day MA | Weekly Mom |
|---|---|---|---|---|---|---|---|---|---|
| DIA | SPDR Dow Jones Industrial Average ETF Trust | 373.33 | 1.87 | Positive | Sell | X | 4.24 | 340.67 | +7W |
| EEM | iShares MSCI Emerging Markets ETF | 40.22 | 2.26 | Negative | Sell | X | 2.97 | 39.07 | +7W |
| EFA | iShares MSCI EAFE ETF | 75.07 | 2.18 | Positive | Sell | X | 3.72 | 71.22 | +7W |
| FM | iShares Frontier and Select EM ETF | 26.76 | 1.93 | Positive | Sell | X | 2.98 | 26.00 | +6W |
| IJH | iShares S&P MidCap 400 Index Fund | 276.86 | 1.53 | Positive | Sell | X | 3.84 | 252.76 | +6W |
| IJR | iShares S&P SmallCap 600 Index Fund | 107.08 | 1.61 | Positive | Sell | O | 3.04 | 96.55 | +7W |
| QQQ | Invesco QQQ Trust | 403.39 | 0.56 | Positive | Buy | X | 5.73 | 353.71 | +7W |
| RSP | Invesco S&P 500 Equal Weight ETF | 157.53 | 1.72 | Positive | Buy | O | 3.79 | 145.23 | +7W |
| SPY | SPDR S&P 500 ETF Trust | 472.01 | 1.43 | Positive | Sell | X | 4.37 | 430.42 | +7W |
| XLG | Invesco S&P 500 Top 50 ETF | 37.27 | 1.02 | Positive | Buy | X | 5.46 | 33.80 | +7W |
The SPDR Dow Jones Industrial Average ETF Trust DIA remains in a column of X’s this week and rallied to a new all-time high at $370. This action brings DIA to its most overbought level since January 2018. The 4.24 fund score is above the average US score of 3.60. Support is now offered at $325 and $315, while the bullish support line lies at $310.
The iShares MSCI Emerging Markets ETF EEM remains in a column of X’s this week, moving up to the $40 level on the chart. EEM now scores just below the acceptable 3.0 threshold with a score posting of 2.97 but keep an eye on the US Dollar for further impacts on the international stage. The fund has support on its default chart at $36.50, the lows for the year.
The iShares MSCI EAFE ETF EFA remains in a column of X’s this week as it rallied to complete a triple top at $75, returning the fund to a buy signal and marking a 52-week high. EFA maintains an acceptable score of 3.72, which is above the average score for the All Global and International Diversified (3.03) group. The ETF remains in a positive trend at current levels with support offered at $66. Resistance lies at current chart levels with additional in the upper-$70s.
The iShares MSCI Frontier and Select EM ETF FM remains in a column of X’s this week, lying at $26.50. It remains on a buy signal after posting new 2023 highs at the end of July. The fund’s score sits just below the acceptable 3 threshold at 2.98, which is in line with the average Non-US funds group (2.98). Support is seen below at $24.50, the bullish support line and 2023 lows.
The iShares S&P MidCap 400 Index Fund IJH remains in a column of X’s this week, with the fund moving to a new 52-week high and breaking a triple top at $275. IJH now holds a score of 3.84, which is above the average Mid Cap (3.58) and US (3.60) fund groups. Resistance is found at current chart levels while additional can be found at $285 and $290, the ETF’s all-time high. The bullish support line is found at $235.
The iShares S&P SmallCap 600 Index Fund IJR remains in its respective column of Xs this week and rallied to $106. This clears resistance that dates to July this year and marks the highest level since February. IJR sits in a positive trend and on a pair of consecutive buy signals on its default chart. IJR holds an acceptable fund score of 3.04, but it resides below the average score for a Small Cap fund (3.33).
The Invesco QQQ Trust QQQ remains in X’s as it rallied to a 52-week high and matched the fund’s all-time high at $405. With that said, the fund still holds a strong 5.73 fund score, having maintained a buy signal since November and returned to an RS buy signal against SPXEWI earlier in October. QQQ continues to outpace the average US fund, which shows a 3.60 average score. From here, support is offered at $345.
The Invesco S&P 500 Equal Weight ETF RSP returned to a buy signal by breaking a spread triple top at $156 as the fund rallied to $158, a 52-week high. This also flips the trend back to positive and RSP now holds a positive 1.48 score direction and an acceptable 3.79 fund score. This is still behind the average S&P 500 Index fund score of 4.65, but equal weights have seen a nice uptick recently. Resistance lies at $160 and $164, the fund’s all-time chart high.
The SPDR S&P 500 ETF Trust SPY remains in its column of X’s this week as it rallied to $470, just one box below the fund’s all-time chart high at $475. The fund holds a strong 4.37 fund score, besting the average US fund score of 3.60. Support lies at $410 on the default chart, while the bullish support line resides at $405.
The Invesco S&P 500 Top 50 ETF XLG remains in its column of X’s this week as the fund rallied to a new all-time high at $37.50. XLG possesses a fund score of 5.46, besting the average US fund score of 3.60 and Growth fund of 4.20. From here, initial support is offered at $33, while the bullish support line lies at $30.

Average Level
86.36
| < - -100 | -100 - -80 | -80 - -60 | -60 - -40 | -40 - -20 | -20 - 0 | 0 - 20 | 20 - 40 | 40 - 60 | 60 - 80 | 80 - 100 | 100 - > |
|---|---|---|---|---|---|---|---|---|---|---|---|
|
Buy signalefa
|
|||||||||||
|
Buy signalspy
|
|||||||||||
|
Buy signaliwm
|
|||||||||||
|
Buy signaldvy
|
|||||||||||
|
Buy signalijh
|
|||||||||||
|
Buy signalief
|
|||||||||||
|
Buy signaltlt
|
|||||||||||
|
Buy signalijr
|
|||||||||||
|
Buy signalhyg
|
|||||||||||
|
Buy signalicf
|
|||||||||||
|
Buy signalXLG
|
Buy signalRSP
|
||||||||||
|
Buy signalvoog
|
Buy signalagg
|
||||||||||
|
Buy signalQQQ
|
Buy signalVOOV
|
||||||||||
|
Buy signalgsg
|
Sell signaleem
|
Buy signalshy
|
Buy signallqd
|
||||||||
|
Sell signaldx/y
|
Sell signalUSO
|
Sell signalgcc
|
Buy signalGLD
|
Sell signalfxe
|
Buy signaloneq
|
Buy signaldia
|
|||||
| < - -100 | -100 - -80 | -80 - -60 | -60 - -40 | -40 - -20 | -20 - 0 | 0 - 20 | 20 - 40 | 40 - 60 | 60 - 80 | 80 - 100 | 100 - > |
| AGG | iShares US Core Bond ETF |
| USO | United States Oil Fund |
| DIA | SPDR Dow Jones Industrial Average ETF |
| DVY | iShares Dow Jones Select Dividend Index ETF |
| DX/Y | NYCE U.S.Dollar Index Spot |
| EFA | iShares MSCI EAFE ETF |
| FXE | Invesco CurrencyShares Euro Trust |
| GLD | SPDR Gold Trust |
| GSG | iShares S&P GSCI Commodity-Indexed Trust |
| HYG | iShares iBoxx $ High Yield Corporate Bond ETF |
| ICF | iShares Cohen & Steers Realty ETF |
| IEF | iShares Barclays 7-10 Yr. Tres. Bond ETF |
| LQD | iShares iBoxx $ Investment Grade Corp. Bond ETF |
| IJH | iShares S&P 400 MidCap Index Fund |
| ONEQ | Fidelity Nasdaq Composite Index Track |
| QQQ | Invesco QQQ Trust |
| RSP | Invesco S&P 500 Equal Weight ETF |
| IWM | iShares Russell 2000 Index ETF |
| SHY | iShares Barclays 1-3 Year Tres. Bond ETF |
| IJR | iShares S&P 600 SmallCap Index Fund |
| SPY | SPDR S&P 500 Index ETF Trust |
| TLT | iShares Barclays 20+ Year Treasury Bond ETF |
| GCC | WisdomTree Continuous Commodity Index Fund |
| VOOG | Vanguard S&P 500 Growth ETF |
| VOOV | Vanguard S&P 500 Value ETF |
| EEM | iShares MSCI Emerging Markets ETF |
| XLG | Invesco S&P 500 Top 50 ETF |
| Symbol | Company | Sector | Current Price | Action Price | Target | Stop | Notes |
|---|---|---|---|---|---|---|---|
| GPK | Graphic Packaging Intl. | Forest Prods/Paper | $24.67 | 21 - 23 | 26 | 18 | #6 of 12 in favored FORE sector matrix, LT pos mkt RS, triple top, 1.3% yield |
| AIG | American International Group, Inc. | Insurance | $66.49 | hi 50s - low 60s | 68 | 52 | 4 for 5'er, top half of INSU sector matrix, LT pos mkt RS, multiple consec buy signals, 2.35% yield |
| COCO | Vita Coco Company, Inc. | Food Beverages/Soap | $26.97 | mid 20s | 36 | 23 | 4 for 5'er, top decile of FOOD sector matrix, multi consec buy signals, pullback from ATH |
| KRG | Kite Realty Group Trust | Real Estate | $23.43 | 19 - 21 | 34.50 | 16 | 5 for 5'er, 11 of 113 in REAL sector matrix, LT pos mkt RS, spread quintuple top, 4.65% yield |
| IONS | Ionis Pharmaceuticals Inc. | Biomedics/Genetics | $49.82 | 42 - hi 40s | 64 | 38 | 5 TA rating, top decile of BIOM matrix, consec. buy signals, LT RS buy |
| BG | Bunge Limited | Food Beverages/Soap | $105.31 | lo 100s - mid 110s. | 169 | 89 | 5 TA rating, top decile of FOOD sector matrix, consec. buy signals, LT mkt RS pos., R-R > 3 |
| OKE | ONEOK, Inc. | Gas Utilities | $68.61 | low-to-mid 60s | 89 | 55 | 5 for 5'er, top third of GUTI sector matrix, triple top, pullback to oversold, R-R>2.0, 5.8% yield |
| CME | CME Group, Inc. | Wall Street | $210.16 | 200s - mid 210s | 272 | 174 | 4 for 5'er, #5 of 32 in WALL sector matrix, one box from market RS buy, 2% yield |
| ORCL | Oracle Corporation | Software | $100.31 | mid 100s - mid 110s | 138 | 96 | LT pos mkt RS, trend chart signal flip, 1.5% yield |
| CDW | CDW Corp. | Computers | $220.44 | 200 - 220 | 278 | 184 | 4 for 5'er, top third of COMP sector matrix, LT pos mkt RS, triple top, 1.1% yield |
| CNC | Centene Corporation | Healthcare | $75.51 | hi 60s - hi 70s | 98 | 60 | 5 TA rating, top quintile of healthcare sector matrix, consec. buy signals, LT mkt RS buy |
| AEO | American Eagle Outfitters, Inc. | Retailing | $20.61 | 16 - 19.50 | 33 | 14 | 5 TA rating, top quintile of RETA sector matrix, consec. buy signals, R-R > 3.5. |
| AMZN | Amazon.com Inc. | Internet | $147.44 | 140 - lo 150s | 200 | 118 | 4 TA rating, top 25% of INET sector matrix, consec. buy signals, LT pos trend |
| SBUX | Starbucks Corporation | Restaurants | $97.84 | mid 90s - mid 100s | 137 | 82 | 4 TA rating, top 33% of REST sector matrix, LT RS buy, buy-on-pullback, R-R > 2 |
| DELL | Dell Technologies Inc Class C | Computers | $72.43 | mid 60s - lo 70s | 101 | 52 | 5 TA rating, top 20% of COMP sector matrix, buy-on-pullback, R-R > 2 |
| ORLY | O'Reilly Automotive, Inc. | Autos and Parts | $951.12 | 912 - 992 | 1264 | 792 | 5 for 5'er, Mkt. RS Buy since 9/2002, Peer RS Buy since 8/2011, Pullback from Recent ATH. |
| FLR | Fluor Corporation | Building | $39.67 | hi 30s | 49 | 32 | 4 for 5'er, top half of favored BUIL sector matrix, spread quad top breakout |
| GIL | Gildan Activewear | Textiles/Apparel | $33.07 | lo-mid 30s | 58 | 26 | 5 TA rating, top half of TEXT sector matrix, LT RS buy, buy-on-pullback, R-R > 2 |
| ACHC | Acadia Healthcare Company Inc | Healthcare | $77.60 | 70s | 90 | 66 | 4 for 5'er, top third of HEAL sector matrix, LT pos mkt RS, pos trend flip, triple top |
| CWAN | Clearwater Analytics Holdings, Inc. Class A | Finance | $19.70 | 18 - lo 20s | 27.50 | 16 | 5 TA rating, top half of Finance sector matrix, consec. buys, buy-on-pullback, R-R > 2. |
| BRO | Brown & Brown, Inc. | Insurance | $71.96 | hi 60s - low 70s | 95 | 59 | 5 for 5'er, top half of INSU sector matrix, LT pos mkt RS, pullback from ATH, R-R>2.0. |
| Symbol | Company | Sector | Current Price | Action Price | Target | Stop | Notes |
|---|
| Comment | |||||||
|---|---|---|---|---|---|---|---|
|
|
|||||||
BRO Brown & Brown, Inc. R ($69.46) - Insurance - BRO is a 5 for 5'er that ranks in the top half of the insurance sector matrix and has been on a market RS buy signal since 2018. The stock reached a new all-time high earlier this month after spread triple top at $75 and has now pulled back just below the middle of its trading band, offering an entry point for long exposure. Positions may be added in the upper $60s to low $70s and we will set our initial stop at $59, the potential trend line violation on BRO's default chart. We will use the bullish price objective, $95, as our target price giving us a reward-to-risk ratio north of 2.0.
| 21 | 22 | 23 | ||||||||||||||||||||||||||||||||||||||||||||||||||
| 76.00 | C | 76.00 | ||||||||||||||||||||||||||||||||||||||||||||||||||
| 75.00 | X | O | 75.00 | |||||||||||||||||||||||||||||||||||||||||||||||||
| 74.00 | X | X | X | O | 74.00 | |||||||||||||||||||||||||||||||||||||||||||||||
| 73.00 | X | O | 8 | O | X | O | 73.00 | |||||||||||||||||||||||||||||||||||||||||||||
| 72.00 | X | O | X | O | X | X | O | 72.00 | ||||||||||||||||||||||||||||||||||||||||||||
| 71.00 | X | 4 | X | 9 | X | O | B | Mid | 71.00 | |||||||||||||||||||||||||||||||||||||||||||
| 70.00 | X | X | X | O | 7 | O | X | O | X | 70.00 | ||||||||||||||||||||||||||||||||||||||||||
| 69.00 | X | O | X | O | X | O | X | A | O | X | 69.00 | |||||||||||||||||||||||||||||||||||||||||
| 68.00 | X | X | O | X | O | 3 | X | O | X | X | O | X | 68.00 | |||||||||||||||||||||||||||||||||||||||
| 67.00 | X | C | O | X | 1 | X | 2 | O | X | O | X | O | X | O | X | O | 67.00 | |||||||||||||||||||||||||||||||||||
| 66.00 | X | O | X | O | X | O | X | O | X | O | X | O | X | O | 8 | O | X | X | X | 66.00 | ||||||||||||||||||||||||||||||||
| 65.00 | X | O | X | O | O | X | O | X | O | X | O | X | O | X | O | X | O | 5 | O | 6 | 65.00 | |||||||||||||||||||||||||||||||
| 64.00 | X | O | X | O | X | O | X | O | X | O | X | O | X | O | X | O | X | X | O | X | Bot | 64.00 | ||||||||||||||||||||||||||||||
| 63.00 | X | O | X | O | X | O | X | O | O | X | O | X | 9 | O | X | O | X | X | • | X | O | X | 63.00 | |||||||||||||||||||||||||||||
| 62.00 | X | B | O | O | O | O | X | O | A | O | X | O | X | O | X | • | X | O | 62.00 | |||||||||||||||||||||||||||||||||
| 61.00 | X | 5 | X | O | X | O | X | O | X | O | X | O | X | 61.00 | ||||||||||||||||||||||||||||||||||||||
| 60.00 | X | O | 7 | O | X | O | O | O | X | O | X | • | 60.00 | |||||||||||||||||||||||||||||||||||||||
| 59.00 | 9 | A | O | X | X | O | O | X | X | X | 1 | O | X | • | 59.00 | |||||||||||||||||||||||||||||||||||||
| 58.00 | X | O | X | O | X | O | X | O | X | O | X | O | X | O | X | O | 4 | • | 58.00 | |||||||||||||||||||||||||||||||||
| 57.00 | 8 | O | X | O | X | O | X | O | X | O | X | O | X | O | X | 2 | X | • | 57.00 | |||||||||||||||||||||||||||||||||
| 56.00 | X | O | O | X | 6 | X | O | X | B | X | O | • | C | • | O | X | • | 56.00 | ||||||||||||||||||||||||||||||||||
| 55.00 | X | O | X | O | X | O | X | O | • | • | • | 3 | X | • | 55.00 | |||||||||||||||||||||||||||||||||||||
| 54.00 | 5 | 7 | O | O | X | O | • | O | X | • | 54.00 | |||||||||||||||||||||||||||||||||||||||||
| 53.00 | X | O | X | O | • | O | • | 53.00 | ||||||||||||||||||||||||||||||||||||||||||||
| 52.00 | X | O | X | • | • | 52.00 | ||||||||||||||||||||||||||||||||||||||||||||||
| 51.00 | X | O | • | 51.00 | ||||||||||||||||||||||||||||||||||||||||||||||||
| 50.00 | X | • | 50.00 | |||||||||||||||||||||||||||||||||||||||||||||||||
| 49.00 | X | • | 49.00 | |||||||||||||||||||||||||||||||||||||||||||||||||
| 48.00 | 1 | 4 | • | 48.00 | ||||||||||||||||||||||||||||||||||||||||||||||||
| 47.00 | O | X | O | X | • | 47.00 | ||||||||||||||||||||||||||||||||||||||||||||||
| 46.00 | O | X | O | X | • | 46.00 | ||||||||||||||||||||||||||||||||||||||||||||||
| 45.00 | O | O | X | • | 45.00 | |||||||||||||||||||||||||||||||||||||||||||||||
| 44.00 | O | X | • | 44.00 | ||||||||||||||||||||||||||||||||||||||||||||||||
| 43.00 | 2 | • | 43.00 | |||||||||||||||||||||||||||||||||||||||||||||||||
| 42.00 | • | 42.00 | ||||||||||||||||||||||||||||||||||||||||||||||||||
| 21 | 22 | 23 |

| APOG Apogee Enterprises, Inc. ($51.56) - Building - APOG broke a triple top at $52 to return to a buy signal. This follows the stock testing the bullish support line back in October and it marks a multi-year high for the stock. APOG is a 4 for 5'er that ranks in the bottom half of the Building sector matrix, so other stocks within the industry group maintain superior RS. Support on the chart lies at the bullish support line at $42. |
| AZO Autozone, Inc. ($2,616.62) - Autos and Parts - AZO reversed into Os and broke a double bottom at $2592. This follows the stock meeting resistance on three occasions in the past couple of months at $2720. AZO is a 4 for 5'er that sits in the bottom half of the Autos and Parts sector matrix, but the stock now lies within one box of its bullish support line. From here, a move below $2528 on the chart would flip the trend to negative. Beyond the bullish support line at $2560, additional support lies at $2400. |
| CENX Century Aluminum Co ($9.74) - Metals Non Ferrous - CENX returned to a buy signal on Friday when it broke a double top at $10. The overall technical picture remains negative, however, as CENX is a 2 for 5'er trading in a negative trend. From here, the stock faces overhead resistance at $12.50, while support can be found at $6. |
| FLEX Flex Ltd ($28.88) - Electronics - FLEX moved higher Friday to break a double top at $29, marking a second consecutive buy signal and a new multi-year high. This 5 for 5'er moved to a positive trend in August 2022 and sits in the top half of the electronics sector RS matrix. The weight of the technical evidence is positive, however, FLEX is now in overbought territory. Those looking to add exposure may be best served waiting for a pullback or normalization in the trading band. Initial support is seen at $24. |
| HSY The Hershey Company ($182.10) - Food Beverages/Soap - HSY shares returned to a sell signal on Friday with a double bottom break at $184; the 2 for 5'er now rests at 2023 lows. Avoid. Further bearish confirmation would come with a move past $180. |
| OLLI Ollies Bargain Outlet Holding Inc. ($69.21) - Retailing - OLLI reversed into Os and broke a spread quadruple bottom at $71 as the stock fell to $70. This is the second sell signal for the stock and breakdown also violates the bullish support line. The trend flip will drop the stock to a 2 for 5'er, and this follows market and peer RS chart reversals into Os. OLLI lies at the lowest level since July of this year, and support on the default chart isn't found until $58. Additional support lies in the lower-$50s. |
| Name | Option Symbol | Action | Stop Loss |
|---|---|---|---|
| Asana, Inc. Class A - $19.98 | O: 24B20.00D16 | Buy the February 20.00 calls at 1.75 | 18.00 |
| Name | Option | Action |
|---|---|---|
| Broadcom Ltd ( AVGO) | Mar. 920.00 Calls | Raise the option stop loss to 208.00 (CP: 228.40) |
| Meta Platform Inc. ( META) | Mar. 320.00 Calls | Raise the option stop loss to 32.05 (CP: 34.05) |
| Applied Materials, Inc. ( AMAT) | Apr. 155.00 Calls | Raise the option stop loss to 15.15 (CP: 17.15) |
| Name | Option Symbol | Action | Stop Loss |
|---|---|---|---|
| Las Vegas Sands Corp. - $47.87 | O: 24O50.00D15 | Buy the March 50.00 puts at 3.80 | 51.00 |
| Name | Option | Action |
|---|---|---|
| Exelon Corporation (EXC) | Jan. 39.00 Puts | Initiate an option stop loss of 2.30 (CP: 3.30) |
| Willis Towers Watson PLC (WTW) | Apr. 240.00 Puts | Initiate an option stop loss of 9.60 (CP: 11.60) |
| Name | Option Sym. | Call to Sell | Call Price | Investment for 500 Shares | Annual Called Rtn. | Annual Static Rtn. | Downside Protection |
|---|---|---|---|---|---|---|---|
| Equitrans Midstream Corp. $10.06 | O: 24B10.00D16 | Feb. 10.00 | 0.55 | $4,737.35 | 26.06% | 27.23% | 4.49% |
| Name | Action |
|---|---|
| Amazon.com Inc. (AMZN) - 147.44 | Sell the March 150.00 Calls. |
| Dexcom Inc. (DXCM) - 123.10 | Sell the March 120.00 Calls. |
| Airbnb, Inc. Class A (ABNB) - 147.37 | Sell the March 150.00 Calls. |
| Royal Caribbean Cruises Ltd. (RCL) - 121.39 | Sell the March 125.00 Calls. |
| Cleveland-Cliffs Inc. (CLF) - 18.87 | Sell the April 19.00 Calls. |
| Name | Covered Write |
|---|---|
| Western Digital Corporation ( WDC - 51.16 ) | April 55.00 covered write. |
Daily Equity & Market Analysis
Loading, Please Wait...
