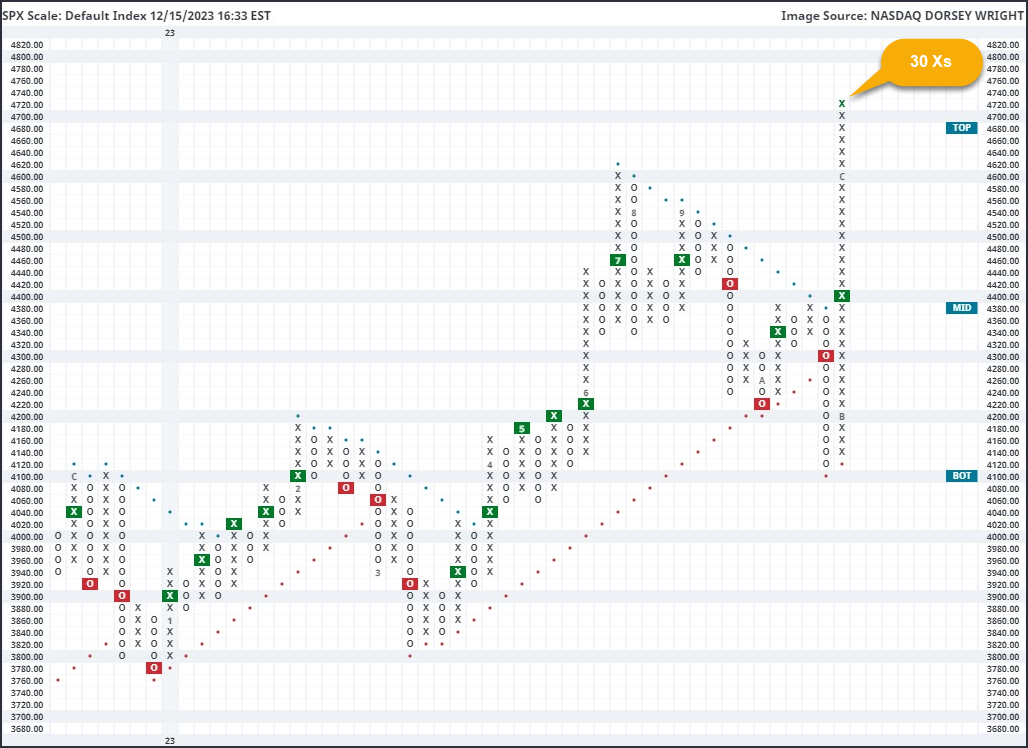
The S&P 500 Index default chart sits on 30 Xs in a single column, marking one of the largest X columns we have seen.
The S&P 500 Index SPX has seen a historic move higher over the past several weeks, as seen through the default point & figure chart. That chart reversed up from 4120 on October 31, and most recently topped out at 4720 with Thursday’s market action to mark 30 Xs in a single column. As you might imagine just by looking at the default chart, it is very rare to get that many Xs in a row. In fact, this is tied for the third largest X column dating back to 1927. The largest column of Xs the default chart has seen was on October 16, 2008, at 36 Xs. However, that was a very different X column as it was in the midst of a massive downdraft for SPX, with 48 consecutive Os in the immediately previous column. If we just look at X columns that are also on buy signals at the time of their conclusion, the current column is tied for the second largest. Other dates that saw large movement include February 1991 at 30, then May 1961 at 32.
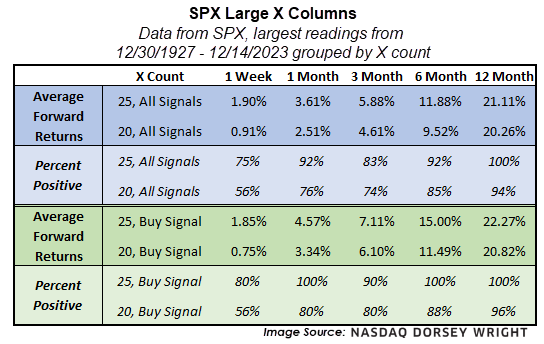
At first glance, seeing SPX sitting on such an extended column may seem a cause for concern. After all, we do not see initial support until the October low of 4120, which is also right at the bottom of the current trading band. The S&P 500 is also in heavily overbought territory, as we touched on in yesterday’s "Were You Aware?". With that said, massive columns of Xs typically are not followed by significant deterioration down the road. There have been 12 other times that SPX has seen at least 25 consecutive Xs on its default chart, with 10 of those instances occurring while the chart was also on a buy signal. Forward returns from those instances are typically very positive, seeing further improvement one month after each instance 92% of the time for any X column and 100% of the time for X columns on buy signals. This theme carries over if we look at just X columns that lasted for 20 Xs, which saw 34 total occurrences and 25 occurrences on buy signals. That led to an 76% positive hit rate one month out, which improves to 80% if we just look at the buy signal instances.