Most Requested Symbols

The Fed has embraced a “data dependent” approach when it comes to making policy decisions and with a CPI release Tuesday morning, it’s a good time to see where the data stands.
We are excited to bring you the new NDW Help Center, allowing for more efficient assistance with platform-related questions.
The average distribution level is 49.23% overbought.
Today's featured stock is Gildan Activewear (GIL).
ADBE, CQP, FIZZ, ITW, RL, ZS
Call: Applied Materials (AMAT); Put: Southwest Airlines (LUV); Covered Write: Royal Caribbean (RCL)
NDW Morning Update Video - December 13, 2023
NDW Morning Update Video – December 13, 2023.
Click here to download MP3
US Equity indices started off the week on a positive note with the S&P 500 Index SPX adding 39 basis points while Gold GC/ led broader Commodity indices into negative territory. This is a continuation of divergence between US Equity and Commodity indices, with Gold GC/ and Crude Oil CL/ being notable movers to the downside, shedding roughly 3% and 6% since the beginning of December. This divergence has led Domestic Equities to overtake Commodities within DALI for 2nd in the asset class rankings. Technically, the two asset classes are tied at 242 tally signals, but Domestic Equity’s recent rally has led to positive near-term RS for the asset class compared to Commodities and it to be favored in the tiebreaker.
Last week, International Equities moved up to the number 1 spot within DALI and it currently leads Domestic Equities and Commodities by 3 tally signals. This brings what has been a tight margin between the 1st and 3rd ranked asset classes since the beginning of November, to an even tighter margin. This technically is not the tightest margin between 1st and 3rd in DALI, but it counts as only the fifth day in DALI’s asset class history the top three asset classes have been separated by 3 or fewer tally signals. The narrowest margin between the top three asset classes occurred on August 16th, 2016, when Commodities sat in 1st at 227 tally signals, Domestic Equities was in 2nd at 226, and Fixed Income was in 3rd at 225. Domestic Equities emerged as the top asset class from that period and maintained the top spot for roughly 3.5 years.

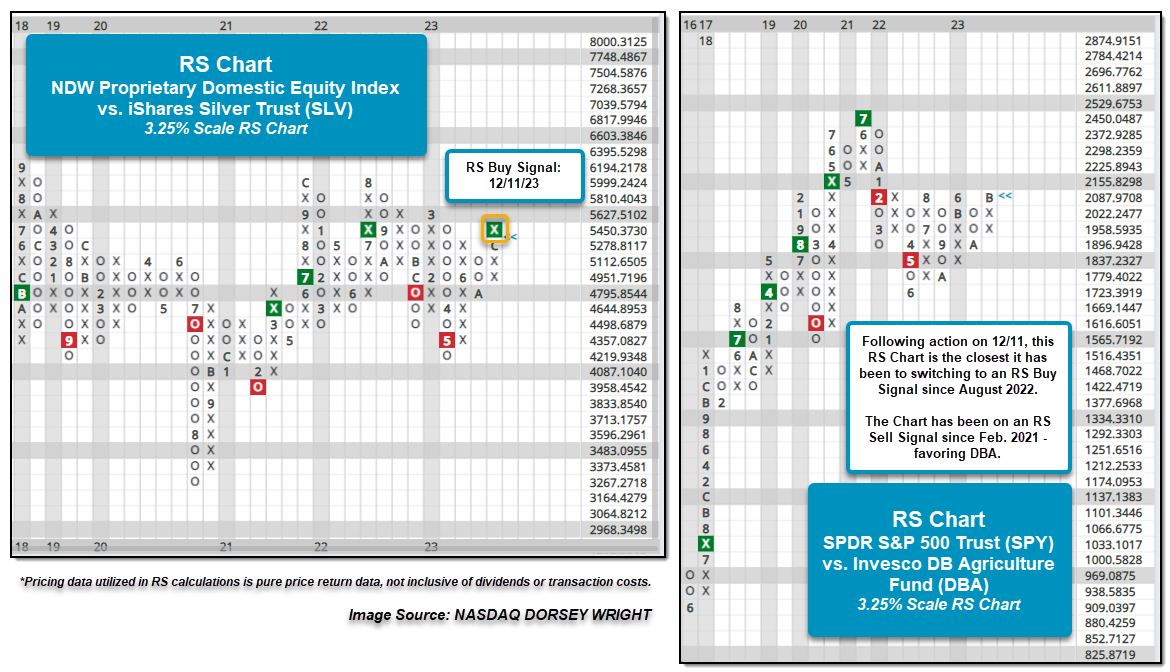
Among the RS charts to flip recently to favor US Equities compares the NDW Proprietary Domestic Equity Index against the iShares Silver Trust SLV on a 3.25% scale. The chart moved back to a buy signal following Monday’s action after having been on an RS sell signal since December last year. As noted above, Gold, along with Silver, have carried the precious metals space lower and were the primary subgroup of Commodities to lose signals as of late. Precious Metals have not been the only space losing ground on a relative basis as Crude Oil CL/ has shed almost 20% over the past 90-day roll, and the stalwart of the broader asset class, agriculture, has begun to shed some of its superior strength. An RS chart we have noted before compares the SPDR S&P 500 Trust SPY against the Invesco DB Agriculture Fund DBA, and following Monday’s action, it is the closest the RS chart has been to an RS buy signal since August 2022. Currently, the RS chart is just over 1% away from returning to a buy signal and potentially favoring SPY for the first time in 22 months.

Last week we discussed the market’s expectations and the Fed regarding monetary policy. In short, the market was expecting rate cuts to begin early next year and strong odds the Fed Funds rate would be cut by at least 100 basis points by the end of next year. However, the Fed has reiterated the need for interest rates to remain high until inflation drops back to its 2% target. The Fed has embraced a “data dependent” approach when it comes to making policy decisions and with a CPI release Tuesday morning, it’s a good time to see where the data stands. Last week it was mentioned that any data showing signs that the Fed may need to hold rates higher for longer than the market expected would likely be bad for assets, especially bonds which were coming off one of their best monthly performances in decades and already in extended territory.
Digging into this month’s CPI data, the overall direction of inflation is still lower but was not as encouraging as many were expecting. The YoY percent change for All Items ticked lower thanks mostly to declining energy prices with the MoM change coming in at 0.1%. However, outside of energy prices, most major categories moved higher with the less volatile All Items Less Food and Energy posting a YoY change of 4% and a MoM change of 0.3%. In the grand scheme of things, most of the data still shows that inflation is on a path to head back down to the 2% target. Aside from energy prices taking a major downtick, food prices have moderated with a MoM reading in October of 0% and a November reading of 0.1%. Shelter costs remain a thorn in the Fed’s side, however, the shelter reading has notable lagging components that go into its calculation, so that is something to keep in mind. To reiterate, this wasn’t a bad print for the general trend of inflation heading lower, however, it wasn’t as strong of a print as we’ve seen either and market expectations have shifted on the news.

With respect to market expectations, last week it was mentioned that market participants were pricing in a 60% chance the Fed made an interest rate cut by March, those odds are now down to 40% (CME). Not an extreme change, but not something to scoff at either. Getting back to a point made earlier, energy prices were a major contributing factor to headline inflation only showing a slight increase of 0.1% rather than closer to the ex-food and energy number of 0.3%. Much of the decrease in energy prices can be attributed to a clearer picture of the conflict in Israel as well as weak economic numbers coming from places like China and Europe stoking demand concerns. However, crude oil is now trading below $70 again for the first time since July. The mid-60s have been a support area for crude oil this year, so further downside, at least to the extent we’ve seen since October, may be harder to come by. While energy has been a big boost to lower inflation numbers, those gains shouldn’t be counted on to continue given where Crude Oil (CL/) is trading. Also mentioned last week, the market shrugged off initial news from OPEC+ regarding more supply cuts, however, OPEC+ has shown a willingness to take measures to defend prices, especially at these levels. For example, Saudi Arabia announced a voluntary cut in June this year when crude oil was trading at around $70 per barrel.

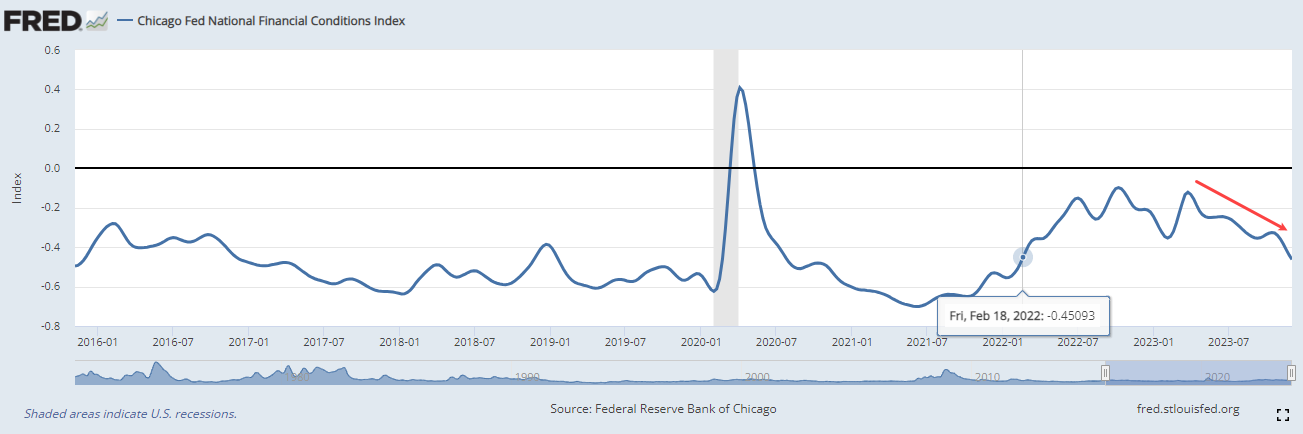
Not shown in the CPI data, the Fed keeps track of financial conditions. One of the main ideas behind raising interest rates is that it tightens financial conditions thus leading to less economic activity and lower inflation. However, according to the Chicago Fed’s National Financial Conditions Index, financial conditions have loosened consistently since March and are now the loosest they’ve been since February 2022. This can be seen in the chart below; negative readings signify financial conditions are looser than average while the opposite is true for positive readings. The most recent dive lower is likely due to interest rates falling since October as market participants began pricing in interest rate cuts early next year. Paradoxically, the market expecting lower interest rates has created a reason for interest rates to stay higher for longer. Due to loosening financial conditions as the market expects lower interest rates are soon on the horizon, the Fed is now forced to try to tighten financial conditions through policy or rhetoric.
At this point in time, it seems still unlikely that the Fed has another rate hike up its sleeve but it can say it won’t cut interest rates noting that financial conditions have loosened. Wednesday’s FOMC meeting will potentially shed some light on the Fed’s outlook given the looser financial conditions and the market’s expectations for rate cuts. Inflation data continues to show a general decline albeit at a slower pace than many expected from the data this morning. Energy prices were the biggest contributor to a low headline number, but continued downside may be difficult to come by as crude oil approached long-term support. Overall, the market hasn’t changed its view too much on the expectation of multiple rate cuts next year, but it has pushed them out further with Tuesday’s CPI data.
We are very excited to announce the launch of the NDW Help Center, designed to make it much easier to find answers to your Nasdaq Dorsey Wright-related questions. The Help Center will feature a searchable knowledge base of helpful articles and frequently asked questions related to the NDW platform. From the Help Center, you will also be able to submit support requests if you have issues or questions that are not currently covered in our knowledge base articles. Submitting support requests via the Help Center will help us connect you with the correct NDW subject matter expert and allow us to track and correct common issues impacting our users more easily.

There are a few different ways to access the Help Center from the platform. The first is via the Resource Center (the blue XO icon in the bottom right corner).
When you open the Help Center in the Resource Center, it will suggest Help Center articles related to the page you are currently on. Some suggested articles can be seen below when accessing the Help Center from the Portfolios page. You can also use the search bar at the top if your question is not answered by the suggested articles.
You can also hit the “Contact Us” button to submit a support request directly from the Resource Center.

Links to the Help Center can also be found under the Resources tab and the help icon in the top right corner of the platform.
One final thing we wanted to make sure to highlight with the launch of the Help Center is the difference between submitting requests via the Help Center and via the Feedback Portal. The Help Center is for your everyday support requests and things you would want immediate assistance with- tech issues, billing questions, questions for the analysts, etc.
The Feedback Portal, on the other hand, should be used for suggesting product features or enhancements, such as “I’d love to see technical attribute changes overlayed on a stock’s chart like the signal trail.”
We will be continuing to add new articles to the Help Center based on user questions and submitted support tickets, so please let us know what tools or topics would be helpful to cover in more detail.

Average Level
49.23
| < - -100 | -100 - -80 | -80 - -60 | -60 - -40 | -40 - -20 | -20 - 0 | 0 - 20 | 20 - 40 | 40 - 60 | 60 - 80 | 80 - 100 | 100 - > |
|---|---|---|---|---|---|---|---|---|---|---|---|
|
Buy signaliwm
|
|||||||||||
|
Buy signalvoog
|
|||||||||||
|
Buy signalXLG
|
|||||||||||
|
Buy signalief
|
|||||||||||
|
Buy signalijr
|
|||||||||||
|
Sell signalijh
|
|||||||||||
|
Buy signaloneq
|
|||||||||||
|
Sell signaldvy
|
|||||||||||
|
Buy signalQQQ
|
|||||||||||
|
Buy signaltlt
|
|||||||||||
|
Buy signalicf
|
|||||||||||
|
Sell signalefa
|
Buy signalspy
|
||||||||||
|
Sell signalgcc
|
Buy signalGLD
|
Buy signalhyg
|
Sell signalRSP
|
Buy signalVOOV
|
|||||||
|
Buy signalgsg
|
Sell signalUSO
|
Sell signaldx/y
|
Sell signalfxe
|
Sell signaleem
|
Buy signalshy
|
Buy signalagg
|
Buy signallqd
|
Buy signaldia
|
|||
| < - -100 | -100 - -80 | -80 - -60 | -60 - -40 | -40 - -20 | -20 - 0 | 0 - 20 | 20 - 40 | 40 - 60 | 60 - 80 | 80 - 100 | 100 - > |
| AGG | iShares US Core Bond ETF |
| USO | United States Oil Fund |
| DIA | SPDR Dow Jones Industrial Average ETF |
| DVY | iShares Dow Jones Select Dividend Index ETF |
| DX/Y | NYCE U.S.Dollar Index Spot |
| EFA | iShares MSCI EAFE ETF |
| FXE | Invesco CurrencyShares Euro Trust |
| GLD | SPDR Gold Trust |
| GSG | iShares S&P GSCI Commodity-Indexed Trust |
| HYG | iShares iBoxx $ High Yield Corporate Bond ETF |
| ICF | iShares Cohen & Steers Realty ETF |
| IEF | iShares Barclays 7-10 Yr. Tres. Bond ETF |
| LQD | iShares iBoxx $ Investment Grade Corp. Bond ETF |
| IJH | iShares S&P 400 MidCap Index Fund |
| ONEQ | Fidelity Nasdaq Composite Index Track |
| QQQ | Invesco QQQ Trust |
| RSP | Invesco S&P 500 Equal Weight ETF |
| IWM | iShares Russell 2000 Index ETF |
| SHY | iShares Barclays 1-3 Year Tres. Bond ETF |
| IJR | iShares S&P 600 SmallCap Index Fund |
| SPY | SPDR S&P 500 Index ETF Trust |
| TLT | iShares Barclays 20+ Year Treasury Bond ETF |
| GCC | WisdomTree Continuous Commodity Index Fund |
| VOOG | Vanguard S&P 500 Growth ETF |
| VOOV | Vanguard S&P 500 Value ETF |
| EEM | iShares MSCI Emerging Markets ETF |
| XLG | Invesco S&P 500 Top 50 ETF |
| Symbol | Company | Sector | Current Price | Action Price | Target | Stop | Notes |
|---|---|---|---|---|---|---|---|
| GPK | Graphic Packaging Intl. | Forest Prods/Paper | $23.34 | 21 - 23 | 26 | 18 | #6 of 12 in favored FORE sector matrix, LT pos mkt RS, triple top, 1.3% yield |
| AIG | American International Group, Inc. | Insurance | $66.18 | hi 50s - low 60s | 68 | 52 | 4 for 5'er, top half of INSU sector matrix, LT pos mkt RS, multiple consec buy signals, 2.35% yield |
| COCO | Vita Coco Company, Inc. | Food Beverages/Soap | $27.41 | mid 20s | 36 | 23 | 4 for 5'er, top decile of FOOD sector matrix, multi consec buy signals, pullback from ATH |
| KRG | Kite Realty Group Trust | Real Estate | $21.94 | 19 - 21 | 34.50 | 16 | 5 for 5'er, 11 of 113 in REAL sector matrix, LT pos mkt RS, spread quintuple top, 4.65% yield |
| IONS | Ionis Pharmaceuticals Inc. | Biomedics/Genetics | $49.19 | 42 - hi 40s | 64 | 38 | 5 TA rating, top decile of BIOM matrix, consec. buy signals, LT RS buy |
| BG | Bunge Limited | Food Beverages/Soap | $105.00 | lo 100s - mid 110s. | 169 | 89 | 5 TA rating, top decile of FOOD sector matrix, consec. buy signals, LT mkt RS pos., R-R > 3 |
| FDX | FedEx Corporation | Aerospace Airline | $271.38 | lo 230s - mid 250s | 364 | 190 | 4 TA rating, top 25% of AERO sector matrix, shakeout buy point, positive mkt RS, R-R > 2, Earn. 12/19 |
| OKE | ONEOK, Inc. | Gas Utilities | $67.23 | low-to-mid 60s | 89 | 55 | 5 for 5'er, top third of GUTI sector matrix, triple top, pullback to oversold, R-R>2.0, 5.8% yield |
| CME | CME Group, Inc. | Wall Street | $215.43 | 200s - mid 210s | 272 | 174 | 4 for 5'er, #5 of 32 in WALL sector matrix, one box from market RS buy, 2% yield |
| ORCL | Oracle Corporation | Software | $115.13 | mid 100s - mid 110s | 138 | 96 | 5 for 5'er, top half of SOFT sector matrix, LT pos mkt RS, trend chart signal flip, 1.5% yield |
| CDW | CDW Corp. | Computers | $215.72 | 200 - 220 | 278 | 184 | 4 for 5'er, top third of COMP sector matrix, LT pos mkt RS, triple top, 1.1% yield |
| CNC | Centene Corporation | Healthcare | $74.25 | hi 60s - hi 70s | 98 | 60 | 5 TA rating, top quintile of healthcare sector matrix, consec. buy signals, LT mkt RS buy |
| ABCB | Ameris Bancorp | Banks | $47.05 | low 40s | 57 | 34 | 4 for 5'er, top quartile of BANK sector matrix, pos trend flip, 1.4% yield |
| AEO | American Eagle Outfitters, Inc. | Retailing | $20.76 | 16 - 19.50 | 33 | 14 | 5 TA rating, top quintile of RETA sector matrix, consec. buy signals, R-R > 3.5. |
| AMZN | Amazon.com Inc. | Internet | $145.89 | 140 - lo 150s | 200 | 118 | 4 TA rating, top 25% of INET sector matrix, consec. buy signals, LT pos trend |
| SBUX | Starbucks Corporation | Restaurants | $98.12 | mid 90s - mid 100s | 137 | 82 | 4 TA rating, top 33% of REST sector matrix, LT RS buy, buy-on-pullback, R-R > 2 |
| MOD | Modine Manufacturing Company | Autos and Parts | $53.95 | 50 - 54 | 77 | 38 | 4 for 5'er, new ATH, pos. trend since 7/22, top quartile of Autos Sector Matrix. |
| URI | United Rentals, Inc. | Machinery and Tools | $505.14 | 450s - lo 500s | 692 | 384 | 5 TA rating, pos. trend, consec. buys, LT mkt RS buy, R-R > 2 |
| DELL | Dell Technologies Inc Class C | Computers | $69.24 | mid 60s - lo 70s | 101 | 52 | 5 TA rating, top 20% of COMP sector matrix, buy-on-pullback, R-R > 2 |
| ORLY | O'Reilly Automotive, Inc. | Autos and Parts | $965.52 | 912 - 992 | 1264 | 792 | 5 for 5'er, Mkt. RS Buy since 9/2002, Peer RS Buy since 8/2011, Pullback from Recent ATH. |
| FLR | Fluor Corporation | Building | $38.74 | hi 30s | 49 | 32 | 4 for 5'er, top half of favored BUIL sector matrix, spread quad top breakout |
| GIL | Gildan Activewear | Textiles/Apparel | $32.58 | lo-mid 30s | 58 | 26 | 5 TA rating, top half of TEXT sector matrix, LT RS buy, buy-on-pullback, R-R > 2 |
| Symbol | Company | Sector | Current Price | Action Price | Target | Stop | Notes |
|---|
| Symbol | Company | Sector | Current Price | Action Price | Target | Stop | Notes |
|---|---|---|---|---|---|---|---|
| AXON | Axon Enterprise Inc. | Protection Safety Equipment | $238.69 | 188 | AXON moved into overbought territory. We will raise our stop to $188. | ||
| WH | Wyndham Hotels & Resorts Inc | Leisure | $79.56 | 65 | WH is removed from the roster due to a potential acquisition. |
| Comment | |||||||
|---|---|---|---|---|---|---|---|
|
|
|||||||
GIL Gildan Activewear R ($33.94) - Textiles/Apparel - GIL has a 5 for 5 TA rating and sits in the top half of the textiles/apparel sector RS matrix. The stock moved higher in November to break a double top at $34 before reaching a new 52-week high at $37. The past week of market action has seen GIL retract from that rally high to the current chart position of $32, directly in the middle of its current trading band. The long-term technical picture remains positive, as GIL has maintained an RS buy signal against the market since mid-2020. The near-term pullback presents a more opportune entry point for potential long investors. Exposure may be considered in the low-to-mid $30s. Our initial stop will be set at $26, which would violate notable support and move the stock into a negative trend. The bullish price objective of $58 will serve as our price target, leading to a reward-to-risk ratio north of 2-to-1.
| 21 | 22 | 23 | ||||||||||||||||||||||||||||||||||||||||||||||||||
| 43.00 | X | 1 | • | 43.00 | ||||||||||||||||||||||||||||||||||||||||||||||||
| 42.00 | X | O | X | O | • | • | 42.00 | |||||||||||||||||||||||||||||||||||||||||||||
| 41.00 | X | O | X | O | 2 | • | X | • | 41.00 | |||||||||||||||||||||||||||||||||||||||||||
| 40.00 | 9 | X | O | X | O | X | O | X | O | • | 40.00 | |||||||||||||||||||||||||||||||||||||||||
| 39.00 | X | O | X | C | O | X | O | X | O | X | • | 39.00 | ||||||||||||||||||||||||||||||||||||||||
| 38.00 | X | 7 | X | O | B | O | O | O | X | O | • | 38.00 | ||||||||||||||||||||||||||||||||||||||||
| 37.00 | X | O | X | O | X | O | X | 3 | X | O | • | C | 37.00 | |||||||||||||||||||||||||||||||||||||||
| 36.00 | • | 5 | O | X | O | 8 | A | X | O | X | 4 | • | X | O | Top | 36.00 | ||||||||||||||||||||||||||||||||||||
| 35.00 | • | X | O | O | X | O | O | O | • | • | X | O | 35.00 | |||||||||||||||||||||||||||||||||||||||
| 34.00 | • | X | O | X | O | • | 4 | • | • | X | O | 34.00 | ||||||||||||||||||||||||||||||||||||||||
| 33.00 | • | 4 | O | X | 5 | X | 9 | • | • | 3 | O | 7 | • | X | O | 33.00 | ||||||||||||||||||||||||||||||||||||
| 32.00 | • | 3 | X | O | O | 6 | X | O | X | O | X | • | • | X | O | X | O | X | O | Mid | 32.00 | |||||||||||||||||||||||||||||||
| 31.00 | • | X | O | X | O | X | O | X | O | X | O | A | O | X | • | X | 5 | X | O | B | 31.00 | |||||||||||||||||||||||||||||||
| 30.00 | • | X | O | X | O | X | O | 8 | O | O | X | O | 1 | O | X | O | X | 8 | A | 30.00 | ||||||||||||||||||||||||||||||||
| 29.00 | • | 1 | X | O | • | O | O | X | O | X | B | X | O | X | O | X | O | X | 29.00 | |||||||||||||||||||||||||||||||||
| 28.00 | • | X | O | 2 | • | O | X | O | O | X | 2 | • | O | X | 9 | X | • | 28.00 | ||||||||||||||||||||||||||||||||||
| 27.00 | • | C | O | X | • | O | X | O | • | • | 6 | O | • | Bot | 27.00 | |||||||||||||||||||||||||||||||||||||
| 26.00 | • | X | O | X | • | 7 | • | • | 26.00 | |||||||||||||||||||||||||||||||||||||||||||
| 25.00 | • | X | O | • | 25.00 | |||||||||||||||||||||||||||||||||||||||||||||||
| 24.00 | • | B | • | 24.00 | ||||||||||||||||||||||||||||||||||||||||||||||||
| 23.00 | X | • | 23.00 | |||||||||||||||||||||||||||||||||||||||||||||||||
| 22.00 | X | • | 22.00 | |||||||||||||||||||||||||||||||||||||||||||||||||
| 21.00 | 9 | A | • | 21.00 | ||||||||||||||||||||||||||||||||||||||||||||||||
| 20.00 | X | O | X | • | 20.00 | |||||||||||||||||||||||||||||||||||||||||||||||
| 19.50 | X | O | X | • | 19.50 | |||||||||||||||||||||||||||||||||||||||||||||||
| 19.00 | X | O | • | 19.00 | ||||||||||||||||||||||||||||||||||||||||||||||||
| 18.50 | X | • | 18.50 | |||||||||||||||||||||||||||||||||||||||||||||||||
| 18.00 | X | X | 8 | • | 18.00 | |||||||||||||||||||||||||||||||||||||||||||||||
| 17.50 | X | O | X | O | X | • | 17.50 | |||||||||||||||||||||||||||||||||||||||||||||
| 17.00 | X | O | X | O | X | • | 17.00 | |||||||||||||||||||||||||||||||||||||||||||||
| 16.50 | X | X | X | O | X | X | O | • | 16.50 | |||||||||||||||||||||||||||||||||||||||||||
| 16.00 | X | O | X | O | X | O | X | O | 7 | • | 16.00 | |||||||||||||||||||||||||||||||||||||||||
| 15.50 | X | O | X | O | X | O | X | O | X | • | 15.50 | |||||||||||||||||||||||||||||||||||||||||
| 15.00 | X | O | O | 6 | O | O | X | • | 15.00 | |||||||||||||||||||||||||||||||||||||||||||
| 14.50 | X | O | X | O | • | 14.50 | ||||||||||||||||||||||||||||||||||||||||||||||
| 14.00 | X | O | X | • | 14.00 | |||||||||||||||||||||||||||||||||||||||||||||||
| 13.50 | 4 | 5 | X | • | 13.50 | |||||||||||||||||||||||||||||||||||||||||||||||
| 13.00 | X | O | X | • | 13.00 | |||||||||||||||||||||||||||||||||||||||||||||||
| 12.50 | X | O | X | • | 12.50 | |||||||||||||||||||||||||||||||||||||||||||||||
| 12.00 | X | O | • | 12.00 | ||||||||||||||||||||||||||||||||||||||||||||||||
| 11.50 | X | • | 11.50 | |||||||||||||||||||||||||||||||||||||||||||||||||
| 11.00 | O | X | • | 11.00 | ||||||||||||||||||||||||||||||||||||||||||||||||
| 10.50 | O | X | • | 10.50 | ||||||||||||||||||||||||||||||||||||||||||||||||
| 10.00 | O | X | • | 10.00 | ||||||||||||||||||||||||||||||||||||||||||||||||
| 9.50 | O | • | 9.50 | |||||||||||||||||||||||||||||||||||||||||||||||||
| 9.00 | • | 9.00 | ||||||||||||||||||||||||||||||||||||||||||||||||||
| 21 | 22 | 23 |

| ADBE Adobe Systems Incorporated ($633.66) - Software - ADBE moved higher Tuesday to break a double top at $632, marking a second consecutive buy signal. This 4 for 5'er moved to a positive trend in May and sits in the top quintile of the software sector RS matrix. While the technical picture is positive here, note that ADBE is nearing overbought territory and has earnings expected on 12/13. Initial support may be seen at $592 with further support at $512 and $504. |
| CQP Cheniere Energy L.P. ($54.84) - Oil Service - CQP fell to a sell signal Tuesday when it broke a double bottom at $55. The overall technical picture remains favorable as CQP is a 4 for 5'er and ranks in the top third of the oil service sector matrix. From here, the next level of support in CQP's bullish support line at $53. |
| FIZZ National Beverage Corporation ($51.05) - Food Beverages/Soap - Shares of FIZZ gave a second consecutive buy signal on Tuesday with a double top breakout at $51; the stock also reentered a positive trend. That said, the now 2 for 5'er faces firm resistance overhead at around $55. |
| ITW Illinois Tool Works Inc. ($251.75) - Machinery and Tools - ITW returned to a buy signal today and would challenge its newly established bearish resistance line with further upside action. While the stock is technically strong, a failure to break this trend line would be notable- so consider setting an alert if the stock reverses downwards despite its technically strong TA score. Keep an eye on $264 up above past the negative trend line, all-time highs. |
| RL Ralph Lauren ($134.80) - Textiles/Apparel - RL broke a spread triple top at $136 for a second buy signal and marked a 52-week high. RL is a 4 for 5'er that moved back into a positive trend toward the end of November and ranks within the top half of the Textiles sector matrix. Okay to consider on a pullback to $130 on the chart. Initial support lies at $128 while the bullish support line sits at $114. |
| ZS Zscaler, Inc. ($210.76) - Computers - ZS moved higher Tuesday to break a double top at $208, marking a fourth consecutive buy signal and a new 52-week high. This 4 for 5'er moved to a positive trend in May and sits in the top decile of the computers sector RS matrix. While the technical picture is positive here, ZS has moved into overbought territory. Those looking to add exposure may be best served waiting for a pullback or normalization of the trading band. Initial support may be seen at $194, with further support potentially found at $184. |
| Name | Option Symbol | Action | Stop Loss |
|---|---|---|---|
| Applied Materials, Inc. - $157.21 | AMAT2419D155 | Buy the April 155.00 calls at 14.50 | 140.00 |
| Name | Option | Action |
|---|---|---|
| American International Group, Inc. ( AIG) | Jan. 60.00 Calls | Raise the option stop loss to 5.00 (CP: 7.00) |
| T-Mobile US Inc. ( TMUS) | Feb. 145.00 Calls | Raise the option stop loss to 15.80 (CP: 17.80) |
| Centene Corporation ( CNC) | Mar. 72.50 Calls | Initiate an option stop loss of 4.90 (CP: 6.90) |
| Broadcom Ltd ( AVGO) | Mar. 920.00 Calls | Raise the option stop loss to 151.20 (CP: 171.20) |
| Meta Platform Inc. ( META) | Mar. 320.00 Calls | Initiate an option stop loss of 31.60 (CP: 33.60) |
| Name | Option Symbol | Action | Stop Loss |
|---|---|---|---|
| Southwest Airlines Co. - $30.34 | LUV2415O30 | Buy the March 30.00 puts at 1.99 | 33.00 |
| Name | Option | Action |
|---|---|---|
| Delta Air Lines Inc. (DAL) | Mar. 38.00 Puts | Stopped at 41.00 (CP: 41.29) |
| Name | Option Sym. | Call to Sell | Call Price | Investment for 500 Shares | Annual Called Rtn. | Annual Static Rtn. | Downside Protection |
|---|---|---|---|---|---|---|---|
| Royal Caribbean Cruises Ltd. $120.41 | RCL2415C125 | Mar. 125.00 | 7.25 | $57,238.50 | 31.61% | 20.26% | 4.96% |
| Name | Action |
|---|---|
| Amazon.com Inc. (AMZN) - 145.89 | Sell the March 150.00 Calls. |
| Dexcom Inc. (DXCM) - 117.90 | Sell the March 120.00 Calls. |
| Airbnb, Inc. Class A (ABNB) - 142.93 | Sell the March 150.00 Calls. |
| Guess Inc. (GES) - 22.45 | Sell the March 23.00 Calls. |
| Name | Covered Write |
|---|---|
|
|
|
Daily Equity & Market Analysis
Loading, Please Wait...
