Domestic Equities overtook Commodities for 2nd position within the DALI Asset Class Rankings.
US Equity indices started off the week on a positive note with the S&P 500 Index SPX adding 39 basis points while Gold GC/ led broader Commodity indices into negative territory. This is a continuation of divergence between US Equity and Commodity indices, with Gold GC/ and Crude Oil CL/ being notable movers to the downside, shedding roughly 3% and 6% since the beginning of December. This divergence has led Domestic Equities to overtake Commodities within DALI for 2nd in the asset class rankings. Technically, the two asset classes are tied at 242 tally signals, but Domestic Equity’s recent rally has led to positive near-term RS for the asset class compared to Commodities and it to be favored in the tiebreaker.
Last week, International Equities moved up to the number 1 spot within DALI and it currently leads Domestic Equities and Commodities by 3 tally signals. This brings what has been a tight margin between the 1st and 3rd ranked asset classes since the beginning of November, to an even tighter margin. This technically is not the tightest margin between 1st and 3rd in DALI, but it counts as only the fifth day in DALI’s asset class history the top three asset classes have been separated by 3 or fewer tally signals. The narrowest margin between the top three asset classes occurred on August 16th, 2016, when Commodities sat in 1st at 227 tally signals, Domestic Equities was in 2nd at 226, and Fixed Income was in 3rd at 225. Domestic Equities emerged as the top asset class from that period and maintained the top spot for roughly 3.5 years.

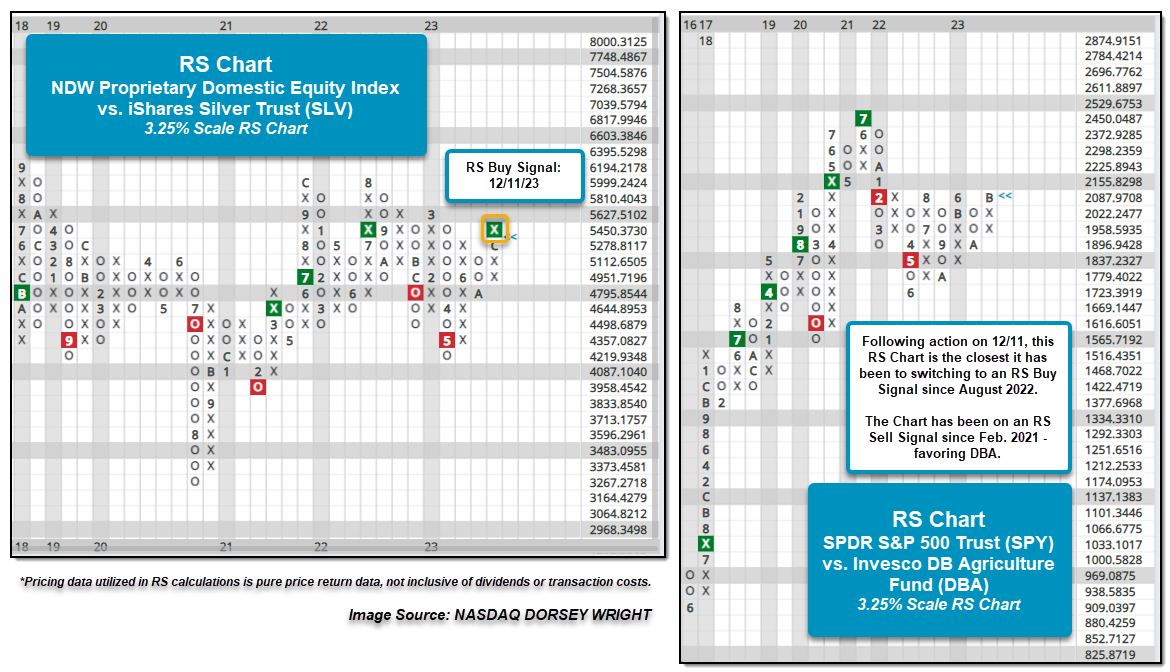
Among the RS charts to flip recently to favor US Equities compares the NDW Proprietary Domestic Equity Index against the iShares Silver Trust SLV on a 3.25% scale. The chart moved back to a buy signal following Monday’s action after having been on an RS sell signal since December last year. As noted above, Gold, along with Silver, have carried the precious metals space lower and were the primary subgroup of Commodities to lose signals as of late. Precious Metals have not been the only space losing ground on a relative basis as Crude Oil CL/ has shed almost 20% over the past 90-day roll, and the stalwart of the broader asset class, agriculture, has begun to shed some of its superior strength. An RS chart we have noted before compares the SPDR S&P 500 Trust SPY against the Invesco DB Agriculture Fund DBA, and following Monday’s action, it is the closest the RS chart has been to an RS buy signal since August 2022. Currently, the RS chart is just over 1% away from returning to a buy signal and potentially favoring SPY for the first time in 22 months.