Most Requested Symbols

Whether you’ve had a productive year investing in 2026 depends almost entirely on whether you own energy and technology stocks. However, as the saying goes, the taller they are, the harder they fall. While both sectors display significant long-term strength, there is at least one major argument against each group.
In honor of Memorial Day, we present you with the cousin of the "Cocktail Party Bullish Percent," the "Backyard BBQ Bullish Percent" indicator.
Weekly Rundown Video – May 20, 2026
Weekly rundown with NDW analyst team covering all major asset classes.
Weekly rundown with NDW analyst team covering all major asset classes.
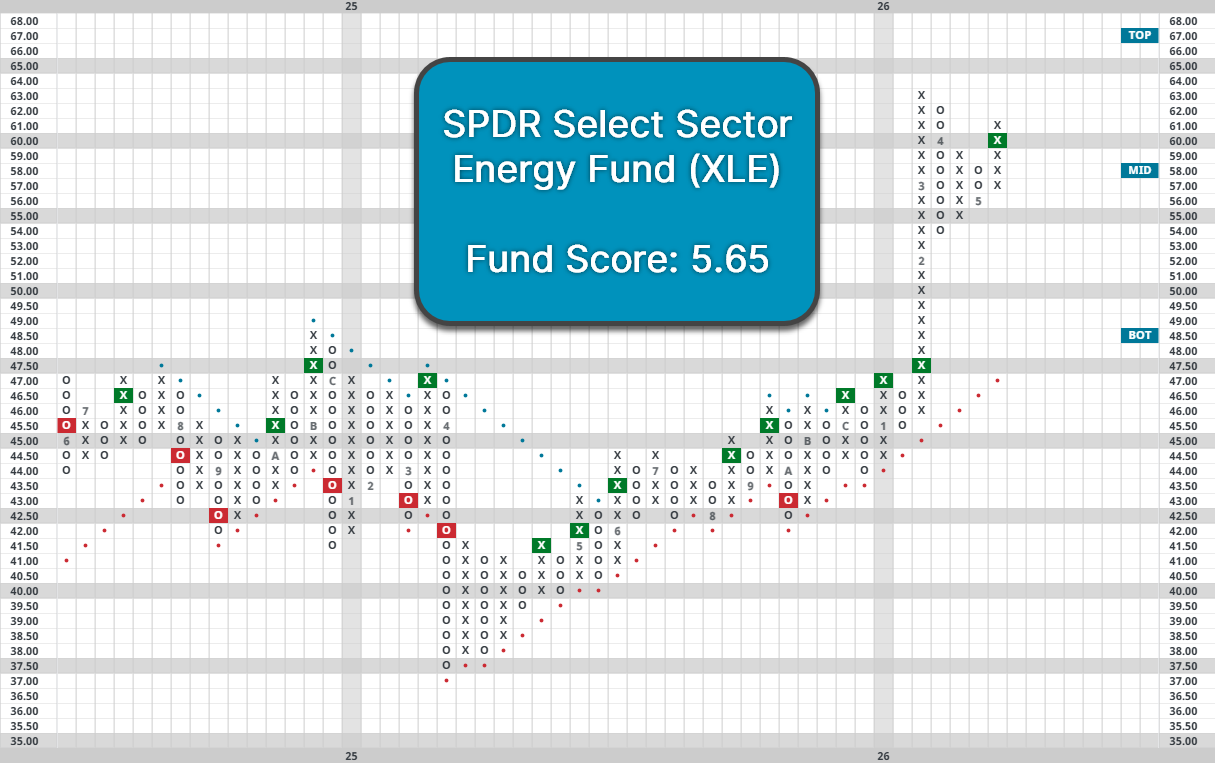
Whether you’ve had a productive year investing in 2026 depends almost entirely on whether you own energy and technology stocks. Technology fund XLK is up 23% YTD, while energy fund XLE is up 33.8%. The next closest sector after them, Real Estate (XLRE), is more than 13% behind tech, with a barely double-digit return of 10.1%. The outperformance of these two sectors has led to a notable uptick in relative strength. However, as the saying goes, the taller they are, the harder they fall. While both sectors display significant long-term strength, there is at least one major argument against each group.
Energy has been a major beneficiary of rising crude oil prices this year, with the sector climbing to first place in DALI with a signal count of 240. Looking at XLE, it holds an extremely strong fund score of 5.65 after breaking out earlier this year. While the sector pulled back in April, it completed a bullish catapult and regained near-term market relative strength versus SPXEWI over the last week. However, energy typically moves in conjunction with oil, and a resolution of the Iran conflict could cause a sizable drop in prices, which would be a significant blow to the sector. Conversely, escalation could drive prices even higher, serving as an additional tailwind. Either way, uncertainty surrounding conflict will likely lead to higher volatility in the sector, but its relative strength is holding up for now.
Technology has been the other major leader, but despite its strength, many investors remain concerned. Technology currently holds the second spot in DALI with an impressive signal count of 226. The sector has rallied sharply from its March lows, leaving XLK on a steep column of Xs before finding support at $172. It now has a near-perfect fund score of 5.79 but remains heavily overbought, trading above the top of its 10-week trading band. Despite the sector’s long-term strength, it wouldn’t be surprising to see the group cool off or pull back over the next month.

Despite concerns about both sectors, each continues to exhibit historic levels of long-term strength. Both sectors currently have over 225 signals within DALI, and there’s only been a seventeen instances in which one sector has held that much strength, let alone two. In order for a sector reach that many signals, there has to be a major underlying theme driving the move, and previous instances can help indicate whether those trends are likely to persist or fade.
Interestingly, five of those occasions have come from tech while four have come from energy. Energy is the least correlated sector to the broader market, and its performance is often more driven by oil prices than by equities, making it less impacted during broader downturns. As a result, it can rise to the top from either a sharp increase in oil prices, weakness within other equities, or both. Previous instances of extreme energy leadership have occurred around bearish periods, with the sector averaging a 20% decline over the following year after first reaching 225 signals, while the broader market performed slightly better. However, this environment is unique in that technology is right behind energy. In other bearish periods, defensive or commodity-linked sectors held second place, suggesting that the current environment may be driven more by oil strength than by equity weakness, similar to 2005.

Meanwhile, technology tends to deliver the most upside in rising markets, so tech-driven leadership is typically a sign of market strength. The other four instances of extreme tech leadership support this view, with XLK averaging a strong one-year return of 20%. Additionally, leadership from other risk-on sectors such as consumer discretionary and communication services resulted in similarly strong performances, exceeding double-digit gains over the following While current market leadership may raise some concerns, there are always reasons for caution, and relative strength continues to support the leadership of the two sectors. With technology in the driver’s seat, concerns associated with past energy-led environments may largely be set aside, especially as the broader domestic equities market remains strong.

Memorial Day weekend is upon us, and as in summers past, you will undoubtedly be frequenting several backyard BBQs, both this weekend and in the coming months. If your experiences have been anything like ours, you may have found that these parties can give some very helpful insight on investor sentiment. We have discussed the idea of the "Cocktail Party Bullish Percent” indicator in the past, as a way to gauge the general sentiment of your clients and the public about the market. So, in honor of Memorial Day, we wanted to present you with the cousin of the "Cocktail Party Bullish Percent," the "Backyard BBQ Bullish Percent" indicator. Keep it in the back of your mind as you head to any Memorial Day celebrations this weekend. Our prediction is that you will find yourself somewhere in the middle for most interactions.

Friends, family, and potential clients you see this weekend will also undoubtedly be curious about your take on the market, so we’ve included some notable recent developments below.
Average Level
27.45
| < - -100 | -100 - -80 | -80 - -60 | -60 - -40 | -40 - -20 | -20 - 0 | 0 - 20 | 20 - 40 | 40 - 60 | 60 - 80 | 80 - 100 | 100 - > |
|---|---|---|---|---|---|---|---|---|---|---|---|
|
Buy signalGSG
|
Buy signalijr
|
||||||||||
|
Buy signalUSO
|
Sell signaldia
|
Buy signalSPY
|
|||||||||
|
Sell signalshy
|
Sell signaldx/y
|
Buy signalefa
|
Buy signalicf
|
Buy signalVOOG
|
|||||||
|
Sell signalief
|
Sell signalgld
|
Buy signalhyg
|
Buy signalIJH
|
Buy signalEEM
|
Buy signalGCC
|
Buy signalXLG
|
|||||
|
Sell signaltlt
|
Sell signalagg
|
Sell signallqd
|
Buy signalfxe
|
Buy signaldvy
|
Buy signalrsp
|
Buy signaliwm
|
Buy signalVOOV
|
Buy signalONEQ
|
Buy signalQQQ
|
||
| < - -100 | -100 - -80 | -80 - -60 | -60 - -40 | -40 - -20 | -20 - 0 | 0 - 20 | 20 - 40 | 40 - 60 | 60 - 80 | 80 - 100 | 100 - > |
| AGG | iShares US Core Bond ETF |
| USO | United States Oil Fund |
| DIA | SPDR Dow Jones Industrial Average ETF |
| DVY | iShares Dow Jones Select Dividend Index ETF |
| DX/Y | NYCE U.S.Dollar Index Spot |
| EFA | iShares MSCI EAFE ETF |
| FXE | Invesco CurrencyShares Euro Trust |
| GLD | SPDR Gold Trust |
| GSG | iShares S&P GSCI Commodity-Indexed Trust |
| HYG | iShares iBoxx $ High Yield Corporate Bond ETF |
| ICF | iShares Cohen & Steers Realty ETF |
| IEF | iShares Barclays 7-10 Yr. Tres. Bond ETF |
| LQD | iShares iBoxx $ Investment Grade Corp. Bond ETF |
| IJH | iShares S&P 400 MidCap Index Fund |
| ONEQ | Fidelity Nasdaq Composite Index Track |
| QQQ | Invesco QQQ Trust |
| RSP | Invesco S&P 500 Equal Weight ETF |
| IWM | iShares Russell 2000 Index ETF |
| SHY | iShares Barclays 1-3 Year Tres. Bond ETF |
| IJR | iShares S&P 600 SmallCap Index Fund |
| SPY | SPDR S&P 500 Index ETF Trust |
| TLT | iShares Barclays 20+ Year Treasury Bond ETF |
| GCC | WisdomTree Continuous Commodity Index Fund |
| VOOG | Vanguard S&P 500 Growth ETF |
| VOOV | Vanguard S&P 500 Value ETF |
| EEM | iShares MSCI Emerging Markets ETF |
| XLG | Invesco S&P 500 Top 50 ETF |

| Symbol | Company | Sector | Current Price | Action Price | Target | Stop | Notes |
|---|---|---|---|---|---|---|---|
| BPOP | Popular, Inc. | Banks | $149.56 | hi 130s - low 150s | 200 | 120 | 5 for 5'er, 18 of 174 in favored BANK sector matrix, LT pos peer & mkt RS, triple top, good R-R, 2% yield |
| GRMN | Garmin Ltd. | Leisure | $237.47 | mid 230s - mid 260s | 364 | 196 | 5 TA rating, LT pos trend and mkt RS buy, top 33% of LEIS sector matrix, buy-on-pullback |
| SBUX | Starbucks Corporation | Restaurants | $106.50 | hi 90s - mid 100s | 129 | 85 | 4 for 5'er, top 20% of REST sector matrix, mkt RS reversal to Xs, triple top, 2.35% yield |
| OSW | OneSpaWorld Holdings Ltd. | Leisure | $23.85 | 22 - 24 | 30.50 | 19 | 5 for 5'er, top half of LEIS sector matrix, LT pos peer & mkt RS, spread quintuple top |
| IMO | Imperial Oil Limited | Oil | $133.84 | mid 120s to mid 130s | 164 | 112 | 5 for 5'er; top quartile of Oil matrix; long term mkt and peer RS; Pos. Trend since May '25. |
| SKT | Tanger Inc. | Real Estate | $35.63 | mid-to-hi 30s | 48 | 31 | 5 for 5'er, top 25% of REAL sector matrix, LT pos peer & mkt RS, R-R~2.0, 3.2% yield |
| IBOC | International Bancshares Corporation | Banks | $72.39 | low-to-mid 70s | 93 | 63 | 4 for 5'er, favored BANK sector, LT pos peer & mkt RS, bearish signal reversal, R-R~2.0, 1.95% yield |
| MSGE | Madison Square Garden Entertainment Corp. | Leisure | $69.58 | 63 to 69 | 98 | 53 | 5 for 5'er since Nov. 2025; Top Decile of Leisure Matrix; Pos. Trend since May 2025; ATH 5/7. |
| TDS | Telephone & Data Systems Inc | Telephone | $41.60 | low 40s | 70 | 35 | 4 for 5'er, favored TELE sector, LT pos peer & mkt RS, buy on pullback, R-R~4.0 |
| LYV | Live Nation Entertainment Inc. | Leisure | $164.44 | low 160s to mid 170s | 202 | 142 | 4 for 5'er; Pos. Trend; Top Half of Leisure Matrix; Within one box of ATH. |
| MO | Altria Group Inc. | Food Beverages/Soap | $73.33 | low-to-mid 70s | 91 | 62 | 4 for 5'er, top quartile of FOOD sector matrix, one box from RS buy, bullish triangle, 5.9% yield |
| MPC | Marathon Petroleum Corp. | Oil Service | $258.37 | 240 - 260 | 360 | 208 | 4 for 5'er, pos. trend, top third of Oil Services matrix, pos. L-T Mkt and Peer RS. |
| CGNX | Cognex Corp | Electronics | $63.35 | low-to-mid 50s | 75 | 52 | 4 for 5'er, top half of favored ELEC sector matrix, one box from mkt RS buy, buy on pullback |
| CELC | Celcuity Inc. | Biomedics/Genetics | $140.21 | low $130 - low $140 | 216 | 116 | 5/5'er since Oct. '25, pos. trend, top quintile of Biom. matrix, R-R > 5. |
| Symbol | Company | Sector | Current Price | Action Price | Target | Stop | Notes |
|---|
| Symbol | Company | Sector | Current Price | Action Price | Target | Stop | Notes |
|---|---|---|---|---|---|---|---|
| CVSA | Covista Inc. | Business Products | $126.01 | 110s - mid 120s | 186 | 104 | Sell signal 5/21 at $122, maintain $104 stop. |
| Comment | |||||||
|---|---|---|---|---|---|---|---|
|
|
|||||||
CELC Celcuity Inc. ($140.34) - Biomedics/Genetics - CELC has been a 5 for 5’er in technical attribute rating since October 2025. Along with positive near- and long-term relative strength against the market as defined by the S&P 500 Equal Weight Index and its peer groups within the Biomedics/Genetics group, the group currently ranks within the top quintile of the sector matrix. On the trend chart, CELC has maintained a positive trend since June 2025 and returned to a buy signal earlier in May 2026 as shares rallied to new high at $150 on the chart. After a brief consolidation within the $130 range, CELC broke a triple top at $140 during trading on 5/20 for a second buy signal. Okay to consider CELC within the lower $130 to lower $140 range. Our price target will be the bullish price objective of $216, giving the stock a reward to risk ratio north of 5. The initial stop loss for the position will be $116.
| 150.00 | X | 150.00 | |||||||||||||||||||||||||||
| 148.00 | X | O | 148.00 | ||||||||||||||||||||||||||
| 146.00 | X | O | 146.00 | ||||||||||||||||||||||||||
| 144.00 | X | O | 144.00 | ||||||||||||||||||||||||||
| 142.00 | X | O | 142.00 | ||||||||||||||||||||||||||
| 140.00 | X | O | X | 140.00 | |||||||||||||||||||||||||
| 138.00 | X | O | X | X | X | 138.00 | |||||||||||||||||||||||
| 136.00 | X | O | X | O | X | O | X | 136.00 | |||||||||||||||||||||
| 134.00 | X | O | X | O | X | O | X | 134.00 | |||||||||||||||||||||
| 132.00 | X | O | X | O | X | O | X | 132.00 | |||||||||||||||||||||
| 130.00 | X | O | X | O | X | O | X | 130.00 | |||||||||||||||||||||
| 128.00 | X | X | X | O | X | O | O | 128.00 | |||||||||||||||||||||
| 126.00 | X | X | O | X | O | X | O | X | 126.00 | ||||||||||||||||||||
| 124.00 | X | X | O | X | O | X | O | 5 | O | X | 124.00 | ||||||||||||||||||
| 122.00 | X | O | X | O | X | O | X | O | X | O | 122.00 | ||||||||||||||||||
| 120.00 | X | O | X | O | X | O | X | O | X | Mid | 120.00 | ||||||||||||||||||
| 118.00 | X | X | X | X | O | X | O | O | X | O | 118.00 | ||||||||||||||||||
| 116.00 | X | X | O | X | O | X | O | 4 | O | O | X | 116.00 | |||||||||||||||||
| 114.00 | X | O | X | O | X | O | X | O | X | O | X | 114.00 | |||||||||||||||||
| 112.00 | X | X | O | X | O | X | O | X | O | X | O | X | 112.00 | ||||||||||||||||
| 110.00 | X | O | X | O | O | O | X | O | X | O | X | 110.00 | |||||||||||||||||
| 108.00 | O | X | O | X | O | X | O | X | O | 108.00 | |||||||||||||||||||
| 106.00 | O | X | 3 | X | O | X | O | 106.00 | |||||||||||||||||||||
| 104.00 | O | X | O | O | X | 104.00 | |||||||||||||||||||||||
| 102.00 | O | X | O | 102.00 | |||||||||||||||||||||||||
| 100.00 | O | X | 100.00 | ||||||||||||||||||||||||||
| 99.00 | O | X | 99.00 | ||||||||||||||||||||||||||
| 98.00 | O | 98.00 |
| DAL Delta Air Lines Inc. ($75.43) - Aerospace Airline - DAL broke a double top at $75 to return to a buy signal and penetrate the bearish resistance line, flipping the trend back to positive. The positive trend change will increase the stock up to a 4 for 5'er , and DAL currently ranks within the top third of the Aerospace Airline sector matrix. Okay to consider here on the breakout or on a pullback to the lower $70s. Note the February high at $76. Initial support lies at $68, the bullish support line, while additional sits in the mid to lower $60s. |
| H Hyatt Hotels Corp. ($176.88) - Leisure - H reversed into Xs and broke a spread triple top at $174 for a fourth buy signal since April as shares rallied to $176. The stock is currently a 5 for 5'er and ranks within the top half of the Leisure sector matrix. Okay to consider here on the breakout. Note the February chart high at $180. Initial support resides at $164, while additional can be found in the upper $150 to $160 range. |
| THC Tenet Healthcare Corporation ($179.78) - Healthcare - THC completed a double bottom break at $180, marking its second consecutive sell signal. The 2 for 5'er moved down from a 3 with its latest move after reversing back into a negative trend. Additionally, the stock ranks in the bottom half of the healthcare sector matrix. A sell can be considered here. Initial resistance is at $190, with additional strong resistance at $200. |

The option suggestions featured here are pulled from the NDW Options Ideas tool. These are just a sample of the ideas that can be found there. The Options Idea tool contains numerous additional income and speculative plays. It also offers relative strength-based screens targeting the highest (and lowest) relative strength stocks and ETFs that have recently moved counter to their longer-term trend. To access or subscribe to the Options Ideas tool click here.
Call:
Altria Group (MO) Sept 18 $72.5 Call
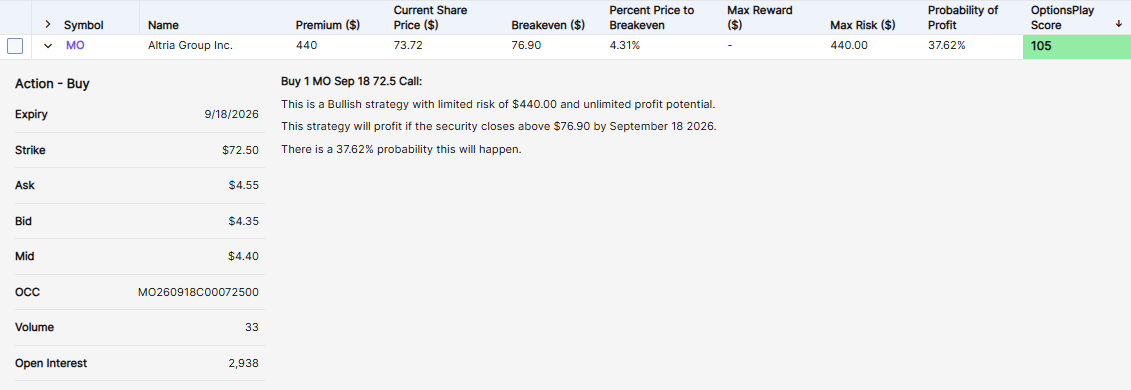
Addition Data:
Bid/Ask Spread: 4.60%
Delta: 62.08
Gamma: 4.52
Implied Volatility: 25.19%
Days Until Expiry: 120 Days
Next Earnings Date: 7/30/2026
Put:
3M Company (MMM) Aug 21 $155 Put

Addition Data:
Bid/Ask Spread: 9.42%
Delta: -49.77
Gamma: 1.74
Implied Volatility: 28.69%
Days Until Expiry: 92 Days
Next Earnings Date: 7/21/2026
Income (Covered Call)
Alphabet Inc. (GOOG) Jun 18 $407.5 Covered Call

Addition Data:
Bid/Ask Spread: 7.61%
Delta: 74.46
Gamma: -0.99
Implied Volatility: 29.54%
Days Until Expiry: 28 Days
Next Earnings Date: 7/23/2026
Daily Equity & Market Analysis
LISTEN TO PODCAST
May 21, 2026
Loading, Please Wait...
