Most Requested Symbols

The average distribution level is -28.99%.
Today's featured stock is J.P. Morgan Chase & Co. (JPM).
Comments include: BOOT, CE, COF, DXCM, FIVE, KEYS, KMX, MCO, and SKX.
Call: Walmart (WMT); Put: Advanced Micro Devices (AMD); Covered Write: Arista Networks (ANET).
NDW Morning Update Video - August 21, 2023
NDW Morning Update Video – August 21, 2023.
Click here to download MP3
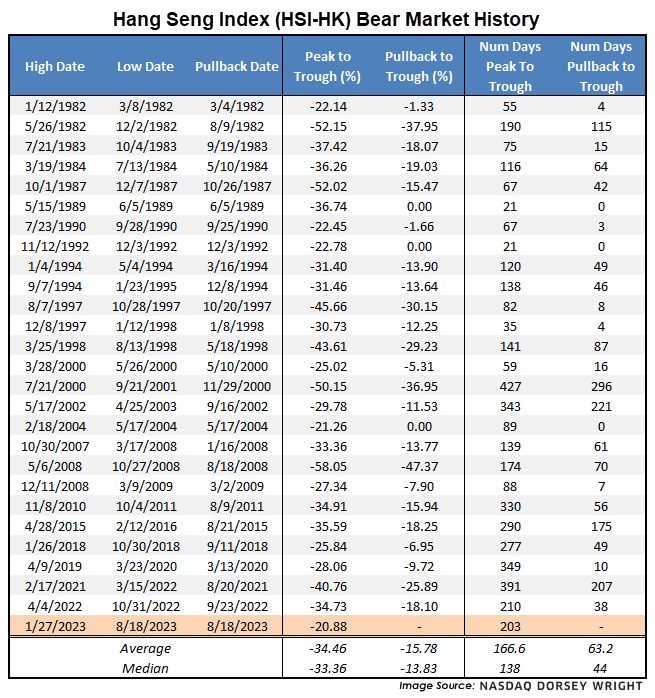
Concern around the Chinese economy led shares in Hong Kong lower this week, as the Hang Seng Index HSI-HK fell -5.89% over the past five days to drop into bear market territory. On Thursday, China Evergrande Group, one of the largest property developers on the Mainland, filed for Chapter 15 bankruptcy in New York, which would allow bankruptcy proceedings to move into effect for the three Evergrande companies based in Hong Kong, the British Virgin Islands, and the Cayman Islands (source: wsj.com). This move was also paired with further stress from Zhongrong International Trust, an asset manager in China that had around $108 billion in AUM at the end of last year, as the privately held company missed interest and principal payments to publicly listed companies in China totaling $14 million (source: wsj.com).
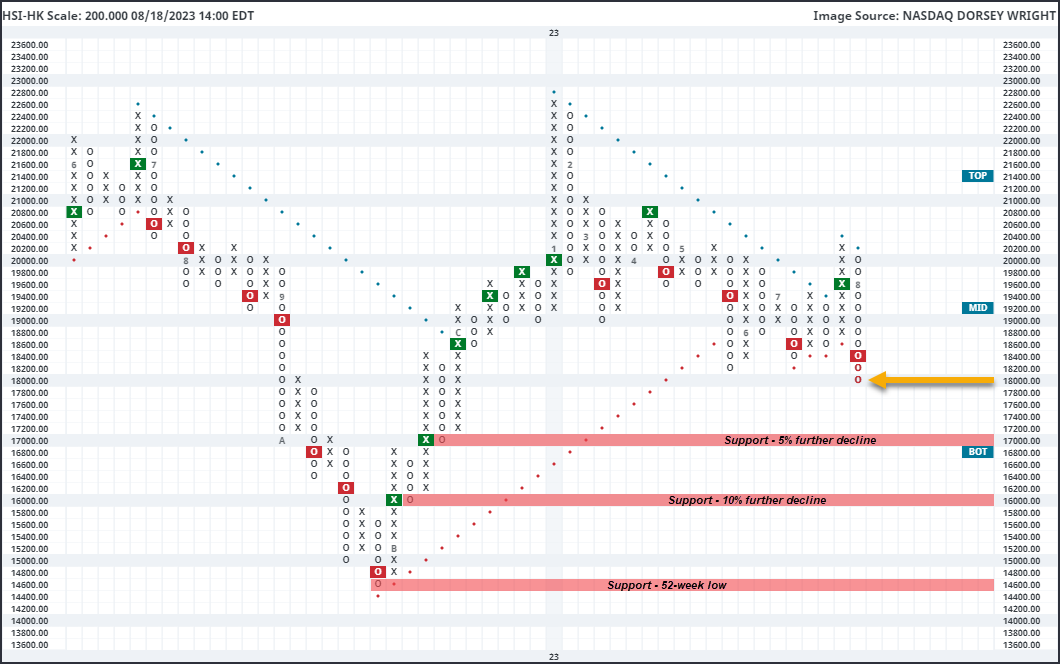
The Hang Seng Index dropped over 2% during the market action on Friday, pushing HSI-HK down below the 18,000 level on the longer-term focused 200-point chart for the first time since November 2022. The Index has now declined 20.88% from its recent peak of 22,688 seen on January 27, initiating the 27th bear market we have seen since our index data began in 1982. The average decline from each bear market sits at almost 34%, which is directly in line with the peak-to-trough move in the last bear market from April 4 – October 31, 2022. The current decline sits at 203 days, which is longer than the average bear market period of about 166 days. The Hang Seng has averaged just over 60 days from the date of each 20% decline to the ultimate trough in each period. Of course, some of those declines saw an abrupt end to the weakness as soon as the 20% threshold was breached, as we saw in 2004, 1992, and 1989. Others saw extensive weakness, highlighting the potential for further weakness.
The 200-point chart of the HSI-HK broke through support from May of this year at 18,200 this week after returning to a sell signal at 18,400. This move also pushed the index back into a negative trend. In July, we saw a brief resurgence from the Hang Seng, as the index broke a triple top before failing to break through further resistance at 20,200. The inability of the index to break through key resistance points this year does not bode well for the relationship between buyers and sellers moving forward. Weekly momentum also just flipped negative, suggesting the potential for further downside from here. Initial support on the longer-term focused 200-point chart can be seen at 17,000, which would be another 5% drop from current levels. Additional support may be found at 16,000, which would mark a 10% further decline, with the 52-week low sitting down at 14,600.


September 14th and 15th
The Symposium is pending approval of CE credit toward the CFP®, CIMA®, CPWA®, and RMA certifications.
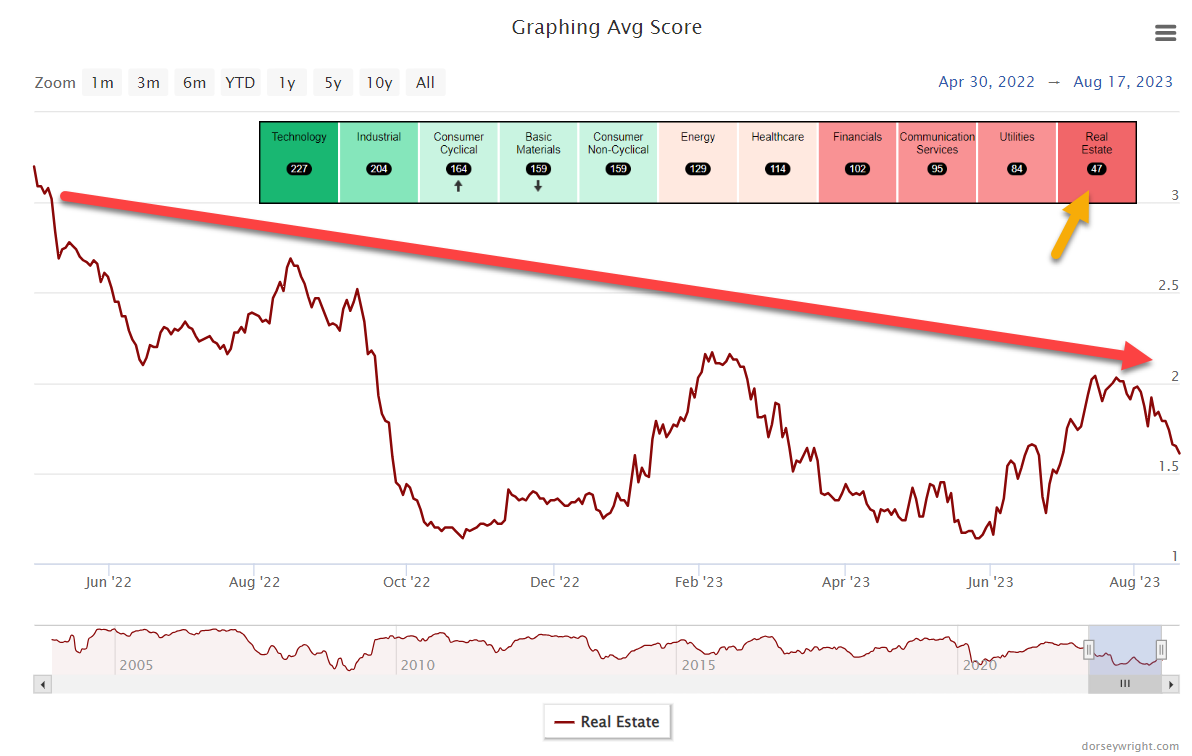
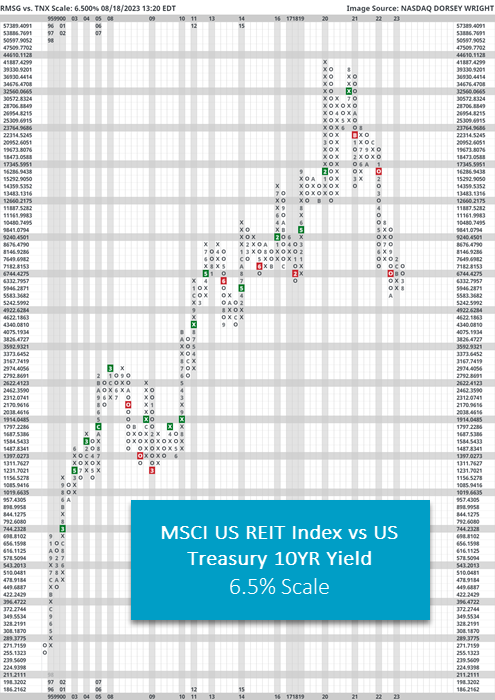
Housing and Real Estate are a cornerstone of how we all live our lives. At least for the recent past, the same cannot be said for helping out our investment portfolios, which have been best suited to steer clear of the sector. We have touched on this throughout the past 12 months as the group has persistently posted low relative strength readings across the platform; currently, Real Estate holds an average fund score of only 1.61 and earns a pitiful 47 buy signals within the DALI sector rankings. Individual stock picking has been just as difficult, with few representatives holding what the analyst team would consider acceptable ratings from a technical perspective. With knowledge of this historically bad run on the back burner, today’s report will focus on other instances of such underperformance in hopes of identifying what may be in store for the group in the near future.
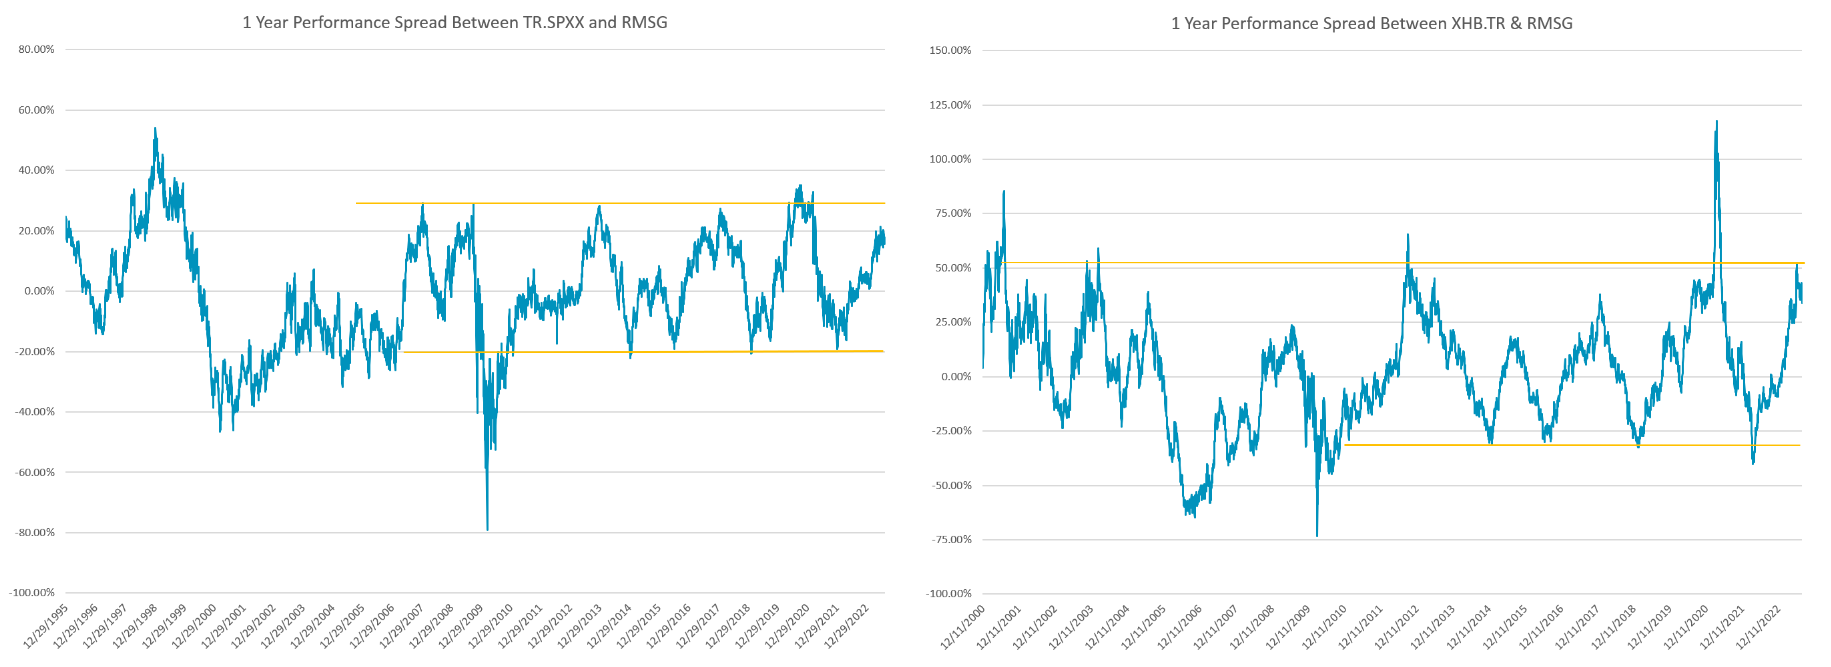
To do this, we ran a performance spread between the S&P 500 (TR.SPXX, which assumes dividend reinvestment) and the MSCI US REIT Total Return Index RMSG. By nature of the business models behind the sector, Real Estate can often take on the “income” focused role within a client’s portfolio. For this reason, dividends were included in today’s analysis to allow each group to play on a level field. Even with dividends included for RMSG, rolling 1-year performance for the index is underperforming the broad S&P 500 by a wide margin, nearly 17.50% at the time of this writing. Looking at the chart on the left, this seems to be encroaching on a rather historical mark, with outperformance in favor of TR.SPXX topping out around 23% five times over the last two decades. While history seldom repeats it often rhymes, suggesting that further underperformance from the sector in comparison to the broad market would be quite rare.
On the other side of the conversation comes homebuilders, which have continued to rocket forward as the demand for new builds remains strong from a macro perspective. A similar 1-year performance spread between the SPDR S&P Homebuilders ETF XHB.TR and RMSG was run, revealing a similar picture to the one discussed earlier. Outside of the strong showing (100%+ outperformance in favor of XHB.TR) in 2020, the rolling 1-year performance spread is at somewhat historic levels. All this considered, the performance spreads suggest a near-term uptick (or at least stabilization) could be due for this washed-out sector.
As for why Real Estate is underperforming to this degree, that is generally outside of our lane as technical analysts; however, we can say that interest rates have historically been a good indicator. Before delving into this relationship, note that many Real Estate names traded in the marketplace (and underlying popular equity ETFs like XLRE) are Real Estate Investment Trusts, REITs for short. These investment vehicles pool capital from numerous investors to purchase and operate income-generating Real Estate. The trust is then required to distribute at least 90% of its taxable income in the form of shareholder dividends each year, which will often translate to high dividend yields for investors. A REIT is publicly traded, which brings liquidity to a traditionally illiquid asset class and will often specialize in a certain type of property such as hotels, shopping malls, etc. In addition to the payout requirement, REITs can also offer potential tax benefits and diversification to an investment portfolio.
So, given this background, rising interest rates can undoubtedly impose some headwinds for REITs. Summarized well by S&P Global, “All else being equal, higher interest rates tend to decrease the value of properties and increase REIT borrowing costs. In addition, higher interest rates make the relatively high dividend yields generated by REITs less attractive when compared with lower-risk, fixed-income securities, which reduces their appeal to income-seeking investors.”
We will conclude today with a relative strength chart between the Invesco S&P 500 Equal Weight Real Estate ETF (RSPR, formally known as EWRE) and the S&P 500 Equal Weight (SPXEWI). In question form, this chart answers, “How is the average Real Estate stock faring against the S&P 500?” We partly know the answer based on the spreads first discussed in today’s piece, but this chart adds further perspective from a cumulative point of view. As we can see, the record lows from March 2009 are not far off; in fact, we are only about 10% away. Although we do not call past lows on a relative strength chart “support” or past highs “resistance” as we would on a regular trend chart, they can still be notable areas of market memory – especially in this case.
Extreme underperformance can certainly go on longer than anticipated, and the overall technical trend is still against the Real Estate sector currently. However, as trend followers we must also be mindful of potential mean reversions; the longer this trend of severe underperformance persists the more intently we (and others) will likely be watching.


| Symbol | Name | Price | Yield | PnF Trend | RS Signal | RS Col. | Fund Score | 200 Day MA | Weekly Mom |
|---|---|---|---|---|---|---|---|---|---|
| DIA | SPDR Dow Jones Industrial Average ETF Trust | 345.06 | 1.90 | Positive | Sell | O | 2.99 | 336.89 | -1W |
| EEM | iShares MSCI Emerging Markets ETF | 38.66 | 2.13 | Positive | Sell | X | 2.67 | 39.29 | -1W |
| EFA | iShares MSCI EAFE ETF | 69.84 | 2.12 | Positive | Sell | X | 3.65 | 70.15 | -1W |
| FM | iShares Frontier and Select EM ETF | 26.83 | 1.82 | Positive | Sell | X | 4.04 | 25.74 | -1W |
| IJH | iShares S&P MidCap 400 Index Fund | 256.82 | 1.52 | Positive | Sell | X | 4.06 | 253.05 | -2W |
| IJR | iShares S&P SmallCap 600 Index Fund | 98.21 | 1.47 | Positive | Sell | O | 2.36 | 98.37 | -1W |
| QQQ | Invesco QQQ Trust | 358.58 | 0.56 | Positive | Sell | X | 4.71 | 317.31 | -7W |
| RSP | Invesco S&P 500 Equal Weight ETF | 147.02 | 1.64 | Positive | Buy | O | 3.57 | 145.90 | -2W |
| SPY | SPDR S&P 500 ETF Trust | 436.29 | 1.43 | Positive | Sell | X | 4.17 | 411.75 | -3W |
| XLG | Invesco S&P 500 Top 50 ETF | 34.41 | 1.04 | Positive | Buy | X | 5.61 | 31.13 | -7W |
The SPDR Dow Jones Industrial Average ETF Trust DIA remains in a column of X’s this week, sitting at $355. The fund remains on its second consecutive buy signal on the default chart. The fund now scores just below an acceptable score, scoring at 2.99. It still scores below the average US score of 3.52. DIA remains in a positive trend at current levels. Support is offered at $315 with overhead resistance at current levels.
The iShares MSCI Emerging Markets ETF EEM remains in a column of O’s this week, seen at a price of $38.50. This will move the fund back into a negative trend for the first time in 2023. With this in mind, EEM now scores below the acceptable 3.0 threshold with a score posting of 2.67, falling behind developed markets representatives. The fund sees initial support at $38, with more substantial support down around $37.
The iShares MSCI EAFE ETF EFA returned to a column of O’s this week, returning to test nearby support at a chart reading of $70. Developed markets have deteriorated slightly, now shown by a positive, but weakening 3.65 fund score. The ETF remains in a positive trend at current levels with established support offered at current levels. Overhead resistance is now found at $74.
The iShares MSCI Frontier and Select EM ETF FM returned to a column of O’s this week, seen at a chart reading of $26.50. It remains on a buy signal after posting new 2023 highs to end July. The fund has a strong fund score of 4.04 and is now paired with a positive 2.59 score direction. Support is seen below at $24.50.
The iShares S&P MidCap 400 Index Fund IJH returned to a column of O’s this week, seen at a chart reading of $255. However, the fund maintains its position above the bullish support line. IJH has a current fund score of 4.06 which is now above the average US score of 3.52. From here, overhead resistance is found at $270 with the bullish support line found below.
The iShares S&P SmallCap 600 Index Fund IJR remains on a buy signal this week but did return to a column of O’s on its default chart to a price of $98. Despite the recent action leading to now 3 consecutive buy signals, IJR maintains an improved, but still unacceptable 2.36 fund score. Support is offered below at $97, with overhead resistance found at $104.
The Invesco QQQ Trust QQQ remains in a column of O’s this week, continuing the pullback from growth-focused areas. The fund is now seen at a price of $355. With that said, the fund still holds a strong 4.71 fund score and is paired with an intensely positive 2.18 score direction. This now outpaces the average US fund, which shows a 3.52 average score. Initial support is offered at $290, well below current levels.
The Invesco S&P 500 Equal Weight ETF RSP reversed down into O’s this week, now seen at a price of $146. RSP holds a negative 1.89 score direction and now displays a 3.57 fund score. This is still behind the average S&P 500 Index fund score of 4.50. The spread between the two has solidified around current levels over the last few weeks. Support is now seen at $140.
The SPDR S&P 500 ETF Trust SPY returned to a column of O’s this week, now seen at a price of $435. The fund holds a strong 4.17 fund score, besting the average US fund score of 3.52. May’s action saw the fund return to a column of X’s against SPXEWI suggesting near-term strength for the cap-weighted names. Support is seen at $385 on the default chart, March lows.
The Invesco S&P 500 Top 50 ETF XLG returned to a column of O’s this week, seen at a chart reading of $34.50. The fund remains on a string of now three consecutive buys signals, suggesting strength from larger names. Furthermore, XLG now has a near-perfect 5.61 fund score with a now positive score direction of 3.54. XLG scores above the average US Fund of 3.52. Support is seen at $28.50 on the default chart, notably below current levels.
Average Level
-28.99
| < - -100 | -100 - -80 | -80 - -60 | -60 - -40 | -40 - -20 | -20 - 0 | 0 - 20 | 20 - 40 | 40 - 60 | 60 - 80 | 80 - 100 | 100 - > |
|---|---|---|---|---|---|---|---|---|---|---|---|
|
Buy signalqqq
|
|||||||||||
|
Buy signalVOOV
|
|||||||||||
|
Sell signaldvy
|
|||||||||||
|
Buy signaliwm
|
|||||||||||
|
Buy signalRSP
|
|||||||||||
|
Buy signalspy
|
|||||||||||
|
Buy signalhyg
|
|||||||||||
|
Buy signalvoog
|
|||||||||||
|
Sell signalief
|
Buy signalefa
|
Sell signalijh
|
|||||||||
|
Sell signallqd
|
Buy signaleem
|
Buy signalXLG
|
|||||||||
|
Sell signalagg
|
Buy signalicf
|
Buy signalijr
|
Buy signalshy
|
Buy signalgsg
|
|||||||
|
Sell signaltlt
|
Sell signalGLD
|
Buy signaloneq
|
Buy signalfxe
|
Buy signaldia
|
Buy signalgcc
|
Sell signaldx/y
|
Buy signaluso
|
||||
| < - -100 | -100 - -80 | -80 - -60 | -60 - -40 | -40 - -20 | -20 - 0 | 0 - 20 | 20 - 40 | 40 - 60 | 60 - 80 | 80 - 100 | 100 - > |
| AGG | iShares US Core Bond ETF |
| USO | United States Oil Fund |
| DIA | SPDR Dow Jones Industrial Average ETF |
| DVY | iShares Dow Jones Select Dividend Index ETF |
| DX/Y | NYCE U.S.Dollar Index Spot |
| EFA | iShares MSCI EAFE ETF |
| FXE | Invesco CurrencyShares Euro Trust |
| GLD | SPDR Gold Trust |
| GSG | iShares S&P GSCI Commodity-Indexed Trust |
| HYG | iShares iBoxx $ High Yield Corporate Bond ETF |
| ICF | iShares Cohen & Steers Realty ETF |
| IEF | iShares Barclays 7-10 Yr. Tres. Bond ETF |
| LQD | iShares iBoxx $ Investment Grade Corp. Bond ETF |
| IJH | iShares S&P 400 MidCap Index Fund |
| ONEQ | Fidelity Nasdaq Composite Index Track |
| QQQ | Invesco QQQ Trust |
| RSP | Invesco S&P 500 Equal Weight ETF |
| IWM | iShares Russell 2000 Index ETF |
| SHY | iShares Barclays 1-3 Year Tres. Bond ETF |
| IJR | iShares S&P 600 SmallCap Index Fund |
| SPY | SPDR S&P 500 Index ETF Trust |
| TLT | iShares Barclays 20+ Year Treasury Bond ETF |
| GCC | WisdomTree Continuous Commodity Index Fund |
| VOOG | Vanguard S&P 500 Growth ETF |
| VOOV | Vanguard S&P 500 Value ETF |
| EEM | iShares MSCI Emerging Markets ETF |
| XLG | Invesco S&P 500 Top 50 ETF |

| Symbol | Company | Sector | Current Price | Action Price | Target | Stop | Notes |
|---|---|---|---|---|---|---|---|
| GPK | Graphic Packaging Intl. | Forest Prods/Paper | $21.87 | 21 - 23 | 26 | 18 | 5 for 5'er, #2 of 15 in favored FORE sector matrix, LT pos mkt RS, triple top, 1.3% yield |
| V | Visa Inc. | Finance | $237.37 | 210s - 220s | 262 | 188 | 5 for 5'er top third of FIN sector matrix, LT pos mkt RS, spread quintuple top |
| BJRI | BJ's Restaurants Inc. | Restaurants | $30.91 | low 30s | 55 | 26 | 3 for 5'er, top third of favored REST sector matrix, triple top, pullback from 52-week high, R-R>3.5 |
| SEM | Select Medical Holdings Corporation | Healthcare | $28.04 | hi 20s - lo 30s | 52.50 | 23 | 5 TA rating, top third of HEAL sector matrix, LT RS buy, normalized prices, recent pos. wkly mom., R-R > 3 |
| MDLZ | Mondelez International, Inc. Class A | Food Beverages/Soap | $71.20 | hi 60s - mid 70s | 95 | 59 | 4 for 5'er. top 25% of favored FOOD sector matrix, multiple buy signals, pullback from ATH, 2.1% yield |
| AJG | Arthur J. Gallagher & Co. | Insurance | $220.48 | hi 200s - hi 210s | 298 | 180 | 5 for 5'er, 10 of 71 in favored INSU sector matrix, LT pos mkt RS, R-R>2.0 |
| RSG | Republic Services, Inc. | Waste Management | $145.79 | lo 140s - mid 150s | 190 | 120 | 5 TA rating, top third of WAST sector matrix, consec. buy signals, pos. wkly mom. |
| ALKS | Alkermes Incorporated | Biomedics/Genetics | $28.72 | hi 20s - low 30s | 48 | 24 | 5 for 5'er, top half of favored BIOM sector matrix, spread triple top, pull back from 52-week high, R-R>3.0 |
| ACA | Arcosa Inc | Transports/Non Air | $75.46 | low-to-mid $70s | 98 | 65 | 4 for 5'er, #8 of 50 in favored TRAN sector matrix, one box from peer RS buy signal, R-R>2.0 |
| LIN | Linde Plc | Chemicals | $376.36 | 370s - 380s | 440 | 316 | 5 for 5'er, #6 of 47 in favored CHEM sector matrix, LT pos mkt RS, triple top, 1.35% yield |
| FERG | Ferguson PLC | Building | $155.54 | lo 150s - mid 160s | 204 | 132 | 4 TA rating, LT mkt RS buy & pos. trend, consec. buy signals, near-term price consolidation |
| LULU | Lululemon Athletica Inc. | Retailing | $376.30 | 370s - 390s | 452 | 320 | 5 for 5'er, top 25% of RETA sector matrix, triple top, Earn. 8/30 |
| HWC | Hancock Whitney Corp | Banks | $41.19 | hi 30s - mid 40s | 66 | 34 | 5 TA rating, top half of BANK sector matrix, LT RS buy, pos. wkly mom., 2.83% yield |
| ALLE | Allegion PLC | Protection Safety Equipment | $105.87 | 110s | 139 | 98 | 4 for 5'er, top half of favored PROT sector matrix, pullback from 52-week high, 1.5% yield |
| HLT | Hilton Worldwide Holdings Inc | Leisure | $149.79 | 150s | 188 | 128 | 5 for 5'er, top half of favored LEIS sector matrix, LT pos mkt RS |
| WELL | Welltower Inc. | Real Estate | $81.79 | hi - lo 80s | 100 | 72 | 5 TA rating, top quintile of REAL sector matrix, 52-wk highs, LT RS buy |
| CC | The Chemours Company | Chemicals | $32.44 | mid 30s | 52 | 29 | 5 for 5'er, #3 of 47 in favored CHEM sector matrix, spread quad top, 2.7% yield |
| APAM | Artisan Partners Asset Management, Inc | Finance | $36.45 | mid 30s - lo 40s | 54 | 31 | 4 TA rating, top quintile of FINA sector matrix, consec. buy signals, buy-on-pullback, R-R > 2 |
| SYK | Stryker Corporation | Healthcare | $277.93 | mid 270s - mid 290s | 356 | 248 | 4 for 5'er, 41 of 122 in HEAL sector matrix, LT pos mkt RS, pullback from ATH |
| ARES | Ares Management Corp | Finance | $97.55 | mid 90s - low 100s | 122 | 84 | 5 for 5'er, top 10% of FINA sector matrix, LT pos mkt RS, multiple consec buy signals, 2.9% yield |
| GS | Goldman Sachs Group, Inc. | Wall Street | $327.52 | 330 - mid 360s | 452 | 284 | 4 TA rating, top half of WALL sector matrix, buy-on-pullback, pos. monthly mom., 3.11% yield |
| ATO | Atmos Energy Corp | Gas Utilities | $116.68 | mid 110s - low 120s | 144 | 104 | 4 for 5'er top half GUTI sector matrix, spread quad top, pullback from ATH, R-R>2.0, 2.5% yield |
| IRM | Iron Mountain Inc. | Business Products | $58.56 | hi 50s - lo 60s | 71 | 48 | 4 TA rating, top third of BUSI sector matrix, consec. buy signals, buy-on-pullback, 4.21% yield |
| KLAC | KLA Corp | Semiconductors | $472.95 | 460s - low 490s | 548 | 408 | 5 for 5'er, top 20% of favored SEMI sector matrix, LT pos mkt RS, triple top, pullback from ATH |
| ROKU | Roku, Inc. Class A | Media | $77.23 | hi 70s - mid 80s | 159 | 67 | 4 for 5'er, #1 in MEDI sector matrix, triple top, pullback from 52-week high, R-R>5.0 |
| CIVI | Civitas Resources Inc. | Oil | $79.01 | mid 70s - low 80s | 91 | 63 | 4 TA rating, top quartile of OIL sector matrix, consec. buy signals, LT RS buy, buy-on-pullback, 8.87% yield |
| GOOGL | Alphabet Inc. Class A | Internet | $129.92 | mid 120s - mid 130s | 158 | 104 | 5 TA rating, top quintile of INET sector matrix, LT RS buy, normalized prices, pos. wkly mom. |
| JPM | J.P. Morgan Chase & Co. | Banks | $148.63 | mid 140s - low 150s | 170 | 122 | 4 for 5'er, top quintile of BANK sector matrix, LT pos peer RS, spread quad top, 2.65% yield |
| Symbol | Company | Sector | Current Price | Action Price | Target | Stop | Notes |
|---|
| Comment | |||||||
|---|---|---|---|---|---|---|---|
|
|
|||||||
JPM J.P. Morgan Chase & Co. R ($148.98) - Banks - JPM is a 4 for 5'er that ranks in the top quintile of the banks sector matrix and has been on a peer RS buy signal since 2007. On its default chart, JPM has completed two consecutive buy signals, most recently breaking a spread quadruple top, and reached a new 52-week high last month before pulling back to the middle of its trading band. Long exposure may be added in the mid $140s to low $150s and we will set our initial stop at $122, which would take out JPM's March low. We will use the bullish price objective, $170, as our target price. JPM also carries a 2.65% yield.
| 22 | 23 | |||||||||||||||||||||||||||||||||||||||||||||||||||
| 170.00 | • | 170.00 | ||||||||||||||||||||||||||||||||||||||||||||||||||
| 168.00 | • | X | • | 168.00 | ||||||||||||||||||||||||||||||||||||||||||||||||
| 166.00 | O | X | O | • | 166.00 | |||||||||||||||||||||||||||||||||||||||||||||||
| 164.00 | O | X | O | • | 164.00 | |||||||||||||||||||||||||||||||||||||||||||||||
| 162.00 | O | 1 | O | • | Top | 162.00 | ||||||||||||||||||||||||||||||||||||||||||||||
| 160.00 | O | X | O | • | 160.00 | |||||||||||||||||||||||||||||||||||||||||||||||
| 158.00 | C | X | O | X | • | X | 158.00 | |||||||||||||||||||||||||||||||||||||||||||||
| 156.00 | O | X | O | X | O | • | X | O | 156.00 | |||||||||||||||||||||||||||||||||||||||||||
| 154.00 | O | X | O | X | O | • | X | O | 154.00 | |||||||||||||||||||||||||||||||||||||||||||
| 152.00 | O | O | X | O | • | X | 8 | 152.00 | ||||||||||||||||||||||||||||||||||||||||||||
| 150.00 | O | X | 2 | O | X | • | X | O | 150.00 | |||||||||||||||||||||||||||||||||||||||||||
| 148.00 | O | X | O | X | O | X | O | • | 7 | Mid | 148.00 | |||||||||||||||||||||||||||||||||||||||||
| 146.00 | O | X | O | X | O | X | O | • | X | 146.00 | ||||||||||||||||||||||||||||||||||||||||||
| 144.00 | O | X | O | O | X | O | • | X | 3 | X | X | 144.00 | ||||||||||||||||||||||||||||||||||||||||
| 142.00 | O | X | O | X | O | X | • | X | 2 | O | X | O | X | 6 | O | X | 142.00 | |||||||||||||||||||||||||||||||||||
| 140.00 | • | O | O | 3 | X | X | O | • | X | O | X | O | X | O | X | 5 | O | X | O | X | 140.00 | |||||||||||||||||||||||||||||||
| 138.00 | • | O | X | O | X | O | • | X | X | O | X | O | O | X | O | X | O | X | O | • | 138.00 | |||||||||||||||||||||||||||||||
| 136.00 | O | X | O | X | 4 | • | X | O | X | 1 | O | X | O | X | O | X | O | X | • | 136.00 | ||||||||||||||||||||||||||||||||
| 134.00 | O | O | X | O | • | X | O | X | O | X | O | O | X | X | O | O | X | • | 134.00 | |||||||||||||||||||||||||||||||||
| 132.00 | O | X | O | X | X | • | X | C | X | O | X | O | X | O | 4 | O | • | Bot | 132.00 | |||||||||||||||||||||||||||||||||
| 130.00 | O | X | O | X | O | X | O | • | X | O | O | O | X | O | X | • | 130.00 | |||||||||||||||||||||||||||||||||||
| 128.00 | O | O | X | O | X | O | • | B | O | O | X | • | 128.00 | |||||||||||||||||||||||||||||||||||||||
| 126.00 | O | O | 5 | X | 6 | • | X | O | X | • | 126.00 | |||||||||||||||||||||||||||||||||||||||||
| 124.00 | O | X | O | X | O | X | • | X | O | • | 124.00 | |||||||||||||||||||||||||||||||||||||||||
| 122.00 | O | X | O | X | X | O | X | O | • | X | • | • | 122.00 | |||||||||||||||||||||||||||||||||||||||
| 120.00 | O | O | X | O | X | O | X | O | X | • | X | • | 120.00 | |||||||||||||||||||||||||||||||||||||||
| 118.00 | O | X | O | X | O | X | 8 | O | X | O | • | X | • | 118.00 | ||||||||||||||||||||||||||||||||||||||
| 116.00 | O | O | O | X | O | X | O | X | O | • | X | • | 116.00 | |||||||||||||||||||||||||||||||||||||||
| 114.00 | O | X | O | X | O | X | O | X | • | 114.00 | ||||||||||||||||||||||||||||||||||||||||||
| 112.00 | O | O | X | 9 | O | A | X | • | 112.00 | |||||||||||||||||||||||||||||||||||||||||||
| 110.00 | 7 | X | O | X | O | X | • | 110.00 | ||||||||||||||||||||||||||||||||||||||||||||
| 108.00 | O | O | X | O | X | • | 108.00 | |||||||||||||||||||||||||||||||||||||||||||||
| 106.00 | O | O | X | • | 106.00 | |||||||||||||||||||||||||||||||||||||||||||||||
| 104.00 | O | X | • | 104.00 | ||||||||||||||||||||||||||||||||||||||||||||||||
| 102.00 | O | • | 102.00 | |||||||||||||||||||||||||||||||||||||||||||||||||
| 100.00 | • | 100.00 | ||||||||||||||||||||||||||||||||||||||||||||||||||
| 22 | 23 |
| BOOT Boot Barn Holdings Inc ($92.72) - Retailing - BOOT reversed into Os and broke a double bottom at $91 for a second sell signal since the stock peaked at $104 earlier this month. The stock still maintains a 5 attribute rating and ranks within the top decile in the Retailing sector matrix. Support now lies in the $90 to $89 range, while the bullish support line lies at $76. From here, a move above $97 would return the stock to a buy signal and be a potential bearish signal reversal. |
| CE Celanese Corporation ($117.70) - Chemicals - CE fell to a sell signal Friday when it broke a double bottom at $116, and now sits one box above its bullish support line. The technical picture remains positive as CE is a 3 for 5'er and ranks sixth out of 47 names in the chemicals sector matrix. Beyond the bullish support line, the next level of support sits at $110. |
| COF Capital One Financial Corporation ($104.52) - Finance - COF shares moved lower today to break a double bottom at $104 to mark its first sell signal. This 4 for 5'er has been in a positive trend since May and on an RS buy signal versus the market since December 2020. COF shares are trading below the middle of their trading band with a weekly overbought/oversold reading of -47%. From here, support is offered at $86. |
| DXCM Dexcom Inc. ($106.01) - Healthcare - DXCM shares moved lower today to break a double bottom to mark its second consecutive sell signal. This 4 for 5'er has been in a negative trend since early August but on an RS buy signal versus the market since October 2022. DXCM shares are trading in heavily oversold territory with a weekly overbought/oversold reading of -82%. From here, support is offered at $106. |
| FIVE Five Below Inc ($194.80) - Household Goods - FIVE reversed into Os and broke a spread triple bottom at $188 for a second sell signal since rallying to $208. This brings the stock to test its bullish support line, which would be violated with a move below $186. A trend flip would drop the stock to a 4 for 5'er. Support lies at $186 and then $166 on the default chart, the June chart low. |
| KEYS Keysight Technologies Inc ($128.02) - Electronics - KEYS fell Friday after their earnings release to break a double bottom at $148, marking a second consecutive sell signal before dropping over 14% intraday to a new multi-year low at $126. This also violated the bullish support line and saw the stock give an RS sell signal against the market, dropping it to a 0 for 5 TA rating. The weight of the technical evidence is weak and deteriorating rapidly. However, the stock is now in a very ashed-out position, suggesting those with current exposure may consider it a sell-on-rally candidate. Overhead resistance may be seen initially at $156. |
| KMX Carmax Group ($81.66) - Autos and Parts - KMX reversed into Os and broke a triple bottom at $81 for the first sell signal since April. The stock fell to $79, taking out support at $81 and leading to a test of support at $78. With the breakdown, KMX also violates its bullish support line, flipping the trend to negative and dropping the stock to a 2 for 5'er. Below $78, additional support lies in the $67 to $71 range. Meanwhile, a move above $86 would return the stock to a buy signal and flip the trend back positive. |
| MCO Moody's Corporation ($326.17) - Finance - MCO shares moved lower today to break a double bottom at $328 to mark its first sell signal. This 4 for 5'er has been in a positive trend since April but on an RS sell signal versus the market since June 2022. MCO shares are trading in oversold territory with a weekly overbought/oversold reading of -46%. From here, support is offered at $300. |
| SKX Skechers U.S.A, Inc. ($50.98) - Textiles/Apparel - SKX broke a double bottom at $50 to return to a sell signal. This brings the 5 for 5'er down to test the June chart low at current levels. The stock still ranks in the top quartile of the Textiles/Apparel sector matrix, and if support at current chart levels is held, the stock could be considered upon a reversal into Xs back to the middle of the trading band at $53. Additional support lies at $47 and $46, the bullish support line. |
| Name | Option Symbol | Action | Stop Loss |
|---|---|---|---|
| Walmart Inc. - $157.97 | O: 23K155.00D17 | Buy the November 155.00 calls at 8.70 | 144.00 |
| Name | Option | Action |
|---|---|---|
| Boston Scientific Corporation ( BSX) | Aug. 50.00 Calls | Expired at 0.19 |
| The Coca-Cola Company ( KO) | Aug. 62.50 Calls | Expired at 0 |
| Name | Option Symbol | Action | Stop Loss |
|---|---|---|---|
| Advanced Micro Devices, Inc. - $105.69 | O: 23X105.00D15 | Buy the December 105.00 puts at 9.85 | 114.00 |
| Name | Option | Action |
|---|---|---|
| Abbott Laboratories (ABT) | Aug. 100.00 Puts | Expired at 0 |
| Truist Financial Corp (TFC) | Sep. 32.50 Puts | Initiate an option stop loss of 2.80 (CP: 3.80) |
| NIKE, Inc. (NKE) | Oct. 110.00 Puts | Initiate an option stop loss of 6.10 (CP: 8.10) |
| Sealed Air Corporation (SEE) | Oct. 45.00 Puts | Raise the option stop loss to 8.20 (CP: 10.20) |
| Cincinnati Financial Corporation (CINF) | Dec. 110.00 Puts | Raise the option stop loss to 6.60 (CP: 8.60) |
| U.S. Bancorp (USB) | Dec. 37.50 Puts | Initiate an option stop loss of 2.20 (CP: 3.20) |
| Amgen Inc. (AMGN) | Jan. 265.00 Puts | Initiate an option stop loss of 11.80 (CP: 13.80) |
| Name | Option Sym. | Call to Sell | Call Price | Investment for 500 Shares | Annual Called Rtn. | Annual Static Rtn. | Downside Protection |
|---|---|---|---|---|---|---|---|
| Arista Networks Inc $182.76 | O: 23L185.00D15 | Dec. 185.00 | 15.80 | $83,402.20 | 30.14% | 25.44% | 7.66% |
| Name | Action |
|---|---|
| CrowdStrike Holdings, Inc. Class A (CRWD) - 144.38 | Sell the October 155.00 Calls. |
| Palantir Technologies Inc. Class A (PLTR) - 14.15 | Sell the November 18.00 Calls. |
| Schlumberger Limited (SLB) - 57.89 | Sell the November 60.00 Calls. |
| Caesars Entertainment Inc. (CZR) - 52.70 | Sell the December 60.00 Calls. |
| Halliburton Company (HAL) - 39.27 | Sell the January 42.00 Calls. |
| Apache Corporation (APA) - 44.05 | Sell the January 47.50 Calls. |
| Carnival Corporation (CCL) - 15.80 | Sell the January 17.50 Calls. |
| Hess Corporation (HES) - 154.29 | Sell the November 160.00 Calls. |
| Name | Covered Write |
|---|---|
|
|
|
Daily Equity & Market Analysis
Loading, Please Wait...
