The Hang Seng Index (HSI-HK) descended into bear market territory over the past week as concern around China's economy spreads.
Concern around the Chinese economy led shares in Hong Kong lower this week, as the Hang Seng Index HSI-HK fell -5.89% over the past five days to drop into bear market territory. On Thursday, China Evergrande Group, one of the largest property developers on the Mainland, filed for Chapter 15 bankruptcy in New York, which would allow bankruptcy proceedings to move into effect for the three Evergrande companies based in Hong Kong, the British Virgin Islands, and the Cayman Islands (source: wsj.com). This move was also paired with further stress from Zhongrong International Trust, an asset manager in China that had around $108 billion in AUM at the end of last year, as the privately held company missed interest and principal payments to publicly listed companies in China totaling $14 million (source: wsj.com).
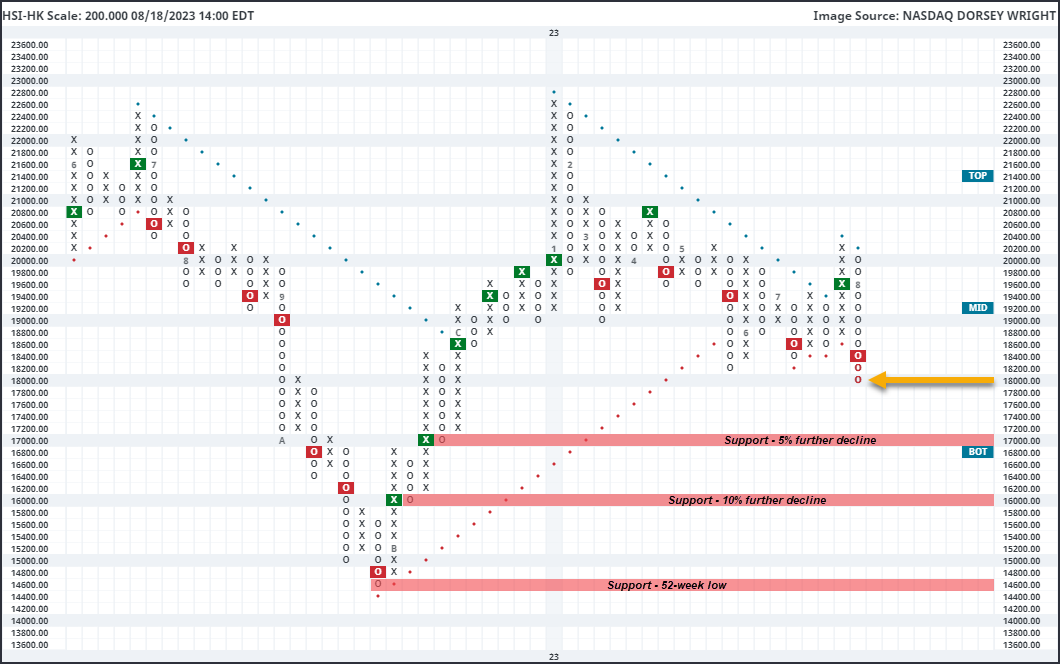
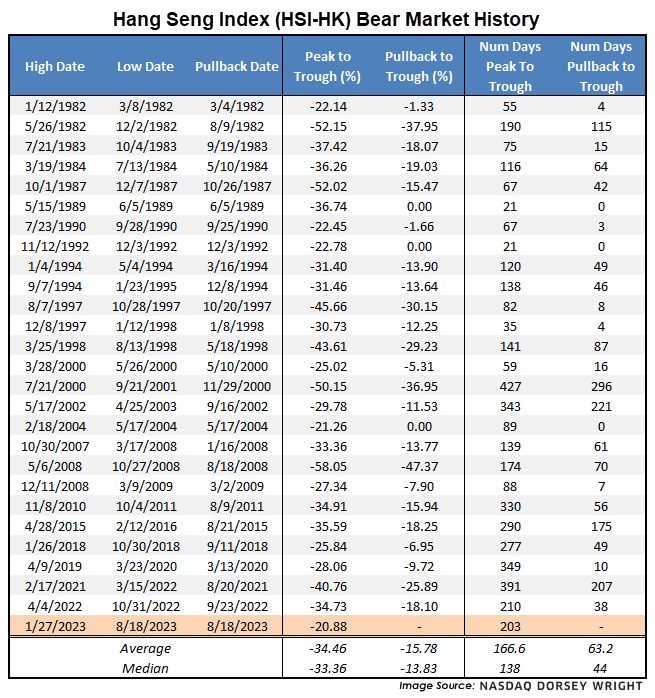
The Hang Seng Index dropped over 2% during the market action on Friday, pushing HSI-HK down below the 18,000 level on the longer-term focused 200-point chart for the first time since November 2022. The Index has now declined 20.88% from its recent peak of 22,688 seen on January 27, initiating the 27th bear market we have seen since our index data began in 1982. The average decline from each bear market sits at almost 34%, which is directly in line with the peak-to-trough move in the last bear market from April 4 – October 31, 2022. The current decline sits at 203 days, which is longer than the average bear market period of about 166 days. The Hang Seng has averaged just over 60 days from the date of each 20% decline to the ultimate trough in each period. Of course, some of those declines saw an abrupt end to the weakness as soon as the 20% threshold was breached, as we saw in 2004, 1992, and 1989. Others saw extensive weakness, highlighting the potential for further weakness.
The 200-point chart of the HSI-HK broke through support from May of this year at 18,200 this week after returning to a sell signal at 18,400. This move also pushed the index back into a negative trend. In July, we saw a brief resurgence from the Hang Seng, as the index broke a triple top before failing to break through further resistance at 20,200. The inability of the index to break through key resistance points this year does not bode well for the relationship between buyers and sellers moving forward. Weekly momentum also just flipped negative, suggesting the potential for further downside from here. Initial support on the longer-term focused 200-point chart can be seen at 17,000, which would be another 5% drop from current levels. Additional support may be found at 16,000, which would mark a 10% further decline, with the 52-week low sitting down at 14,600.