Most Requested Symbols

Stocks continued further into overbought territory on Wednesday and Thursday despite a hawkish pause from the Fed.
The average distribution level is 19.65%.
Today's featured stock is Valvoline Inc. (VVV).
Comments include: AMT, BMWYY, CF, FTNT, LEN, MAR, META, & RPM.
Call: Visa (V); Put: General Dynamics (GD); Covered Write: Take-Two Interactive (TTWO)
NDW Morning Update Video - June 16, 2023
NDW Morning Update Video – June 16, 2023.
Click here to download MP3
Beginners Series Webinar: Join us on Friday, June 16th at 2 PM (ET) for our NDW Beginners Series Webinar. This week's topic is: Fund Score Composition and the Asset Class Group Scores Page. Register Here
Yesterday’s Were You Aware discussed a recent development on the Asset Class Group Scores (ACGS) page, which saw cap-weighted assets move above equal-weighted assets for the first time in over two years from an average score perspective. This comes off the back of a stellar rally for the broad indices, seeing SPX journey within 10% of all-time highs from December of 2021. While plenty of work is left to do before such a level would be a serious consideration, the mention alone of such a feat after a rocky 2022 speaks to the magnitude of recent upside participation. Yesterday’s article briefly discussed such an idea, with cap-weighted assets earning strong marks across many parts of our platform.
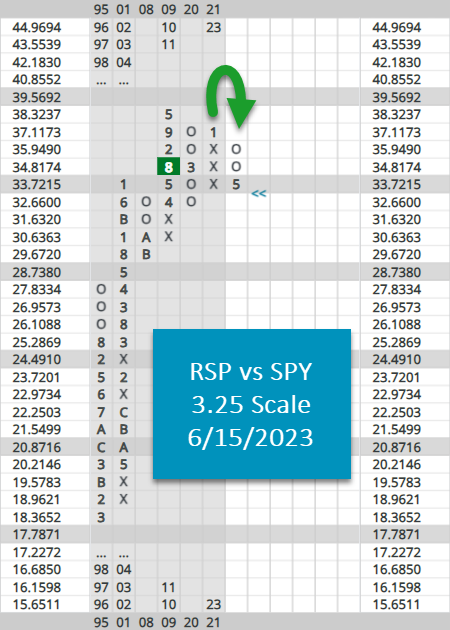
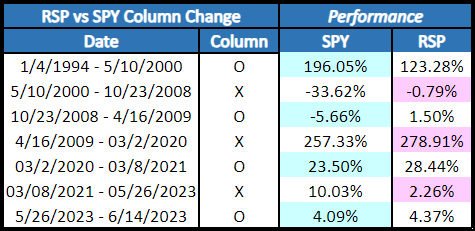
One of those areas was the recent flip of near-term relative strength (RS) between cap-weighted proxy SPY and equal-weighted proxy RSP on a 3.25 scale. As the funds are so similar, reversals (or eventual signal changes) are certainly worth noting and could be used as a sign of market attitude for the time being. As seen in the chart below, May’s reversal will mark only the 6th instance of such a change in nearly three decades. As with other relative strength charts on the platform, one could choose to employ a “switching” strategy, which simply invests in the asset that is in a column of X’s (or on a buy signal, but that won’t be used for today’s report), focusing your assets into the “winner” of the battle. Included below is a table of such a strategy. Note that the chart below considers being in a column of O’s as a preference for SPY, while a column of X’s suggests an investment in RSP. While not each reversal has been a “hit” by an outperformance standard, its worth mentioning that the strategy did shield investors (from a purely relative standpoint) from a bulk of the GFC, and has an impressive 42% average outperformance when the indicator is on the right side of the trade. Take that, in comparison to a 5% underperformance when the reversal “misses”.
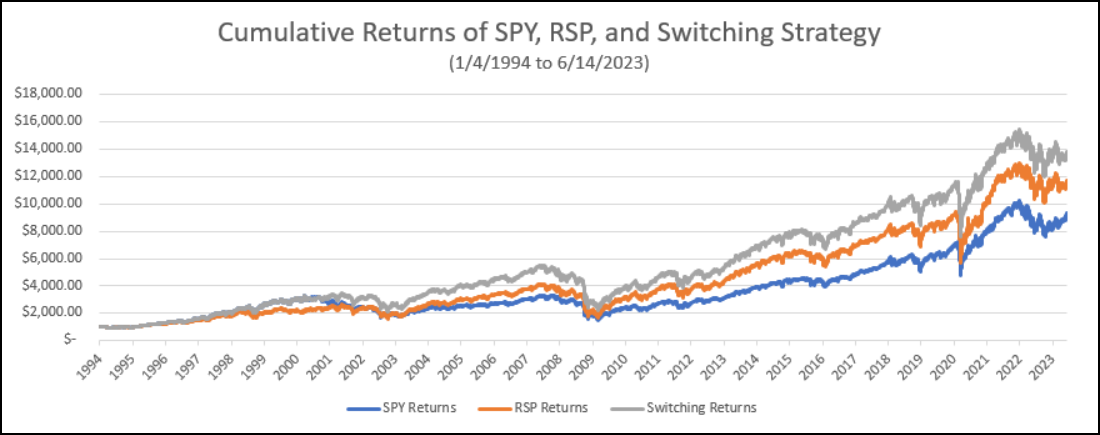
As an added test, we ran our “switching” portfolio up against simply owning each asset on its own throughout the entire period (1/4/1994-6/15/23). The point being, we know our reversal portfolio does experience occasional “head fakes”, and are aiming to isolate a pure point A to point B scenario. As seen in the chart below, following such a strategy does indeed best a pure “buy and hold” strategy for each asset on its own.

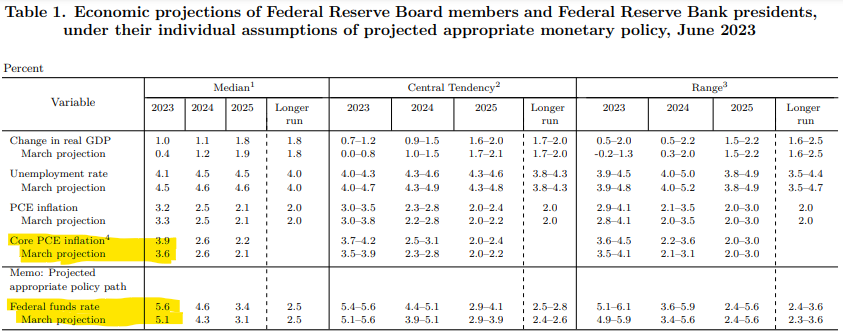
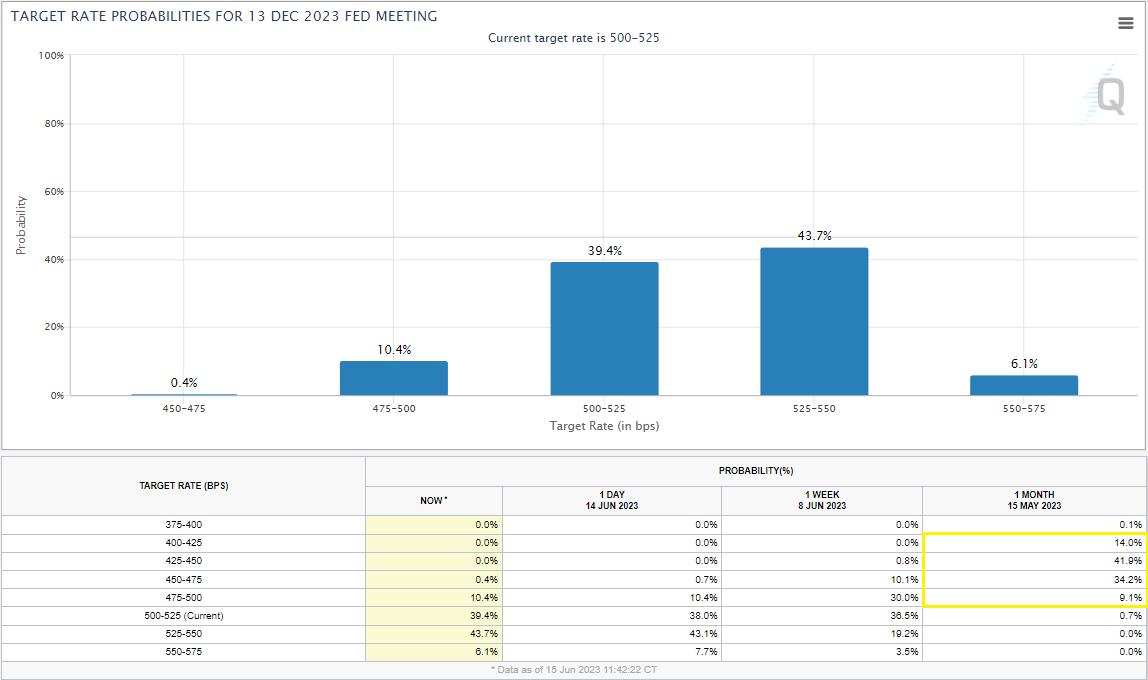
The Fed wrapped up its June meeting on Wednesday, leaving the target for the Fed funds rate unchanged at 500 – 525 bps, as had been widely expected. On the surface, the pause or skip in rate hikes could seem like a dovish pivot from the Fed, however, the rate decision belied a pronounced hawkishness in the summary of economic projections. The economic projections showed FOMC member’s median projection for core PCE this year, the fed’s preferred gauge of inflation, rose to 3.9%, up from 3.6% in March, while the median projection for the fed funds rate in 2023, climbed to 5.6%, up from 5.1%. The upgraded projection for the fed funds rate indicates that FOMC members see two additional 25 basis point increases from the current target of 500 – 525 bps before the end of the year. The Fed futures market shifted following the meeting and is no longer pricing in a rate cut by the end of the year; a month ago, the market was pricing in nearly a 100% probability of at least one 25 bps cut by the end of the year, with a 75% chance of at least 50 bps of cuts.
The market seems to have digested the shift in expectations well, at least initially, the S&P 500 (SPX) closed at a fresh 52-week high on Wednesday and continued higher on Thursday, printing Xs at 4400 and 4420 on its default chart. Meanwhile, after rising initially, the 10-year US Treasury yield finished down on Wednesday and was lower again on Thursday, lifting bond prices.
The continued rally in US equities following the Fed meeting has pushed the major US indices even further into heavily overbought territory. SPX reached a weekly overbought/oversold (OBOS) reading north of 114% intraday on Thursday, its highest reading since January 2020 and the first time it has crossed the 110% level since August 2020. Meanwhile, the Nasdaq 100 (NDX) which has led the push higher, hit an intraday OBOS of 157%, which is higher than any weekly closing value in the data, which goes back to 1992. In January 1999, NDX reached an OBOS reading of 142.61%, the highest weekly closing value on record. It is certainly possible that NDX has reached more overbought levels on an intraday or intraweek basis, but it is clear the index is currently extended to near historic levels.
With the major indexes currently at historically overbought levels, one of the glaring questions is how much further can this rally go? Of course, we all know that the last time the S&P 500 was 115% overbought, in January 2020, it experienced precipitous drop a within a few weeks. However, given the events surrounding that collapse, it would be a stretch to conclude it was a reaction to the overbought state of the market. The last time SPX was more than 110% overbought, at the end of August 2020, the index pulled back roughly 4.5% over the next 30 days before ultimately resuming its rally and reaching a new all-time high in October. In January 2000, NDX reached 2000 and north of 140% overbought, the index pulled back to 1840 but ultimately reached 2100 before the end of the month.
Looking at these three examples, it may seem like a pullback is imminent. Keep in mind, however, we are looking at prior peaks in the OBOS, which all but necessitates that the market pulled back or consolidated shortly thereafter – if it had continued higher for another week or two, the OBOS would likely have continued higher as well. On February 28, 2020, the S&P reached -126% oversold, it's lowest reading since 2008 when it reached -148%, but the index dropped another 22% before bottoming on March 20 and reaching 184% oversold. The point is that the OBOS can tell us that a move is overdone, but not that it can't extend further and sometimes substantially.
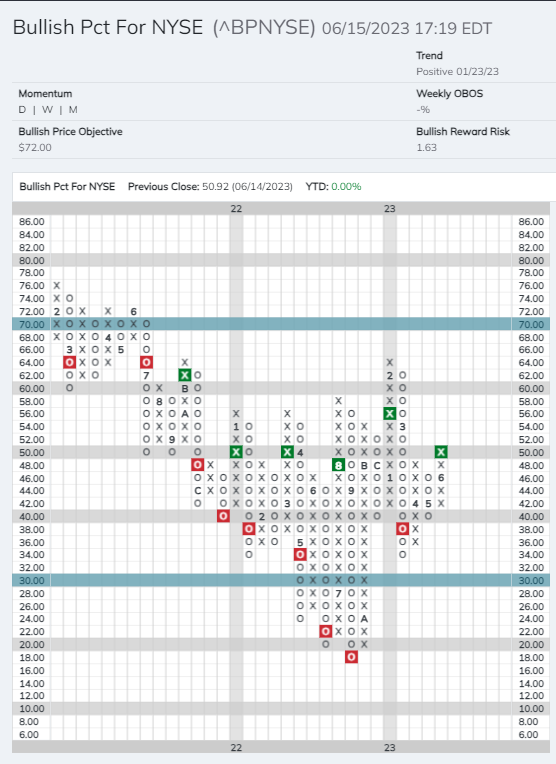
As mentioned above, SPX reached 4420 on Thursday, surpassing its bullish price objective of 4400. Meanwhile, the Nasdaq-100 closed at 15,225, a little more than 1% away from the 15400 bullish price objective on its default chart. Another data point suggesting that the current rally may be getting long in the tooth. However, as mentioned in Wednesday’s report most of the bullish percent charts remain in the middle field position. The Bullish Percent for the NYSE (^BPNYSE) and Bullish Percent for the S&P 500 (^BPSPX) sit in Xs and 50% and 58%, respectively. Even the Bullish Percent for the Nasdaq-100 (^BPNDX) has yet to cross the 70% level, it currently sits in Xs at 66%. The field position of the BPs suggests there is room for breadth to increase, potentially allowing less-extended areas of the market to support a continued push higher.
Emerging markets have marched higher this week, leading the iShares Emerging Market ETF EEM to return to a buy signal as discussed in yesterday’s International Equity Overview. Another topic of conversation in the International Overview was Latin America – namely Brazil – which has been the primary driver behind recent performance within the emerging markets. China has been another emerging market to have a positive performance this week, but the breadth of funds showing positive absolute and relative performance within Latin America has led to scoring improvement. Looking at the Latin America group within the Asset Class Group Scores page and the group moved above the 5-threshold following Wednesday’s action. Latin America is the only group scoring above 5 and since sits in first. This is the first time since the latter part of 2017 the group has been above this threshold, and Latin America leads Japan and Europe among those groups scoring above 4 and in the blue-sky zone.
Over the past decade, there have only been a handful of times that Latin America has attained a score of 5 or above, and many were brief lasting less than a single trading week. There has only been one period over the last decade that the Latin America group has maintained above 5 for two weeks of trading or more. Most of the periods in which Latin America scored above 5 came during the early to mid-2000s; bear in mind the score data set for the group begins in November 2003.
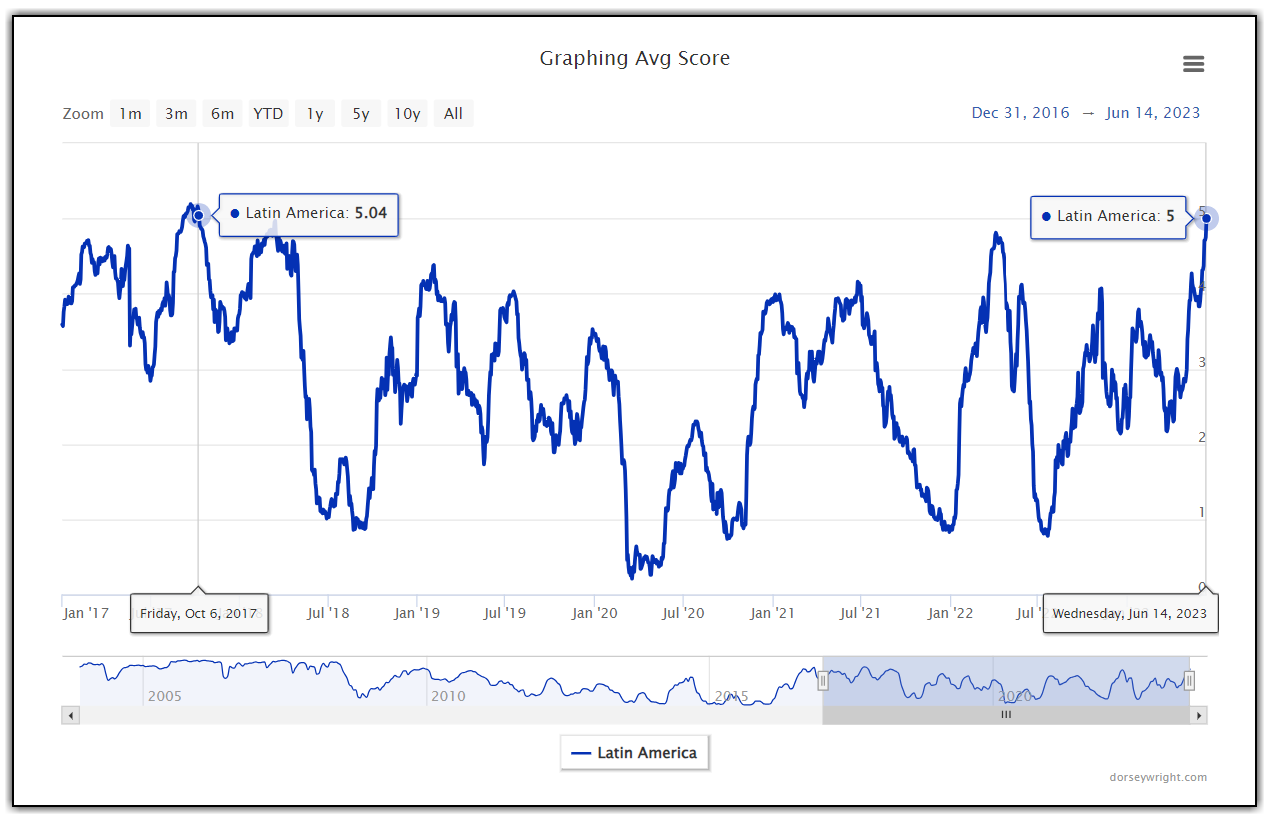
With the Latin America group moving above 5, we ran performance while the group remained above the 5 thresholds as well as looked at forward returns following the group moving above the score of 5. The proxy utilized for the performance of the region is the iShares S&P Latin America 40 ETF ILF due to its trading history and volume. Since November 2003, there have been ten instances in which the Latin America group scored above 5 for more than just a couple of weeks’ worth of trading (eliminating clusters within the same month). As noted above, many instances occurred from 2003 (the beginning of the score data set) through 2008 and there has only been one instance of the group scoring above 5 that lasted longer than a couple weeks within the last decade. On average, when the groups maintain above 5 for more than a brief couple of weeks, ILF has been up over 15% and the group has maintained above the 5 threshold for just shy of a full quarter.
Looking at forward returns of ILF following the Latin America group moving above the 5-threshold yield similar positive results. On average, ILF has positive returns across all the observable forward time frames, and the majority of the instances were positive with at least 80% being positive from 1-week to 6-months. Although the 12-month period had six out of ten instances positive, the last four occurrences saw ILF down more than 16% 12 months after reaching a score of five.
Whenever the Latin America group can maintain a score above five for more than just a couple of weeks, results have been positive. With the group just moving above the score of 5 on the Asset Class Group Scores page there is no way to say that the group will maintain there for two or more weeks or not. Initial exposure to the Latin American region could be taken – if it hasn’t already – and then monitored for that 2-week threshold of the Latin America group scoring above 5. This would then provide further evidence that the group’s strength isn’t just a flash in the pan, and investors could confidently increase exposure knowing returns have been positive within six months.


Average Level
19.65
| < - -100 | -100 - -80 | -80 - -60 | -60 - -40 | -40 - -20 | -20 - 0 | 0 - 20 | 20 - 40 | 40 - 60 | 60 - 80 | 80 - 100 | 100 - > |
|---|---|---|---|---|---|---|---|---|---|---|---|
|
Sell signalief
|
Sell signalGLD
|
Buy signalefa
|
Buy signalvoog
|
||||||||
|
Sell signaluso
|
Sell signalgsg
|
Sell signaldx/y
|
Buy signalRSP
|
Buy signalXLG
|
|||||||
|
Sell signalagg
|
Sell signalTLT
|
Buy signalfxe
|
Buy signalhyg
|
Buy signaldia
|
Sell signalijh
|
Buy signaleem
|
Buy signaloneq
|
||||
|
Buy signalshy
|
Sell signallqd
|
Sell signalgcc
|
Sell signaldvy
|
Sell signalicf
|
Buy signalijr
|
Buy signaliwm
|
Buy signalVOOV
|
Buy signalspy
|
Buy signalqqq
|
||
| < - -100 | -100 - -80 | -80 - -60 | -60 - -40 | -40 - -20 | -20 - 0 | 0 - 20 | 20 - 40 | 40 - 60 | 60 - 80 | 80 - 100 | 100 - > |
| AGG | iShares US Core Bond ETF |
| USO | United States Oil Fund |
| DIA | SPDR Dow Jones Industrial Average ETF |
| DVY | iShares Dow Jones Select Dividend Index ETF |
| DX/Y | NYCE U.S.Dollar Index Spot |
| EFA | iShares MSCI EAFE ETF |
| FXE | Invesco CurrencyShares Euro Trust |
| GLD | SPDR Gold Trust |
| GSG | iShares S&P GSCI Commodity-Indexed Trust |
| HYG | iShares iBoxx $ High Yield Corporate Bond ETF |
| ICF | iShares Cohen & Steers Realty ETF |
| IEF | iShares Barclays 7-10 Yr. Tres. Bond ETF |
| LQD | iShares iBoxx $ Investment Grade Corp. Bond ETF |
| IJH | iShares S&P 400 MidCap Index Fund |
| ONEQ | Fidelity Nasdaq Composite Index Track |
| QQQ | Invesco QQQ Trust |
| RSP | Invesco S&P 500 Equal Weight ETF |
| IWM | iShares Russell 2000 Index ETF |
| SHY | iShares Barclays 1-3 Year Tres. Bond ETF |
| IJR | iShares S&P 600 SmallCap Index Fund |
| SPY | SPDR S&P 500 Index ETF Trust |
| TLT | iShares Barclays 20+ Year Treasury Bond ETF |
| GCC | WisdomTree Continuous Commodity Index Fund |
| VOOG | Vanguard S&P 500 Growth ETF |
| VOOV | Vanguard S&P 500 Value ETF |
| EEM | iShares MSCI Emerging Markets ETF |
| XLG | Invesco S&P 500 Top 50 ETF |
| Symbol | Company | Sector | Current Price | Action Price | Target | Stop | Notes |
|---|---|---|---|---|---|---|---|
| GPK | Graphic Packaging Intl. | Forest Prods/Paper | $25.82 | 21 - 23 | 26 | 18 | 5 for 5'er, #2 of 15 in favored FORE sector matrix, LT pos mkt RS, triple top, 1.3% yield |
| V | Visa Inc. | Finance | $223.44 | 210s - 220s | 262 | 188 | 5 for 5'er top third of FIN sector matrix, LT pos mkt RS, spread quintuple top |
| MRK | Merck & Co., Inc. | Drugs | $108.66 | mid 100s - low 110s | 137 | 89 | 4 for 5'er top third of DRUG sector matrix, multiple consec buys, pullback from ATH, 2.7% yield |
| BJRI | BJ's Restaurants Inc. | Restaurants | $31.68 | low 30s | 55 | 26 | 3 for 5'er, top third of favored REST sector matrix, triple top, pullback from 52-week high, R-R>3.5 |
| FI | Fiserv, Inc. | Computers | $120.00 | mid 100s - mid 110s | 123 | 91 | 5 for 5'er, top 25% of COMP sector matrix, LT pos mkt RS, pullback from 52-week high |
| TXRH | Texas Roadhouse, Inc. | Restaurants | $111.00 | 100s | 125 | 90 | 5 TA rating, top half REST sector matrix, consec. buy signals, LT RS buy, 2.10% yield |
| UBS | UBS AG (Switzerland) ADR | Banks | $20.49 | 18 - 22 | 38.50 | 16 | 5 for 5'er, #5 of 126 in BANK sector matrix, bullish triangle, R-R>4.0, 2.75% yield |
| BRK.B | Berkshire Hathaway Inc | Insurance | $335.90 | mid 300s - low 330s | 396 | 280 | 5 TA rating, top third of INSU sector matrix, LT pos. trend, LT RS buy, buy-on-pullback |
| ON | On Semiconductor Corp. | Semiconductors | $92.74 | hi 70s - mid 80s | 110 | 66 | 5 for 5'er, top 25% of favored SEMI sector matrix, LT pos mkt RS, spread quintuple top, R-R>2.0 |
| CLX | The Clorox Company | Household Goods | $153.94 | 160s | 194 | 136 | 5 for 5'er, 7th of 26 in HOUS sector matrix, RS buy signal, triple top, 2.8% yield |
| AER | AerCap Holdings NV | Aerospace Airline | $60.66 | hi 50s - low 60s | 72 | 49 | 5 for 5'er, top half of AERO, sector matrix, triple top breakout |
| CBRE | CBRE Group, Inc. | Real Estate | $78.39 | 72 - low 80s | 91 | 66 | 4 TA rating, top half of REAL sector matrix, recent pos. trend, LT RS buy |
| BIIB | Biogen Inc. | Biomedics/Genetics | $299.99 | 290s - 300s | 400 | 248 | 4 for 5'er, 43 of 125 in favored BIOM sector matrix, quad top breakout, pullback from MY high |
| DRI | Darden Restaurants, Inc. | Restaurants | $167.64 | mid 150s - mid 160s | 192 | 130 | 5 TA rating, pos. trend, LT RS buy, pos. weekly mom., recent price normalization, Earn. 6/22 |
| CMCSA | Comcast Corporation | Media | $40.84 | hi 30s - low 40s | 50 | 33 | 4 for 5'er, top third of MEDI sector matrix, multiple consec buy signal, pullback to middle of trading band, 2.94% yield |
| SAIA | Saia, Inc. | Transports/Non Air | $313.35 | 290s - 300s | 380 | 264 | 5 for 5'er, top 10% of favored TRAN sector matrix, LT pos mkt RS, bearish signal reversal, pos trend change, R-R>2.0 |
| GE | General Electric Company | Electronics | $104.70 | hi 90s - hi 100s | -- | 86 | 5 for 5'er, #4 of 67 in ELEC sector matrix, LT pos mkt RS, triple top breakout |
| SKX | Skechers U.S.A, Inc. | Textiles/Apparel | $53.08 | lo-mid 50s | 67 | 41 | 5 TA rating, #2 of 23 names in TEXT sector matrix, pos. trend, RS buy, price normalization |
| SHOP | Shopify Inc | Internet | $65.88 | hi 50s - low 60s | 81 | 51 | 5 for 5'er, #1 of 52 in INET sector matrix, bullish signal reversal, R-R>2.0 |
| CRM | Salesforce Inc. | Software | $209.40 | hi 190s - 220 | 258 | 168 | 4 TA rating, top 20% of SOFT sector matrix, consec. buy signals, buy-on-pullback |
| AXP | American Express Company | Finance | $174.47 | mid 160s - mid 170s | 222 | 146 | 4 for 5'er, 14th of 72 in FINA sector matrix, pos trend flip, spread triple top, pos wkly mom flip, R-R>2.0 |
| IPG | The Interpublic Group of Companies, Inc. | Media | $40.14 | hi 30s - low 40s | 66 | 32 | 5 for 5'er, #1 of 30 in MEDI sector matrix, spread quad top, R-R>3.0, 3.1% yield |
| TTWO | Take-Two Interactive Software, Inc. | Software | $136.63 | 130s | 182 | 108 | 4 for 5'er, top third of favored SOFT sector matrix, one box from peer RS buy signal |
| RS | Reliance Steel & Aluminum Co | Steel/Iron | $254.85 | mid 240s - low 260s | 320 | 204 | 5 for 5'er, #4 of 18 in favored STEE sector matrix, LT pos peer & mkt RS, triple top breakout, 1.6% yield |
| VVV | Valvoline Inc | Autos and Parts | $37.00 | mid - hi 30s | 53 | 30 | 5 TA rating, top third in the AUTO sector RS matrix, consec. buy signals, buy-on-pullback, R-R > 2 |
| Symbol | Company | Sector | Current Price | Action Price | Target | Stop | Notes |
|---|---|---|---|---|---|---|---|
| LAUR | Laureate Education Inc | Business Products | $11.66 | (11.50-12.50) | 6 | 13.50 | 0 for 5'er, LT negative trend & market RS, spread triple bottom, OBOS>100%, R-R>3.0 |
| Comment | |||||||
|---|---|---|---|---|---|---|---|
|
|
|||||||
VVV Valvoline Inc R ($36.90) - Autos and Parts - VVV has a strong 5 for 5 TA rating and sits in the top third of the favored autos and parts sector RS matrix. The stock pushed higher in May to break a second consecutive buy signal before reaching a new all-time high at $39. The movement over the past few weeks has seen VVV pull back from that extended position to currently sit closer to the middle of its trading band near $37, offering a more opportune entry point. The long-term technical picture remains overwhelmingly positive. Exposure may be considered in the mid-to-high $30s. Our initial stop will be positioned at $30, which would take out all support built up this year. The bullish price objective of $53 will serve as our price target, offering a reward-to-risk ratio north of 2.00.
| 16 | 17 | 18 | 19 | 20 | 21 | 22 | 23 | ||||||||||||||||||||||||||||||||||||||||||
| 39.00 | X | 39.00 | |||||||||||||||||||||||||||||||||||||||||||||||
| 38.00 | X | 38.00 | |||||||||||||||||||||||||||||||||||||||||||||||
| 37.00 | X | C | 3 | X | 37.00 | ||||||||||||||||||||||||||||||||||||||||||||
| 36.00 | B | O | X | O | X | X | O | 5 | Mid | 36.00 | |||||||||||||||||||||||||||||||||||||||
| 35.00 | X | O | X | O | X | O | X | O | X | 35.00 | |||||||||||||||||||||||||||||||||||||||
| 34.00 | 6 | X | O | 1 | X | O | X | 1 | O | X | 34.00 | ||||||||||||||||||||||||||||||||||||||
| 33.00 | X | O | A | O | X | O | 8 | X | O | X | O | 33.00 | |||||||||||||||||||||||||||||||||||||
| 32.00 | 5 | O | X | O | X | X | 6 | X | O | X | O | X | Bot | 32.00 | |||||||||||||||||||||||||||||||||||
| 31.00 | X | 7 | X | 2 | X | O | X | O | 7 | O | X | C | 31.00 | ||||||||||||||||||||||||||||||||||||
| 30.00 | X | O | 3 | X | O | X | O | X | O | B | 30.00 | ||||||||||||||||||||||||||||||||||||||
| 29.00 | X | O | 5 | X | O | X | O | X | 29.00 | ||||||||||||||||||||||||||||||||||||||||
| 28.00 | X | O | X | O | 9 | X | 28.00 | ||||||||||||||||||||||||||||||||||||||||||
| 27.00 | 4 | O | O | X | • | 27.00 | |||||||||||||||||||||||||||||||||||||||||||
| 26.00 | • | 3 | O | X | • | 26.00 | |||||||||||||||||||||||||||||||||||||||||||
| 25.00 | • | B | • | X | A | • | 25.00 | ||||||||||||||||||||||||||||||||||||||||||
| 24.00 | 9 | • | X | A | O | • | • | • | 1 | • | 24.00 | ||||||||||||||||||||||||||||||||||||||
| 23.00 | X | O | • | 1 | O | X | O | • | 2 | • | X | • | X | • | 23.00 | ||||||||||||||||||||||||||||||||||
| 22.00 | X | O | • | C | O | X | 3 | X | O | • | X | O | • | 8 | X | • | 22.00 | ||||||||||||||||||||||||||||||||
| 21.00 | A | X | 9 | 4 | X | X | O | • | 8 | O | • | X | X | O | B | • | 21.00 | ||||||||||||||||||||||||||||||||
| 20.00 | O | X | X | 5 | X | O | 1 | O | 7 | 2 | • | 6 | O | X | 7 | O | X | • | 20.00 | ||||||||||||||||||||||||||||||
| 19.50 | B | X | O | X | • | A | X | O | X | O | X | X | O | • | X | O | X | O | X | 9 | X | • | 19.50 | ||||||||||||||||||||||||||
| 19.00 | O | X | O | X | • | B | X | C | X | O | X | O | X | 3 | • | X | O | X | O | X | O | X | • | 19.00 | |||||||||||||||||||||||||
| 18.50 | O | O | • | O | X | O | • | O | X | O | 6 | O | • | • | X | O | X | O | A | • | 18.50 | ||||||||||||||||||||||||||||
| 18.00 | • | O | X | • | O | 3 | X | O | X | • | X | O | • | 18.00 | |||||||||||||||||||||||||||||||||||
| 17.50 | O | • | 5 | X | O | X | O | X | • | 17.50 | |||||||||||||||||||||||||||||||||||||||
| 17.00 | • | O | • | O | X | O | X | • | 17.00 | ||||||||||||||||||||||||||||||||||||||||
| 16.50 | • | O | X | 5 | X | • | 16.50 | ||||||||||||||||||||||||||||||||||||||||||
| 16.00 | O | X | O | X | • | 16.00 | |||||||||||||||||||||||||||||||||||||||||||
| 15.50 | O | X | O | X | • | 15.50 | |||||||||||||||||||||||||||||||||||||||||||
| 15.00 | O | X | O | • | 15.00 | ||||||||||||||||||||||||||||||||||||||||||||
| 14.50 | O | X | X | X | • | 14.50 | |||||||||||||||||||||||||||||||||||||||||||
| 14.00 | O | X | O | X | O | X | • | 14.00 | |||||||||||||||||||||||||||||||||||||||||
| 13.50 | O | X | O | X | O | X | • | 13.50 | |||||||||||||||||||||||||||||||||||||||||
| 13.00 | O | X | O | X | O | • | 13.00 | ||||||||||||||||||||||||||||||||||||||||||
| 12.50 | O | X | O | X | • | 12.50 | |||||||||||||||||||||||||||||||||||||||||||
| 12.00 | O | X | 4 | X | • | 12.00 | |||||||||||||||||||||||||||||||||||||||||||
| 11.50 | O | X | X | O | • | 11.50 | |||||||||||||||||||||||||||||||||||||||||||
| 11.00 | O | X | O | X | • | 11.00 | |||||||||||||||||||||||||||||||||||||||||||
| 10.50 | O | X | O | X | • | 10.50 | |||||||||||||||||||||||||||||||||||||||||||
| 10.00 | O | O | X | • | 10.00 | ||||||||||||||||||||||||||||||||||||||||||||
| 9.50 | O | • | 9.50 | ||||||||||||||||||||||||||||||||||||||||||||||
| 16 | 17 | 18 | 19 | 20 | 21 | 22 | 23 |

| AMT American Tower REIT ($194.27) - Real Estate - AMT broke a double top at $194 on Thursday, reentered a positive trend, and now sits on a nice pair of buy signals. However, the stock remains a 2 for 5'er at this time which means we will need to see more evidence of upside follow through before lifting our sell recommendation. Things to watch would be a flip on the relative strength chart against its peer group and/or against the market (SPXEWI). |
| BMWYY Bayerische Motoren Werke (BMW) AG ADR ($41.08) - Autos and Parts - BMWYY broke a double top at $41 for a third buy signal and a 52-week high. The stock is a 5 for 5'er that has maintained a positive trend since January and positive near-term RS since November last year. Support lies at $36 and $33. |
| CF CF Industries Holdings, Inc. ($70.08) - Chemicals - CF industries gave a second consecutive buy signal on Thursday, completing a bullish catapult at $70. Despite the positive chart action, the outlook for CF remains negative as it is a 2 for 5'er and ranks 43rd out of 47 names in the chemicals sector matrix. From here, the next level of resistance is CF's bearish resistance line at $74. |
| FTNT Fortinet Inc. ($73.59) - Software - FTNT moved higher Thursday to break a triple top at $72 before reaching $73 intraday. This 5 for 5'er moved to a positive trend in January and sits in the top quartile of the favored software sector RS matrix. Weekly momentum also recently flipped positive, suggesting the potential for further upside from here. The weight of the technical evidence is favorable and continues to strengthen. Initial support may be seen at $67 with further support at $65. |
| LEN Lennar Corporation ($118.88) - Building - LEN broke a double top at $118 for a seventh consecutive buy signal as the stock rallied to $120, a new high. LEN is a 4 for 5'e that ranks in the top third of the Building sector matrix and is accompanied by a yield of roughly 1.3%. The stock remains actionable here on the breakout. Support lies at $106 and $98. |
| MAR Marriott International, Inc. ($174.52) - Leisure - MAR reversed into Os and broke a double bottom at $174 to initiate a shakeout pattern. This comes after the 4 for 5'er reached resistance at $182 for a third time, forming a double top in the process. The action point for the shakeout pattern occurs upon the reversal back into Xs at $180 and the pattern would be complete with a move to $184, which would also be a 52-week high. Support lies at $172, the bullish support line, and in the $164 to $166 range. |
| META Meta Platform Inc. ($281.83) - Internet - META continued to chug higher today, posting a now 6 consecutive buy signals since March. However, like many of the other names within the tech-focused realm, META is in heavily overbought territory and those looking to initiate a position may look to dollar cost average into this perfect 5/5'er. Support is seen below at $260. |
| RPM RPM, Inc. ($84.97) - Chemicals - RPM gave a second consecutive buy signal Thursday when it broke a double top at $85. The overall technical picture remains negative, however, as RPM is a 1 for 5'er and ranks in the bottom half of the chemicals sector matrix. From here, the next test for the stock is its bearish resistance line, which currently sits at $88. |
| Name | Option Symbol | Action | Stop Loss |
|---|---|---|---|
| Visa Inc. - $226.55 | V2315I215 | Buy the September 225.00 calls at 11.10 | 200.00 |
| Name | Option | Action |
|---|---|---|
| AFLAC Incorporated ( AFL) | Aug. 65.00 Calls | Raise the option stop loss to 3.70 (CP: 5.70) |
| Walmart Inc. ( WMT) | Sep. 145.00 Calls | Raise the option stop loss to 13.35 (CP: 15.35) |
| Stryker Corporation ( SYK) | Sep. 280.00 Calls | Raise the option stop loss to 21.70 (CP: 23.70) |
| Name | Option Symbol | Action | Stop Loss |
|---|---|---|---|
| General Dynamics Corporation - $215.11 | GD2317W210 | Buy the November 210.00 puts at 7.90 | 236.00 |
| Name | Option | Action |
|---|---|---|
| Newmont Corp (NEM) | Sep. 45.00 Puts | Stopped at 3.85 (CP: 3.80) |
| Name | Option Sym. | Call to Sell | Call Price | Investment for 500 Shares | Annual Called Rtn. | Annual Static Rtn. | Downside Protection |
|---|---|---|---|---|---|---|---|
| Take-Two Interactive Software, Inc. $136.63 | TTWO2315I140 | Sep. 140.00 | 7.35 | $65,763.90 | 21.41% | 17.80% | 4.29% |
| Name | Action |
|---|---|
| On Semiconductor Corp. (ON) - 92.74 | Sell the September 90.00 Calls. |
| Apollo Global Management Inc. (APO) - 76.15 | Sell the September 72.50 Calls. |
| Carnival Corporation (CCL) - 15.60 | Sell the September 14.00 Calls. |
| CrowdStrike Holdings, Inc. Class A (CRWD) - 153.96 | Sell the October 155.00 Calls. |
| Capital One Financial Corporation (COF) - 112.33 | Sell the September 115.00 Calls. |
| Dell Technologies Inc Class C (DELL) - 49.38 | Sell the October 50.00 Calls. |
| Tapestry Inc. (TPR) - 43.66 | Sell the November 45.00 Calls. |
| EQT Corporation (EQT) - 38.45 | Sell the September 41.00 Calls. |
| Nucor Corporation (NUE) - 150.64 | Sell the October 160.00 Calls. |
| Name | Covered Write |
|---|---|
|
|
|
Daily Equity & Market Analysis
Loading, Please Wait...
