Stocks continued further into overbought territory on Wednesday and Thursday despite a hawkish pause from the Fed.
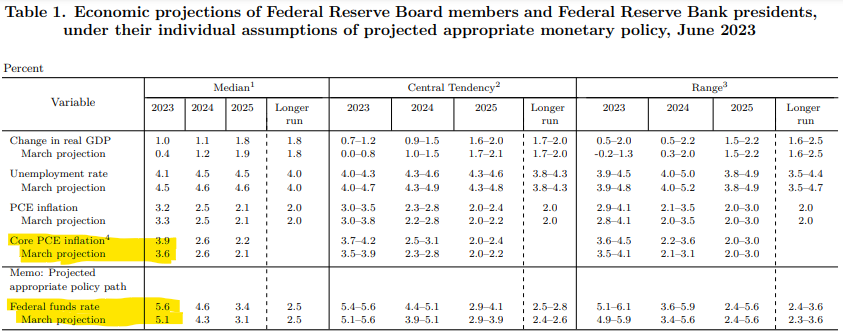
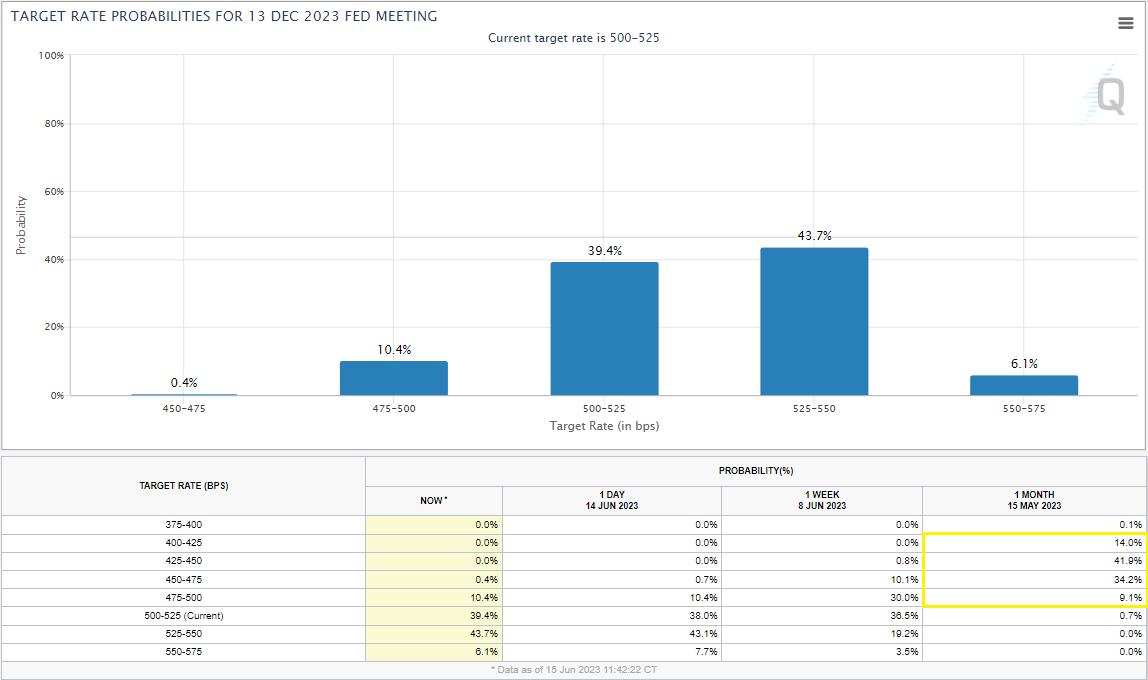
The Fed wrapped up its June meeting on Wednesday, leaving the target for the Fed funds rate unchanged at 500 – 525 bps, as had been widely expected. On the surface, the pause or skip in rate hikes could seem like a dovish pivot from the Fed, however, the rate decision belied a pronounced hawkishness in the summary of economic projections. The economic projections showed FOMC member’s median projection for core PCE this year, the fed’s preferred gauge of inflation, rose to 3.9%, up from 3.6% in March, while the median projection for the fed funds rate in 2023, climbed to 5.6%, up from 5.1%. The upgraded projection for the fed funds rate indicates that FOMC members see two additional 25 basis point increases from the current target of 500 – 525 bps before the end of the year. The Fed futures market shifted following the meeting and is no longer pricing in a rate cut by the end of the year; a month ago, the market was pricing in nearly a 100% probability of at least one 25 bps cut by the end of the year, with a 75% chance of at least 50 bps of cuts.
The market seems to have digested the shift in expectations well, at least initially, the S&P 500 (SPX) closed at a fresh 52-week high on Wednesday and continued higher on Thursday, printing Xs at 4400 and 4420 on its default chart. Meanwhile, after rising initially, the 10-year US Treasury yield finished down on Wednesday and was lower again on Thursday, lifting bond prices.
The continued rally in US equities following the Fed meeting has pushed the major US indices even further into heavily overbought territory. SPX reached a weekly overbought/oversold (OBOS) reading north of 114% intraday on Thursday, its highest reading since January 2020 and the first time it has crossed the 110% level since August 2020. Meanwhile, the Nasdaq 100 (NDX) which has led the push higher, hit an intraday OBOS of 157%, which is higher than any weekly closing value in the data, which goes back to 1992. In January 1999, NDX reached an OBOS reading of 142.61%, the highest weekly closing value on record. It is certainly possible that NDX has reached more overbought levels on an intraday or intraweek basis, but it is clear the index is currently extended to near historic levels.
With the major indexes currently at historically overbought levels, one of the glaring questions is how much further can this rally go? Of course, we all know that the last time the S&P 500 was 115% overbought, in January 2020, it experienced precipitous drop a within a few weeks. However, given the events surrounding that collapse, it would be a stretch to conclude it was a reaction to the overbought state of the market. The last time SPX was more than 110% overbought, at the end of August 2020, the index pulled back roughly 4.5% over the next 30 days before ultimately resuming its rally and reaching a new all-time high in October. In January 2000, NDX reached 2000 and north of 140% overbought, the index pulled back to 1840 but ultimately reached 2100 before the end of the month.
Looking at these three examples, it may seem like a pullback is imminent. Keep in mind, however, we are looking at prior peaks in the OBOS, which all but necessitates that the market pulled back or consolidated shortly thereafter – if it had continued higher for another week or two, the OBOS would likely have continued higher as well. On February 28, 2020, the S&P reached -126% oversold, it's lowest reading since 2008 when it reached -148%, but the index dropped another 22% before bottoming on March 20 and reaching 184% oversold. The point is that the OBOS can tell us that a move is overdone, but not that it can't extend further and sometimes substantially.
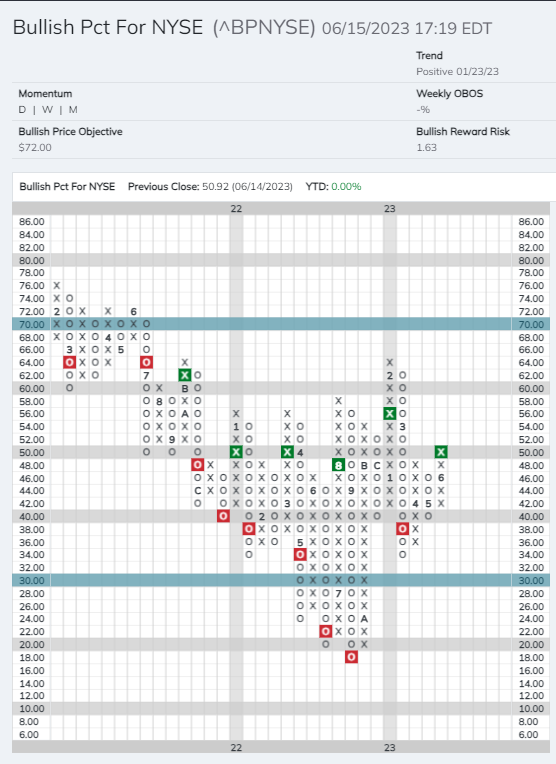
As mentioned above, SPX reached 4420 on Thursday, surpassing its bullish price objective of 4400. Meanwhile, the Nasdaq-100 closed at 15,225, a little more than 1% away from the 15400 bullish price objective on its default chart. Another data point suggesting that the current rally may be getting long in the tooth. However, as mentioned in Wednesday’s report most of the bullish percent charts remain in the middle field position. The Bullish Percent for the NYSE (^BPNYSE) and Bullish Percent for the S&P 500 (^BPSPX) sit in Xs and 50% and 58%, respectively. Even the Bullish Percent for the Nasdaq-100 (^BPNDX) has yet to cross the 70% level, it currently sits in Xs at 66%. The field position of the BPs suggests there is room for breadth to increase, potentially allowing less-extended areas of the market to support a continued push higher.