Most Requested Symbols

This week, commodities moved up to overtake cash for second place in the DALI asset class rankings. One contributor to the increase in the strength of commodities has been energy prices – crude oil has gained more than 19% since hitting a 52-week low in March. Also contributing to the strength of commodities is a recent resurgence in precious metals. Since the beginning of March, gold ([GC/]) has gained more than 9%, while silver ([SI]) is up over 21%; and silver now ranks fourth (out of 21 assets) in the continuous commodity matrix.
The average distribution level is 15.93%.
Today's featured stock is The Trade Desk Inc (TTD).
Comments include: EXR, TDG, VRSN.
Call: Darden Restaurants (DRI); Put: Apache Corporation (APA); Covered Write: Phillips 66 (PSX)
NDW Morning Update Video - April 14, 2023
NDW Morning Update Video – April 14, 2023.
Click here to download MP3
Beginners Series Webinar: Join us on Friday, April 14th at 2 PM (ET) for our NDW Beginners Series Webinar. This week's topic is: How to Utilize Participation Indicators Register Here
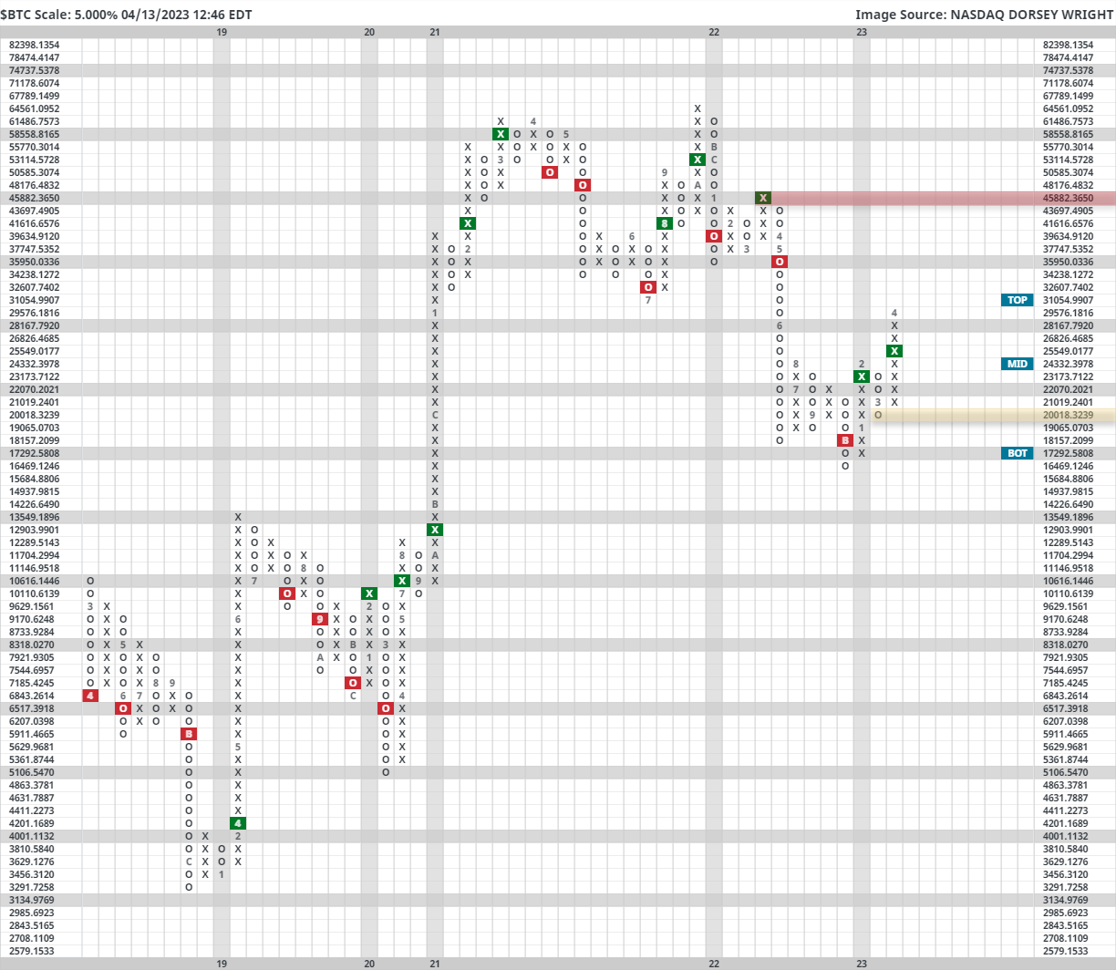
Bitcoin hasn’t earned a starting role in a Daily Equity Report in quite some time, but it certainly isn’t for lack of try. After spending the majority of 2022 in the doghouse, Bitcoin (amongst the rest of the crypto cohort) has had a productive 2023, up over 80% since January 1st. This positive performance has led to a series of productive technical developments, including $BTC re-entering a positive trend and posting its first buy signal against MNYMKT for the first time since late 2021. A previous cryptocurrency piece linked Here provided returns following historical RS buy signals in favor of the crypto king, with an impressive near 90% hit rate on positive future 1-year returns after posting such a signal. All things considered, the path of least resistance appears higher for the coin, and with its recent breach of $30,000 for the first time since falling through it last May, Bitcoin has certainly earned a second glance from the average investor.
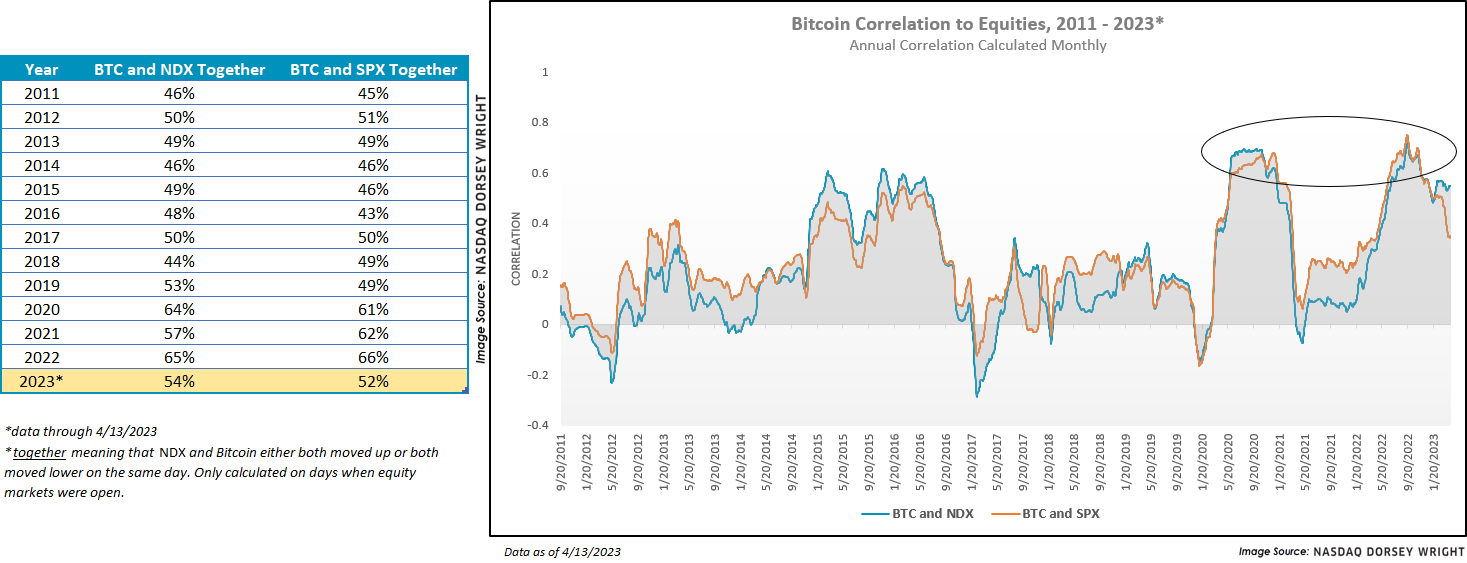
With the understanding that Bitcoin’s volatility isn’t suitable for every client, it can often be fruitful to observe how the equity markets and $BTC are interacting with one another. The chart on the left is simply measuring the percentage of days that Bitcoin and NDX/SPX move in tandem. In other words, what percent of trading days (excluding weekends) do Bitcoin and more traditional domestic equity indices rise or fall on the same day? While 2023’s partial data does show a downtick in the percentage over last year, there has been a distinct rise in the observed percentage over the last 12 years; with 2022’s numbers eclipsing 65% of mirrored movement for the first time in recorded history. The chart on the right shows a slightly more traditional rolling 12-month correlation coefficient. A similar picture here is shown: While the last few months have notched a now noticeable downtick in the price return correlation between [$BTC ] and SPX/NDX, there is certainly a point to make about where such correlation stands today in comparison to a decade ago. Another interesting point seems to emerge when you consider the two points at which price correlation was its highest: at market extremes. Both 2020 and 2022 saw spikes in correlation, but as we all well know… ended up in very two different places by the end of the year.
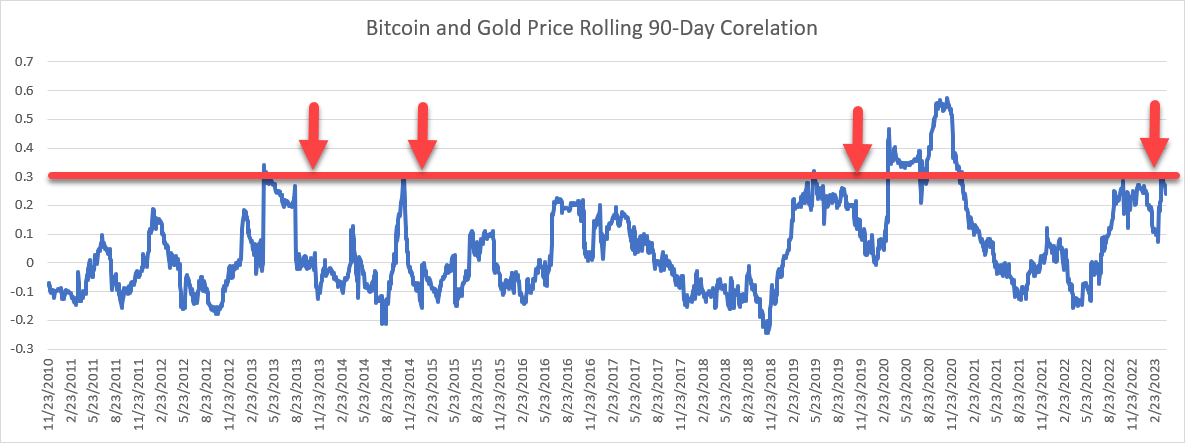
One final part of today’s report is an interesting relationship between Bitcoin as a “virtual” gold and the physical commodity gold. As we know, (GC/) has had a productive year, up over 10%. This has led the broad Commodity group into second place within the broad asset class rankings. Precious metals remain in the first position of all 134 groups on the asset class group scores page suggesting continued strength from the area. While today’s report isn’t a deep dive into the technical strength of GC/, it is worth noting the price return correlation between $BTC and GC/ is at a seemingly key level. While certainly not statistically significant, the correlation between the pair seems to top out at .30 from a historical perspective. From there, the correlation has seen a sharp drop off. While the most recent challenge of .30 in 2020 was followed by a breakthrough of the threshold, it seems like it is a breaking point for one reason or the other.
All things considered, continue to watch how Bitcoin’s price is moving going forward. While it may not be a mainstay in a traditional portfolio, price action suggests it may move more like our traditional equity markets than one may think.

This week, commodities moved up to overtake cash for second place in the DALI asset class rankings. One contributor to the increase in the strength of commodities has been energy prices – crude oil has gained more than 19% since hitting a 52-week low in March. Also contributing to the strength of commodities is a recent resurgence in precious metals. Since the beginning of March, gold (GC/) has gained more than 9%, while silver (SI) is up over 21%; and silver now ranks fourth (out of 21 assets) in the continuous commodity matrix.
One factor helping to drive the strength in precious metals is that bond yields, both real and nominal, have dropped significantly since the beginning of March as investors reassessed the likelihood of additional rate hikes and flocked to the relative safety of Treasuries in the face of regional bank failures last month. Declining real yields make bonds less attractive and make other stores of wealth, especially those with values that tend to increase with inflation, more attractive. Of course, the reverse is also true, when real yields increase, it makes bonds more attractive relative to assets that don’t produce any income. As you can see in the charts below, there is an easily discernable inverse relationship between precious metals prices and real yields.

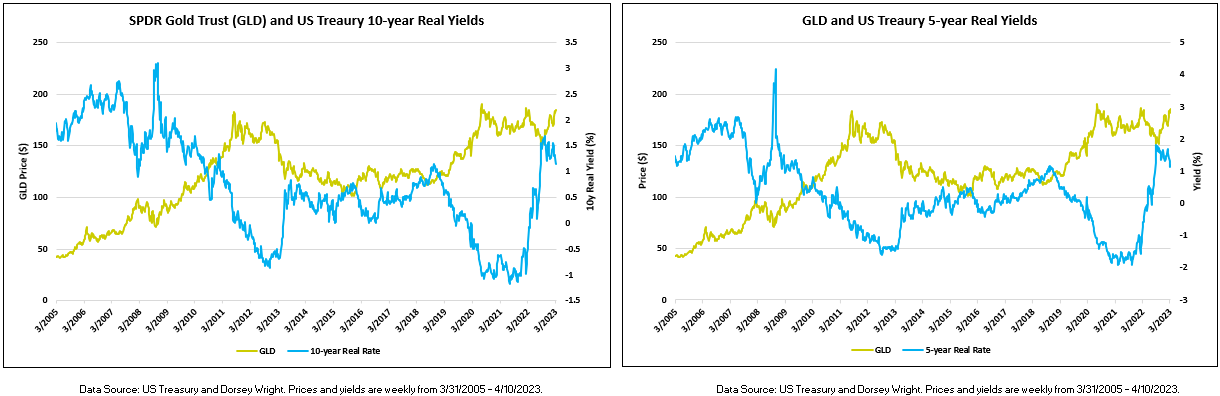

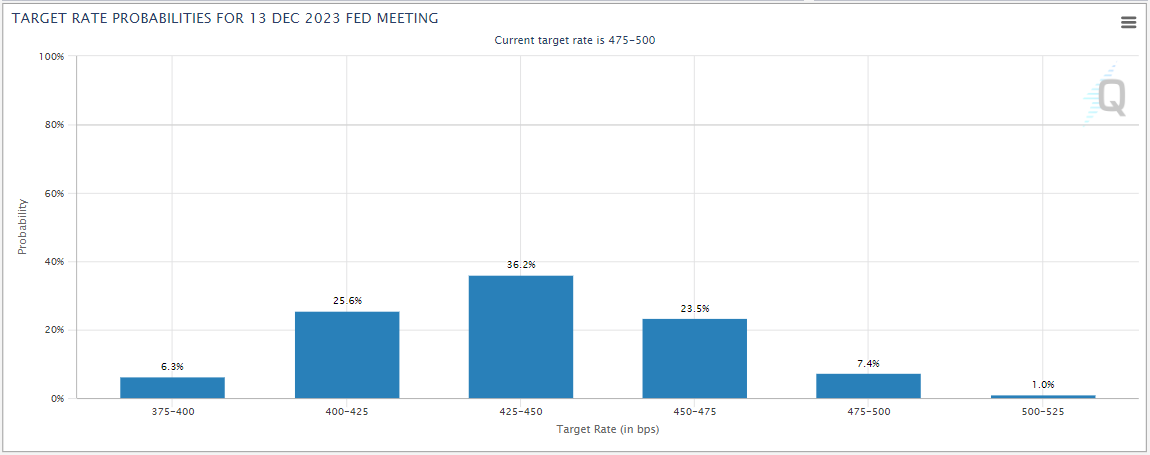
There is evidence to suggest that the current trend in Treasury yields is to the downside. Both the five- (FVX) and 10-year (TNX) US Treasury yield indexes are on sell signals and in negative trends on their default charts. Meanwhile, the Fed futures market is pricing in a better than 80% chance that the Fed will cut rates by at least 25 basis points from the current target of 475 – 500 bps. Of course, TNX, FVX, and the fed funds rate are nominal rates, so a significant drop in inflation, could result in higher real yields even if these nominal yields decline. However, all else being equal, if the trend in yields continues and the market’s prediction for rate cuts later this year is accurate, it could act as a continued tailwind for precious metals. For those interested in adding exposure to precious metals, the most readily accessible way to do so may be through an ETF like the iShares Silver Trust (SLV) or the SPDR Gold Trust (GLD).
The iShares Silver Trust (SLV) currently has a strong 5.67 fund score and a positive 4.58 score direction. On its default chart, SLV returned to a buy signal last week when it broke a triple top at $23, taking out resistance that had been in place since January. However, while it shows a decidedly strong technical picture, SLV now sits in heavily overbought territory with a weekly overbought/oversold (OBOS) reading north of 100%. So those interested in adding exposure to the fund may be best served to do so on a pullback or to wait for prices to normalize near current levels. On its default chart, SLV shows no support until $18.50, more than 25% below its current level. However, on its $0.125-per-box chart, the fund has recently found support at $22.63 and $21, so investors looking to add exposure on a pullback could potentially target one of these levels.
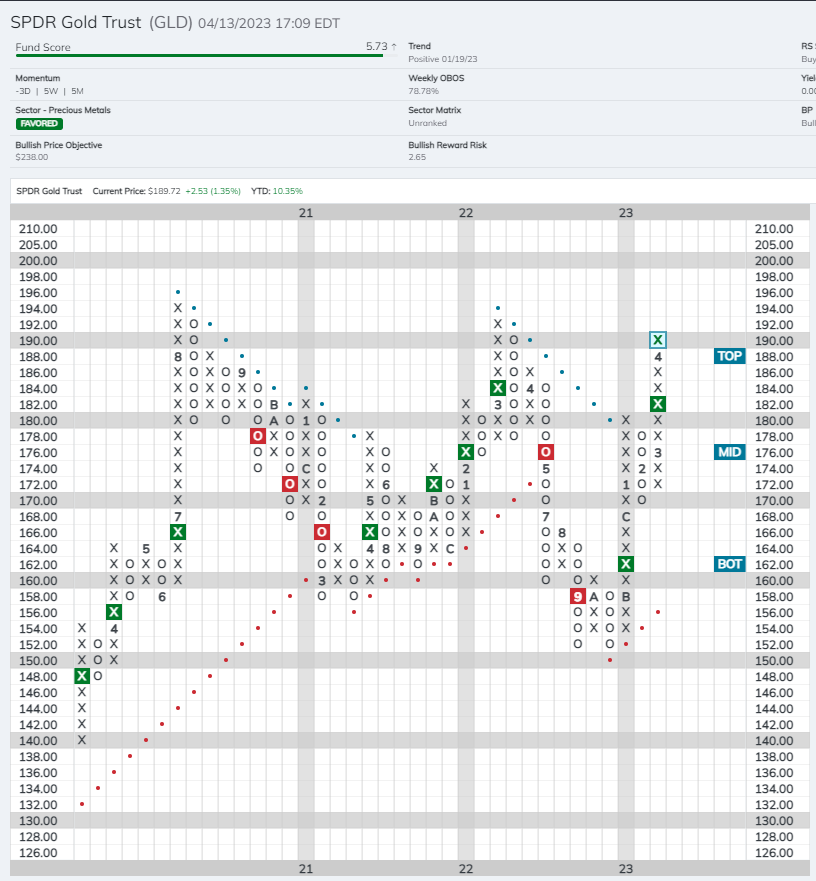
The SPDR Gold Trust (GLD) shows a similarly strong 5.73 fund score and 3.71 score direction. GLD has completed two consecutive buy signals, most recently breaking a double top at $182 in mid-March. The fund currently sits at $190, and it also sits in heavily overbought territory with a weekly OBOS reading just under 80%. On its default chart, the first level of support sits at $170; however, on its $1-per-box-chart, GLD has recently found multiple levels of support between $180 and $185.
For those considering adding positions in GLD or SLV it is worth noting that both funds hold physical metal, as opposed to exposure gained through futures contracts. Due to this structure, gains on positions are taxed as collectibles – the same as if you owned silver or gold bullion – which is generally higher than the rate on other investments. One upside of this structure, is that owning these funds will not generate a K-1, as is the case with most commodities funds that gain their exposure via futures contracts.
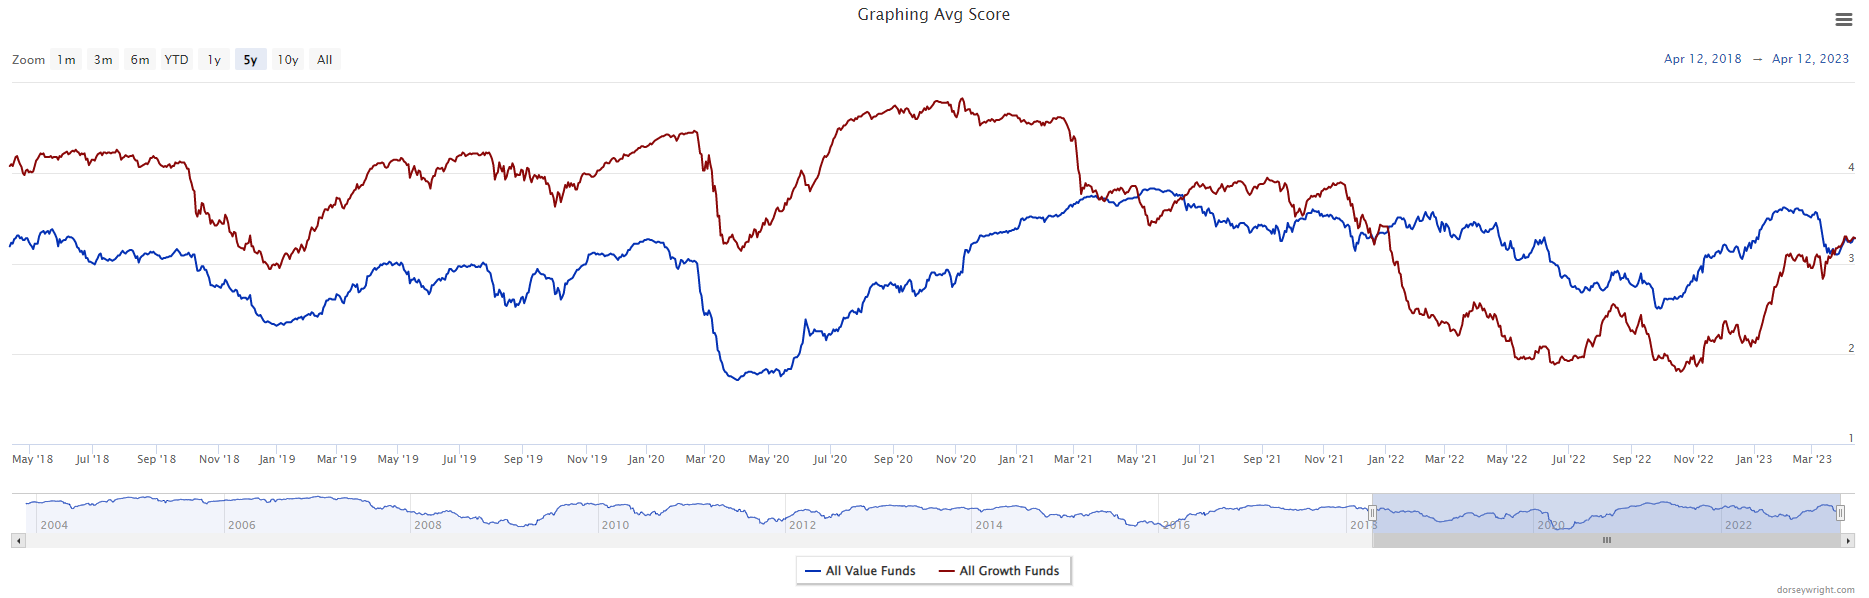
One of the best uses of the Asset Class Group Scores page is to keep track of key groups and their relationships with one another. There are plenty of relationships worth keeping an eye on, but there will be two focused on today. The first is the All Value Funds vs All Growth Funds group. This relationship has been featured before and was extremely beneficial in the rotation away from growth funds last year. With the growth-led rally to start the year, the two groups have been nearly tied in score for the last three weeks. Score crosses have been notable in the past and often lasted for at least a few months to even a few years. In the short term, the All Growth Funds group has exhibited higher absolute strength which is evident from its score direction of 1.50 compared to the All Value Funds group’s score direction of 0.23. However, this is not enough to put the growth representative in favorable long-term standing against value. For the time being, either option would be viewed as reasonable given they share the same average score. Right now, there is a good mix of value and growth sectors with average scores above 3.0 which speaks to the lack of outright leadership from either value or growth.
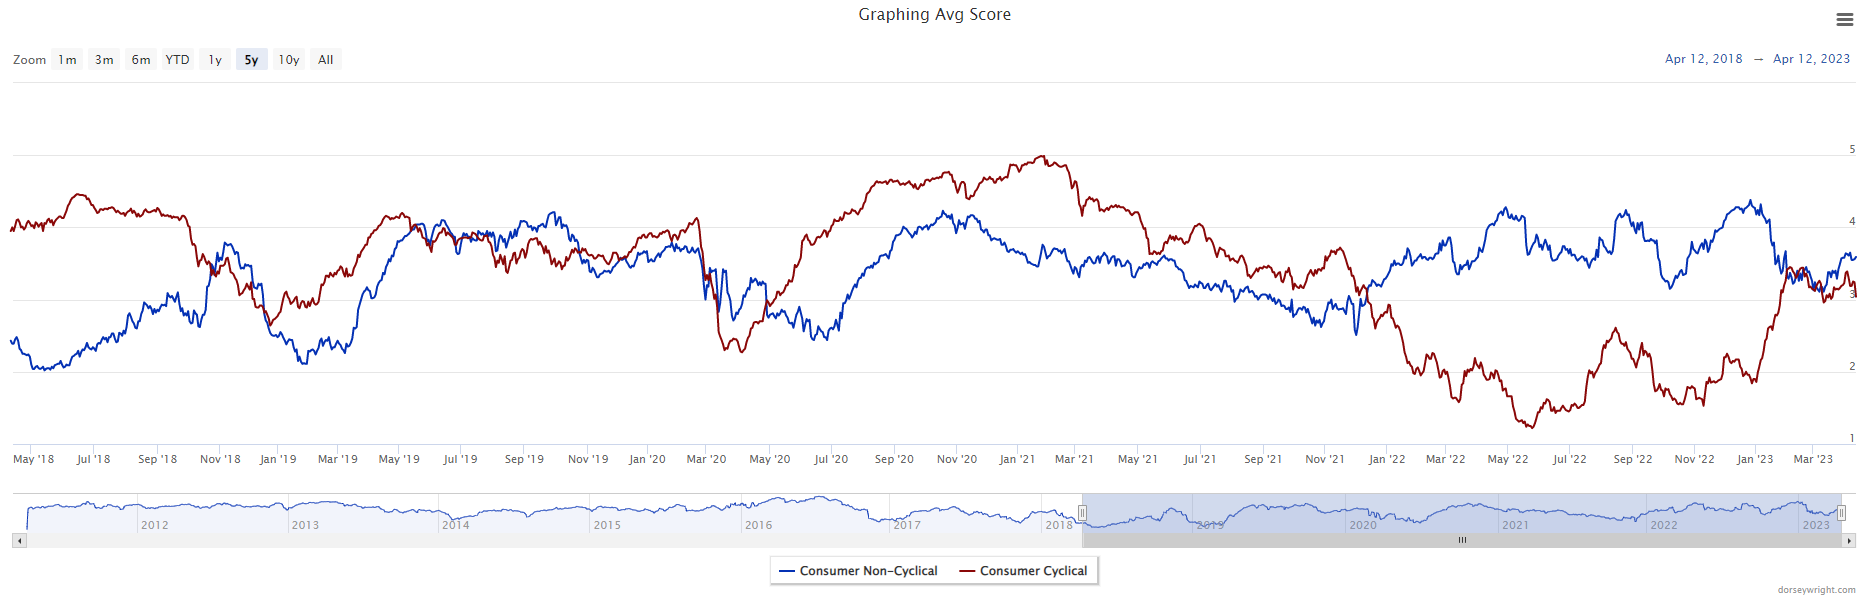
A second key relationship to watch is between Consumer Non-Cyclical and Consumer Cyclical groups. This has been a great relationship to watch as it gives insights into the risk appetite in the broad market. When Consumer Non-Cyclical holds the lead, it is often associated with poor broad market conditions (for more click here). Like the All Value Funds vs All Growth Funds relationship, Consumer Non-Cyclical and Consumer Cyclical’s scores had converged earlier this year with neither group able to take leadership over the other. This changed at the beginning of April. Consumer Non-Cyclical has pulled away and now has an over 0.50-point score lead. This is also coupled with Consumer Cyclicals in danger of scoring below 3.0 which it spent all of 2022 below. The recent divergence between the two groups may also indicate the future winner of the growth and value tie.
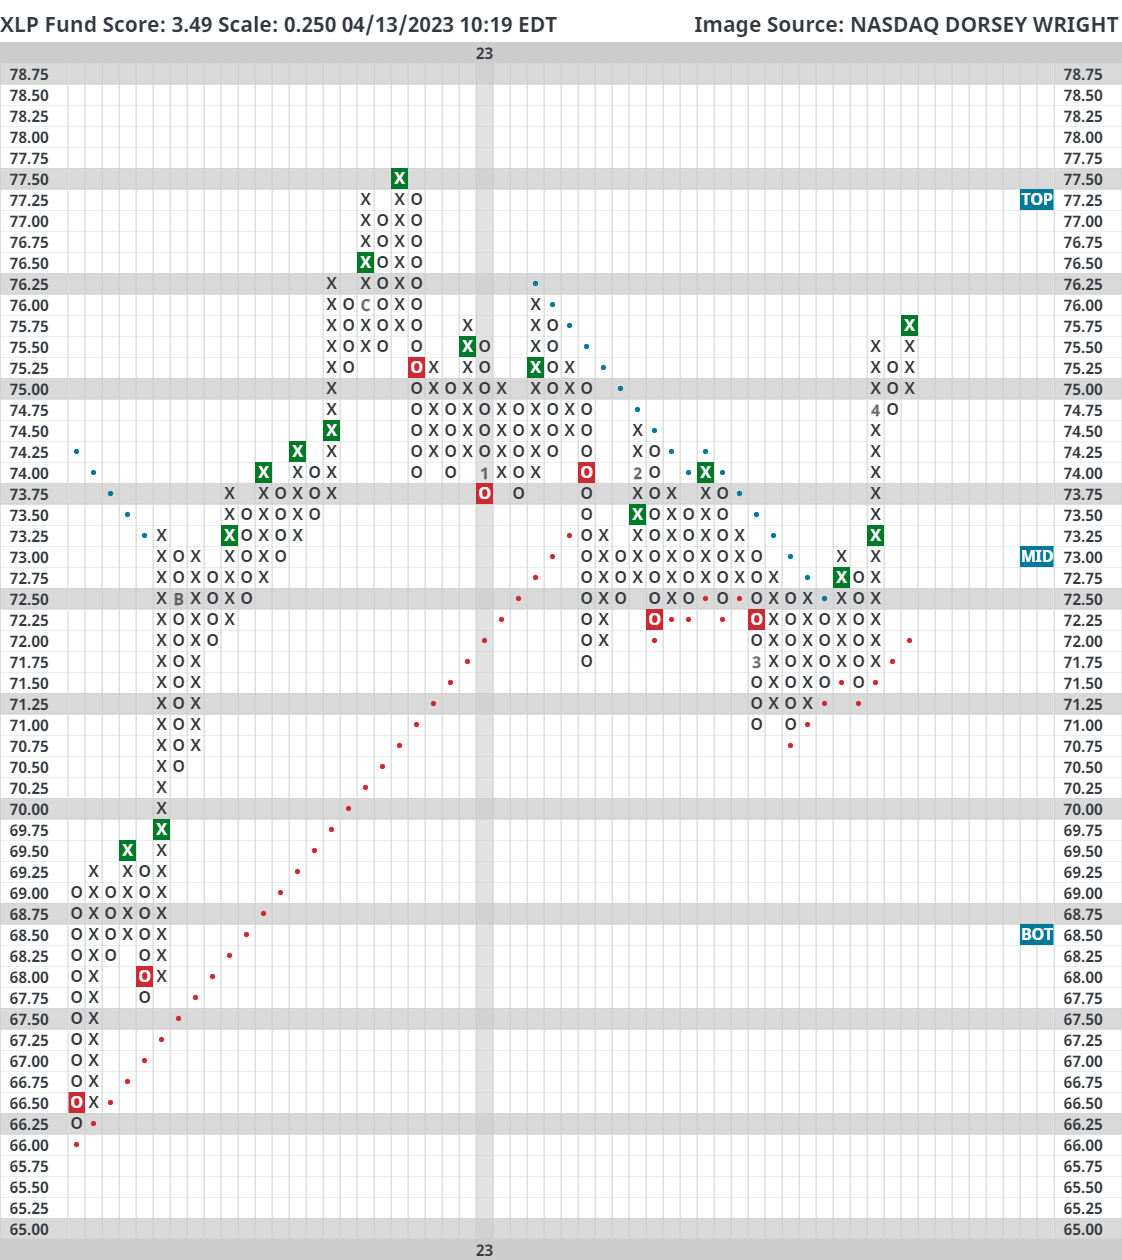
Looking at the 0.25-point chart for the Consumer Staples Select Sector SPDR Fund (XLP), it’s clear to see the recent improvement after the technical deterioration experienced in the first few months of the year. XLP was able to return to a positive trend on this chart and is now trading on three consecutive buy signals. The fund has an acceptable fund score of 3.49 and a positive score direction of 1.47 which highlights the fund’s improvement. XLP offers a yield of 2.48% and has an rRisk of 0.79, so it could be a lower volatility equity income option as well as a sector play. From its current level, support is offered at $74.75 with further support at $71.50.

Average Level
15.93
| < - -100 | -100 - -80 | -80 - -60 | -60 - -40 | -40 - -20 | -20 - 0 | 0 - 20 | 20 - 40 | 40 - 60 | 60 - 80 | 80 - 100 | 100 - > |
|---|---|---|---|---|---|---|---|---|---|---|---|
|
Buy signaldia
|
|||||||||||
|
Buy signalqqq
|
|||||||||||
|
Sell signalTLT
|
|||||||||||
|
Buy signallqd
|
|||||||||||
|
Buy signalvoog
|
|||||||||||
|
Sell signalicf
|
Sell signaleem
|
Sell signalgcc
|
Buy signalefa
|
||||||||
|
Sell signalRSP
|
Buy signalhyg
|
Buy signalagg
|
Buy signalief
|
||||||||
|
Sell signaldx/y
|
Sell signaliwm
|
Sell signaldvy
|
Buy signaloneq
|
Buy signalxlg
|
Buy signalshy
|
Buy signalfxe
|
|||||
|
Buy signalijr
|
Sell signalijh
|
Buy signalVOOV
|
Buy signalspy
|
Sell signalgsg
|
Buy signalUSO
|
Buy signalGLD
|
|||||
| < - -100 | -100 - -80 | -80 - -60 | -60 - -40 | -40 - -20 | -20 - 0 | 0 - 20 | 20 - 40 | 40 - 60 | 60 - 80 | 80 - 100 | 100 - > |
| AGG | iShares US Core Bond ETF |
| USO | United States Oil Fund |
| DIA | SPDR Dow Jones Industrial Average ETF |
| DVY | iShares Dow Jones Select Dividend Index ETF |
| DX/Y | NYCE U.S.Dollar Index Spot |
| EFA | iShares MSCI EAFE ETF |
| FXE | Invesco CurrencyShares Euro Trust |
| GLD | SPDR Gold Trust |
| GSG | iShares S&P GSCI Commodity-Indexed Trust |
| HYG | iShares iBoxx $ High Yield Corporate Bond ETF |
| ICF | iShares Cohen & Steers Realty ETF |
| IEF | iShares Barclays 7-10 Yr. Tres. Bond ETF |
| LQD | iShares iBoxx $ Investment Grade Corp. Bond ETF |
| IJH | iShares S&P 400 MidCap Index Fund |
| ONEQ | Fidelity Nasdaq Composite Index Track |
| QQQ | Invesco QQQ Trust |
| RSP | Invesco S&P 500 Equal Weight ETF |
| IWM | iShares Russell 2000 Index ETF |
| SHY | iShares Barclays 1-3 Year Tres. Bond ETF |
| IJR | iShares S&P 600 SmallCap Index Fund |
| SPY | SPDR S&P 500 Index ETF Trust |
| TLT | iShares Barclays 20+ Year Treasury Bond ETF |
| GCC | WisdomTree Continuous Commodity Index Fund |
| VOOG | Vanguard S&P 500 Growth ETF |
| VOOV | Vanguard S&P 500 Value ETF |
| EEM | iShares MSCI Emerging Markets ETF |
| XLG | Invesco S&P 500 Top 50 ETF |
| Symbol | Company | Sector | Current Price | Action Price | Target | Stop | Notes |
|---|---|---|---|---|---|---|---|
| GPK | Graphic Packaging Intl. | Forest Prods/Paper | $24.84 | 21 - 23 | 26 | 18 | 5 for 5'er, #2 of 15 in favored FORE sector matrix, LT pos mkt RS, triple top, 1.3% yield, Earn. 4/25 |
| PGR | The Progressive Corporation | Insurance | $148.15 | low 120s - low 130s | 168 | 106 | 4 for 5'er, top quartile of favored INSU sector matrix, one box from mkt RS buy, spread triple top, Earn. 5/1 |
| COHU | Cohu, Inc. | Semiconductors | $35.98 | mid 30s | 51 | 29 | 4 for 5'er. top 10% of SEMI sector matrix, big base breakout, R-R>2.5, Earn. 4/26 |
| TSCO | Tractor Supply Company | Retailing | $232.64 | mid 210s - high 230s | 298 | 186 | 5 TA rating, LT market RS buy, recent peer RS buy, top half RETA sector matrix, Earn. 4/19 |
| V | Visa Inc. | Finance | $227.81 | 210s - 220s | 262 | 188 | 5 for 5'er top third of FIN sector matrix, LT pos mkt RS, spread quintuple top, Earn. 4/24 |
| AVGO | Broadcom Ltd | Semiconductors | $616.70 | mid 560s - lo 620s | 696 | 496 | 5 TA rating, top half SEMI sector matrix, fifth consec. buy signal, bullish triangle, LT mkt RS buy |
| ITW | Illinois Tool Works Inc. | Machinery and Tools | $232.35 | 220s - 240s | - | 194 | 3 for 5'er, favored MACH sector, LT pos mkt RS, multiple consec buy signals, pullback from ATH, 2.2% yield, Earn. 5/1 |
| MRK | Merck & Co., Inc. | Drugs | $113.75 | mid 100s - low 110s | 137 | 89 | 4 for 5'er top third of DRUG sector matrix, multiple consec buys, pullback from ATH, 2.7% yield, Earn. 4/27 |
| YUMC | Yum China Holdings Inc | Restaurants | $63.43 | hi 50s - mid 60s | 86 | 50 | 4 TA rating, top quintile of favored Restaurants sector RS matrix, consec. buy signals, R-R > 2.5, Earn. 5/2 |
| BJRI | BJ's Restaurants Inc. | Restaurants | $27.90 | low 30s | 55 | 26 | 4 for 5'er, top third of favored REST sector matrix, triple top, pullback from 52-week high, R-R>3.5, Earn. 4/19 |
| ADI | Analog Devices, Inc. | Semiconductors | $187.29 | lo 180s - lo 190s | 266 | 158 | 4 TA rating, top third SEMI sector RS matrix, LT RS buy, R-R near 3 |
| FISV | Fiserv, Inc. | Computers | $114.49 | mid 100s - mid 110s | 123 | 91 | 5 for 5'er, top 25% of COMP sector matrix, LT pos mkt RS, pullback from 52-week high, Earn. 4/25 |
| TXRH | Texas Roadhouse, Inc. | Restaurants | $111.04 | 100s | 125 | 90 | 5 TA rating, top half REST sector matrix, consec. buy signals, LT RS buy, 2.10% yield, Earn. 5/3 |
| GOLF | Acushnet Holdings Corp | Leisure | $50.71 | hi 40s - low 50s | 73 | 42 | 5 for 5'er, top third of LEIS sector matrix, quintuple top breakout, pullback from MY high, R-R~3.0, 1.56% yield, Earn. 5/3 |
| AAPL | Apple Inc. | Computers | $160.10 | mid 150s - low 160s | 192 | 138 | 5 for 5'er, top half of COMP sector matrix, LT pos mkt RS, peer & mkt RS column reversals, spread quintuple top, Earn. 4/26 |
| FND | Floor & Decor Holdings Inc | Retailing | $96.41 | hi 80s - hi 90s | 115 | 78 | 5 TA rating, top quintile of RETA sector matrix, LT RS buy, recent peer RS buy, Earn. 5/3 |
| CDNS | Cadence Design Systems, Inc. | Software | $212.18 | hi 190s - mid 200s | 222 | 180 | 5 for 5'er, top 20% of COMP sector matrix. LT pos peer & mkt RS, spread triple top, Earn. 4/24 |
| SNPS | Synopsys Inc | Software | $376.52 | lo 360s - hi 380s | 440 | 316 | 5 TA rating, top third of SOFT sector matrix, pull back from rally high, LT RS buy |
| CROX | Crocs, Inc. | Textiles/Apparel | $126.19 | mid 120s - low 130s | 160 | 108 | 4 for 5'er, third of 24 in TEXT sector matrix, spread triple top, Earn. 5/3 |
| MNST | Monster Beverage Corp. | Food Beverages/Soap | $52.47 | lo-mid 50s | 71 | 42 | 5 TA rating, LT positive trend, LT RS buy, consec. buy signals, top quartile FOOD sector matrix, pos. wkly mom., Earn. 5/3 |
| ACGL | Arch Capital Group Ltd. | Insurance | $70.23 | mid-to-hi 60s | 77 | 60 | 5 for 5'er, 4th of 69 in INSU sector matrix, LT pos trend and market RS bullish triangle, Earn. 4/26 |
| FOUR | Shift4 Payments, Inc. Class A | Business Products | $71.22 | upper 60s - hi 70s | 97 | 55 | 5 TA rating, top decile of BUSI sector matrix, RS buy, positive trend, buy-on-pullback, Earn. 5/3 |
| NJR | New Jersey Resources Corp | Gas Utilities | $54.90 | low-to-mid 50s | 68 | 47 | 4 for 5'er, #1 for 19 in GUTI sector matrix, triple top, good R-R, 2.85% yield, Earn. 5/3 |
| PD | PagerDuty, Inc. | Internet | $32.50 | lo-mid 30s | 52 | 26 | 5 TA rating, top 10% of INET sector matrix, buy-on-pullback, RS buy, recent pos. wkly mom. |
| CWST | Casella Waste Systems, Inc. | Waste Management | $84.88 | hi 70s - mid 80s | 102 | 70 | 4 for 5'er, favored WAST sector matrix, LT pos peer & mkt RS, spread triple top, Earn. 4/26 |
| TTD | The Trade Desk Inc | Internet | $60.02 | hi 50s - mid 60s | 85 | 50 | 5 TA rating, top quartile of INET sector matrix, pos. trend, RS buy signal, pos. wkly mom., R-R > 2, Earn. 5/8 |
| Symbol | Company | Sector | Current Price | Action Price | Target | Stop | Notes |
|---|---|---|---|---|---|---|---|
| LAUR | Laureate Education Inc | Business Products | $11.57 | (11.50-12.50) | 6 | 13.50 | 0 for 5'er, LT negative trend & market RS, spread triple bottom, OBOS>100%, R-R>3.0 |
| Symbol | Company | Sector | Current Price | Action Price | Target | Stop | Notes |
|---|---|---|---|---|---|---|---|
| MSI | Motorola Solutions Inc. | Telephone | $285.72 | 232 | MSI moved into overbought territory. Existing exposure may raise the stop to 232 | ||
| BRKR | Bruker Corporation | Healthcare | $81.32 | 70 | BRKR moved into overbought territory. Existing exposure may raise the stop to 70 |
| Comment | |||||||
|---|---|---|---|---|---|---|---|
|
|
|||||||
TTD The Trade Desk Inc R ($61.33) - Internet - TTD has a 5 for 5 TA rating and sits in the top quartile of the favored internet sector RS matrix. This stock moved back to a positive trend in January and gave an RS buy signal against the market in February, offering further long-term confirmation of strength. Weekly momentum also recently flipped positive, suggesting the potential for further upside from here. Exposure may be considered in the high $50s to mid-$60s. Our initial stop will be set at $50, which would violate multiple support levels and move the stock into a negative trend. The bullish price objective of $85 will serve as our price target, offering a reward-to-risk ratio north of 2. Note that earnings are expected on 5/8.
| 23 | |||||||||||||||||||||||||||||||||||||||||||||||||||||
| 76.00 | X | X | • | Top | 76.00 | ||||||||||||||||||||||||||||||||||||||||||||||||
| 75.00 | X | O | X | O | • | 75.00 | |||||||||||||||||||||||||||||||||||||||||||||||
| 74.00 | X | O | X | O | • | 74.00 | |||||||||||||||||||||||||||||||||||||||||||||||
| 73.00 | X | O | X | O | • | 73.00 | |||||||||||||||||||||||||||||||||||||||||||||||
| 72.00 | X | O | O | • | 72.00 | ||||||||||||||||||||||||||||||||||||||||||||||||
| 71.00 | X | O | • | 71.00 | |||||||||||||||||||||||||||||||||||||||||||||||||
| 70.00 | X | O | • | 70.00 | |||||||||||||||||||||||||||||||||||||||||||||||||
| 69.00 | X | O | • | 69.00 | |||||||||||||||||||||||||||||||||||||||||||||||||
| 68.00 | X | O | • | 68.00 | |||||||||||||||||||||||||||||||||||||||||||||||||
| 67.00 | X | O | X | • | 67.00 | ||||||||||||||||||||||||||||||||||||||||||||||||
| 66.00 | X | O | X | X | O | • | X | 66.00 | |||||||||||||||||||||||||||||||||||||||||||||
| 65.00 | X | O | X | O | X | X | O | • | • | X | O | 65.00 | |||||||||||||||||||||||||||||||||||||||||
| 64.00 | X | O | X | O | X | O | X | O | X | • | • | X | X | • | X | O | 64.00 | ||||||||||||||||||||||||||||||||||||
| 63.00 | X | O | O | X | O | X | X | O | X | O | X | X | • | X | O | X | O | • | X | O | X | 63.00 | |||||||||||||||||||||||||||||||
| 62.00 | X | O | 9 | X | O | X | O | X | O | X | O | X | O | X | O | X | O | • | X | O | X | X | 62.00 | ||||||||||||||||||||||||||||||
| 61.00 | X | O | X | O | X | O | O | X | O | X | O | X | O | X | O | • | X | O | X | O | X | 61.00 | |||||||||||||||||||||||||||||||
| 60.00 | X | O | X | O | O | X | O | A | • | O | • | O | • | X | O | X | O | X | 60.00 | ||||||||||||||||||||||||||||||||||
| 59.00 | X | O | O | X | • | • | O | • | X | O | X | X | O | X | 59.00 | ||||||||||||||||||||||||||||||||||||||
| 58.00 | X | O | X | • | O | X | X | • | X | X | O | 3 | O | X | 4 | 58.00 | |||||||||||||||||||||||||||||||||||||
| 57.00 | X | X | O | X | • | O | X | O | X | O | • | X | O | X | O | X | O | X | Mid | 57.00 | |||||||||||||||||||||||||||||||||
| 56.00 | X | O | X | • | O | • | O | X | O | X | O | B | • | X | O | X | O | X | O | X | 56.00 | ||||||||||||||||||||||||||||||||
| 55.00 | X | O | X | • | • | O | X | O | X | O | X | O | • | • | X | O | X | O | O | X | 55.00 | ||||||||||||||||||||||||||||||||
| 54.00 | X | O | X | • | O | X | O | X | O | X | O | X | X | • | X | • | X | O | X | O | X | 54.00 | |||||||||||||||||||||||||||||||
| 53.00 | X | O | • | O | X | O | O | O | X | O | C | O | X | O | • | 2 | O | X | O | X | 53.00 | ||||||||||||||||||||||||||||||||
| 52.00 | X | • | O | X | O | X | O | X | O | X | O | • | X | O | X | O | X | • | 52.00 | ||||||||||||||||||||||||||||||||||
| 51.00 | X | • | O | X | O | X | O | X | O | X | O | • | X | O | X | O | • | 51.00 | |||||||||||||||||||||||||||||||||||
| 50.00 | X | • | O | X | O | X | O | X | O | X | O | • | X | O | X | • | 50.00 | ||||||||||||||||||||||||||||||||||||
| 49.00 | X | • | O | O | X | O | X | O | X | O | • | X | O | X | • | 49.00 | |||||||||||||||||||||||||||||||||||||
| 48.00 | X | • | O | X | O | X | O | X | O | X | • | X | O | • | 48.00 | ||||||||||||||||||||||||||||||||||||||
| 47.00 | X | • | O | X | O | O | O | X | X | O | X | • | 47.00 | ||||||||||||||||||||||||||||||||||||||||
| 46.00 | X | • | O | X | O | X | O | 1 | X | O | X | • | 46.00 | ||||||||||||||||||||||||||||||||||||||||
| 45.00 | 8 | • | O | X | O | X | O | X | O | X | O | • | 45.00 | ||||||||||||||||||||||||||||||||||||||||
| 44.00 | X | • | O | X | O | O | X | O | X | • | 44.00 | ||||||||||||||||||||||||||||||||||||||||||
| 43.00 | X | • | O | X | O | O | X | • | 43.00 | ||||||||||||||||||||||||||||||||||||||||||||
| 42.00 | • | O | X | O | • | 42.00 | |||||||||||||||||||||||||||||||||||||||||||||||
| 41.00 | O | X | • | 41.00 | |||||||||||||||||||||||||||||||||||||||||||||||||
| 40.00 | O | 40.00 | |||||||||||||||||||||||||||||||||||||||||||||||||||
| 23 |

| EXR Extra Space Storage Inc. ($158.79) - Real Estate - Shares of EXR reversed down on Thursday after another failed breakout attempt at the bearish resistance line. The stock remains a weak 2 for 5'er. Avoid. Support is offered between $150 and $152. Note earnings are expected on 5/1. |
| TDG TransDigm Group, Inc. ($753.72) - Aerospace Airline - TDG posted a third consecutive buy signal today at $752, establishing an attractive series of higher tops and higher bottoms since mid-march. The trend line has proved to be strong for this perfect 5/5'er. Support is found below at $720, with overhead resistance at $768. |
| VRSN VeriSign, Inc. ($216.87) - Internet - VRSN moved to a buy signal Thursday and broke a double top at $216. This moved the stock back to a positive trend and promoted it to a 4 for 5 TA rating. The weight of the technical evidence is favorable and improving. Initial support can be seen at $190, with further overhead resistance potentially found at $224. |
| Name | Option Symbol | Action | Stop Loss |
|---|---|---|---|
| Darden Restaurants, Inc. - $153.19 | DRI2321G155 | Buy the July 155.00 calls at 7.30 | 140.00 |
| Name | Option | Action |
|---|---|---|
| Merck & Co., Inc. ( MRK) | Jun. 105.00 Calls | Raise the option stop loss to 10.40 (CP: 12.40) |
| Hologic Incorporated ( HOLX) | Jun. 75.00 Calls | Raise the option stop loss to 9.10 (CP: 11.10) |
| AbbVie Inc. ( ABBV) | Aug. 155.00 Calls | Initiate an option stop loss of 11.45 (CP: 13.45) |
| Mastercard Incorporated Class A ( MA) | Jul. 360.00 Calls | Initiate an option stop loss of 24.20 (CP: 26.20) |
| Parker-Hannifin Corporation ( PH) | Aug. 320.00 Calls | Stopped at 25.00 (CP: 24.30) |
| Name | Option Symbol | Action | Stop Loss |
|---|---|---|---|
| Apache Corporation - $40.55 | APA2321S40 | Buy the July 40.00 puts at 3.50 | 44.00 |
| Name | Option | Action |
|---|---|---|
| Generac Holdings, Inc. (GNRC) | Aug. 110.00 Puts | Stopped at 16.90 (CP: 15.80) |
| Name | Option Sym. | Call to Sell | Call Price | Investment for 500 Shares | Annual Called Rtn. | Annual Static Rtn. | Downside Protection |
|---|---|---|---|---|---|---|---|
| Phillips 66 $106.03 | PSX2318H110 | Apr. 110.00 | 6.40 | $50,351.90 | 23.51% | 15.06% | 4.98% |
| Name | Action |
|---|---|
| Dexcom Inc. (DXCM) - 114.82 | Sell the September 125.00 Calls. |
| Owens Corning Inc. (OC) - 98.04 | Sell the August 100.00 Calls. |
| Occidental Petroleum Corporation (OXY) - 64.84 | Sell the August 70.00 Calls. |
| Valero Energy Corp (VLO) - 133.72 | Sell the September 140.00 Calls. |
| Marathon Petroleum Corp. (MPC) - 130.22 | Sell the July 135.00 Calls. |
| Teck Resources Limited (TECK) - 43.00 | Sell the May 43.00 Calls. |
| On Semiconductor Corp. (ON) - 76.46 | Sell the July 85.00 Calls. |
| Fortinet Inc. (FTNT) - 67.19 | Sell the September 70.00 Calls. |
| Name | Covered Write |
|---|---|
|
|
|
Daily Equity & Market Analysis
Loading, Please Wait...
