One of the best uses of the Asset Class Group Scores page is to keep track of key groups and their relationships with one another.
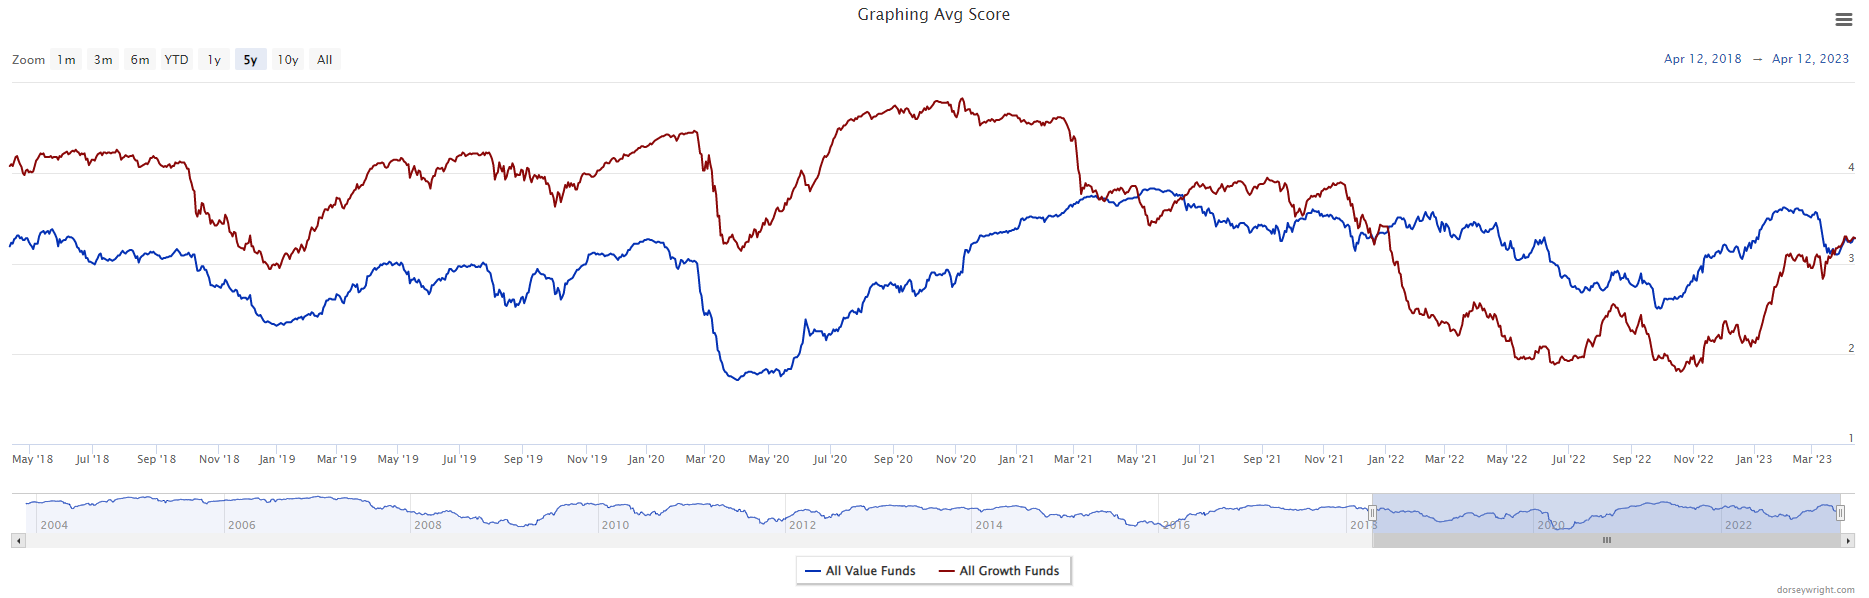
One of the best uses of the Asset Class Group Scores page is to keep track of key groups and their relationships with one another. There are plenty of relationships worth keeping an eye on, but there will be two focused on today. The first is the All Value Funds vs All Growth Funds group. This relationship has been featured before and was extremely beneficial in the rotation away from growth funds last year. With the growth-led rally to start the year, the two groups have been nearly tied in score for the last three weeks. Score crosses have been notable in the past and often lasted for at least a few months to even a few years. In the short term, the All Growth Funds group has exhibited higher absolute strength which is evident from its score direction of 1.50 compared to the All Value Funds group’s score direction of 0.23. However, this is not enough to put the growth representative in favorable long-term standing against value. For the time being, either option would be viewed as reasonable given they share the same average score. Right now, there is a good mix of value and growth sectors with average scores above 3.0 which speaks to the lack of outright leadership from either value or growth.
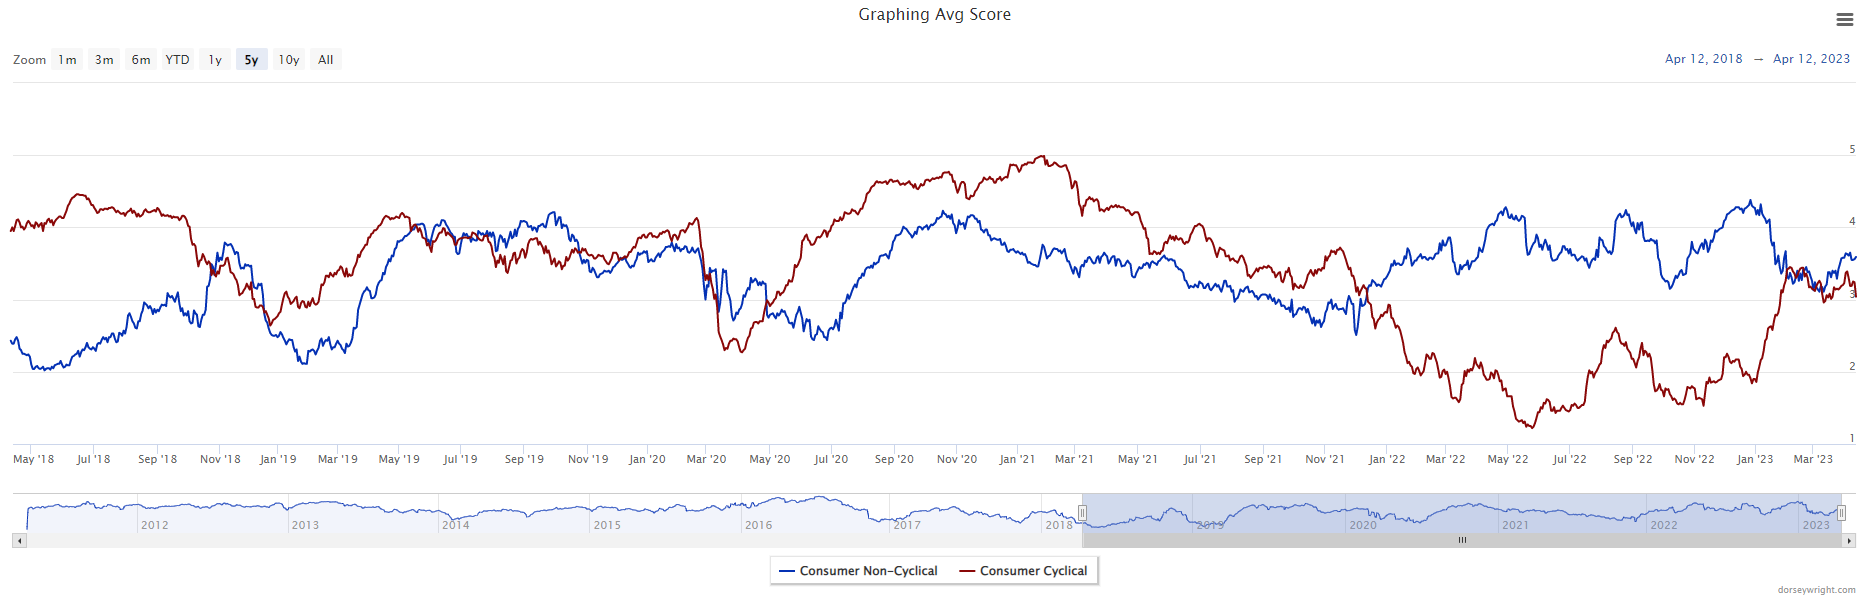
A second key relationship to watch is between Consumer Non-Cyclical and Consumer Cyclical groups. This has been a great relationship to watch as it gives insights into the risk appetite in the broad market. When Consumer Non-Cyclical holds the lead, it is often associated with poor broad market conditions (for more click here). Like the All Value Funds vs All Growth Funds relationship, Consumer Non-Cyclical and Consumer Cyclical’s scores had converged earlier this year with neither group able to take leadership over the other. This changed at the beginning of April. Consumer Non-Cyclical has pulled away and now has an over 0.50-point score lead. This is also coupled with Consumer Cyclicals in danger of scoring below 3.0 which it spent all of 2022 below. The recent divergence between the two groups may also indicate the future winner of the growth and value tie.
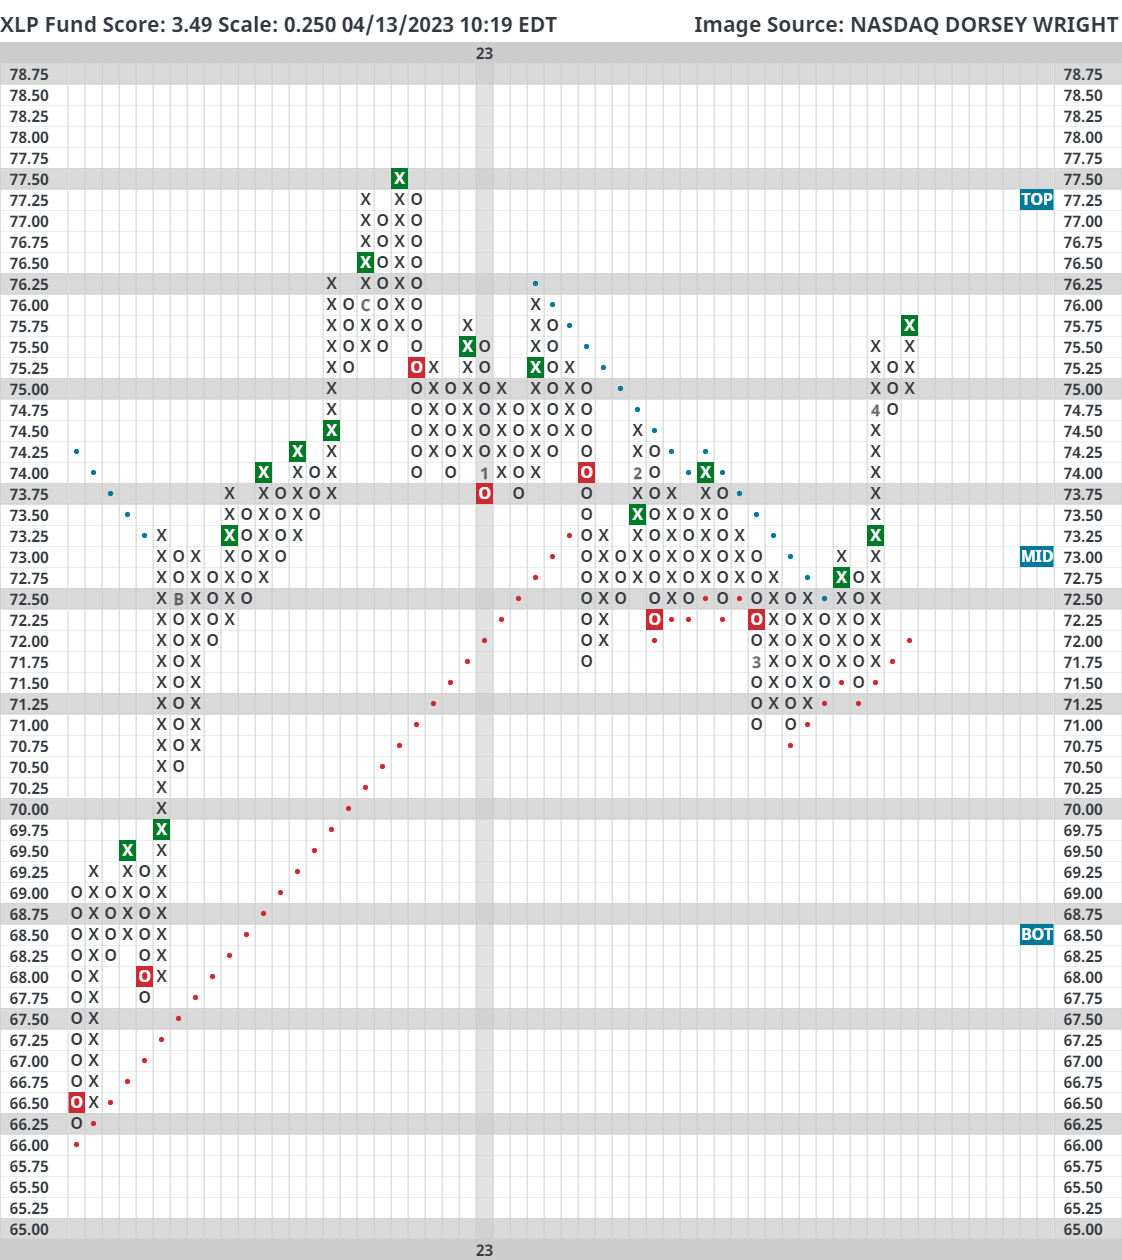
Looking at the 0.25-point chart for the Consumer Staples Select Sector SPDR Fund (XLP), it’s clear to see the recent improvement after the technical deterioration experienced in the first few months of the year. XLP was able to return to a positive trend on this chart and is now trading on three consecutive buy signals. The fund has an acceptable fund score of 3.49 and a positive score direction of 1.47 which highlights the fund’s improvement. XLP offers a yield of 2.48% and has an rRisk of 0.79, so it could be a lower volatility equity income option as well as a sector play. From its current level, support is offered at $74.75 with further support at $71.50.