Most Requested Symbols

The average distribution level is 21.56%.
Today's featured stock is Agree Realty Corporation (ADC).
ALGT, AZO, HD, and NFLX
Call: Walmart Inc. (WMT), Put: Amazon.com Inc. (AMZN), Covered Write: American Airlines Group Inc. (AAL)
NDW Morning Update Video - January 23, 2023
NDW Morning Update Video
Click here to download MP3
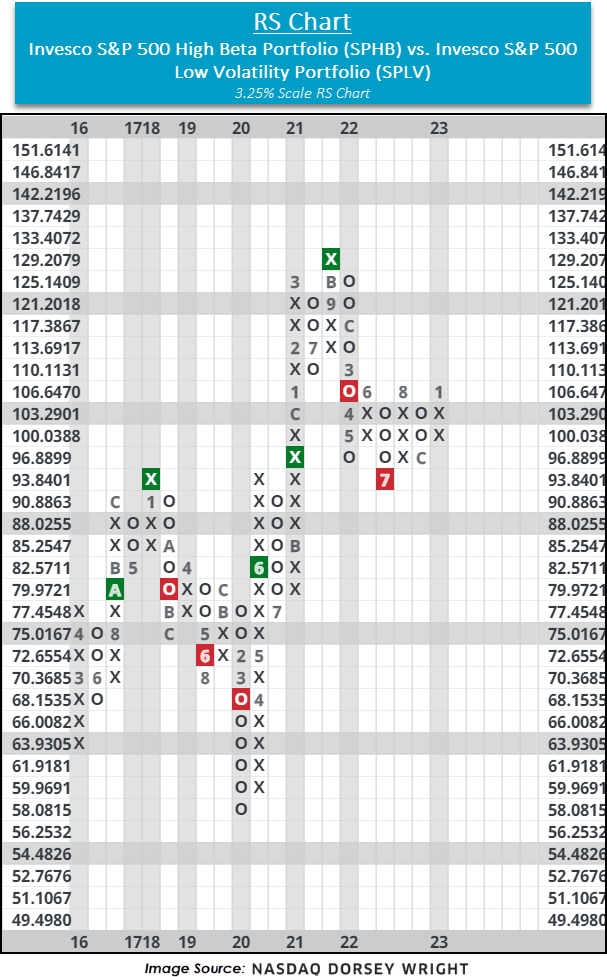
Among numerous recent RS chart changes that have occurred over the past week is that comparing the Invesco S&P 500 High Beta Portfolio SPHB vs. the Invesco S&P 500 Low Volatility Portfolio SPLV on a 3.25% scale chart. With the near-term pop in more risk on sectors and areas of US equities, SPHB has rallied over 7% while SPLB has fallen 2.05% year-to-date. This led the fund to reverse back into Xs and return to a buy signal and shift the trend back to positive by breaking a quadruple top at $70. In addition to the fund score of SPHB moving back above 4 and its highest level since February of last year, the RS chart comparing SPHB to SPLV moved back into Xs, favoring SPHB in the near term. The chart has technically been on an RS sell signal (favoring SPLV in the long-term) since March of last year but is within one box of moving back to an RS buy signal favoring SPHB. Prior to the signal flipping to a sell back in March of last year, SPHB had been favored in the RS relationship since June 2020. With weekly momentum also moving back positive, SPHB has had a couple of notable near-term technical developments. A move back to the RS relationship in favor of SPHB would add further positive evidence to risk-on assets in a form that has not been seen in 11 months.
Announcements:
On Friday evening, two changes will occur on the platform.

The first three weeks of 2023 have been led by the laggards, or in other words, areas of the market that have not performed well over a longer timeframe. Communications (XLC), Consumer Discretionary (XLY), and Real Estate (XLRE) are the best-performing sectors year-to-date (through 1/19), but in 2022 they were the worst three performing sectors – in the same order. XLC was the worst performing, XLY was the second worst performing, and XLRE was the third worst performing. Seasonal tendencies, like tax loss harvesting, could explain some of this behavior but given the sheer degree of participation from these sectors in recent weeks we figured it was worth addressing today. Although, instead of tackling each sector we will focus our attention on Real Estate.
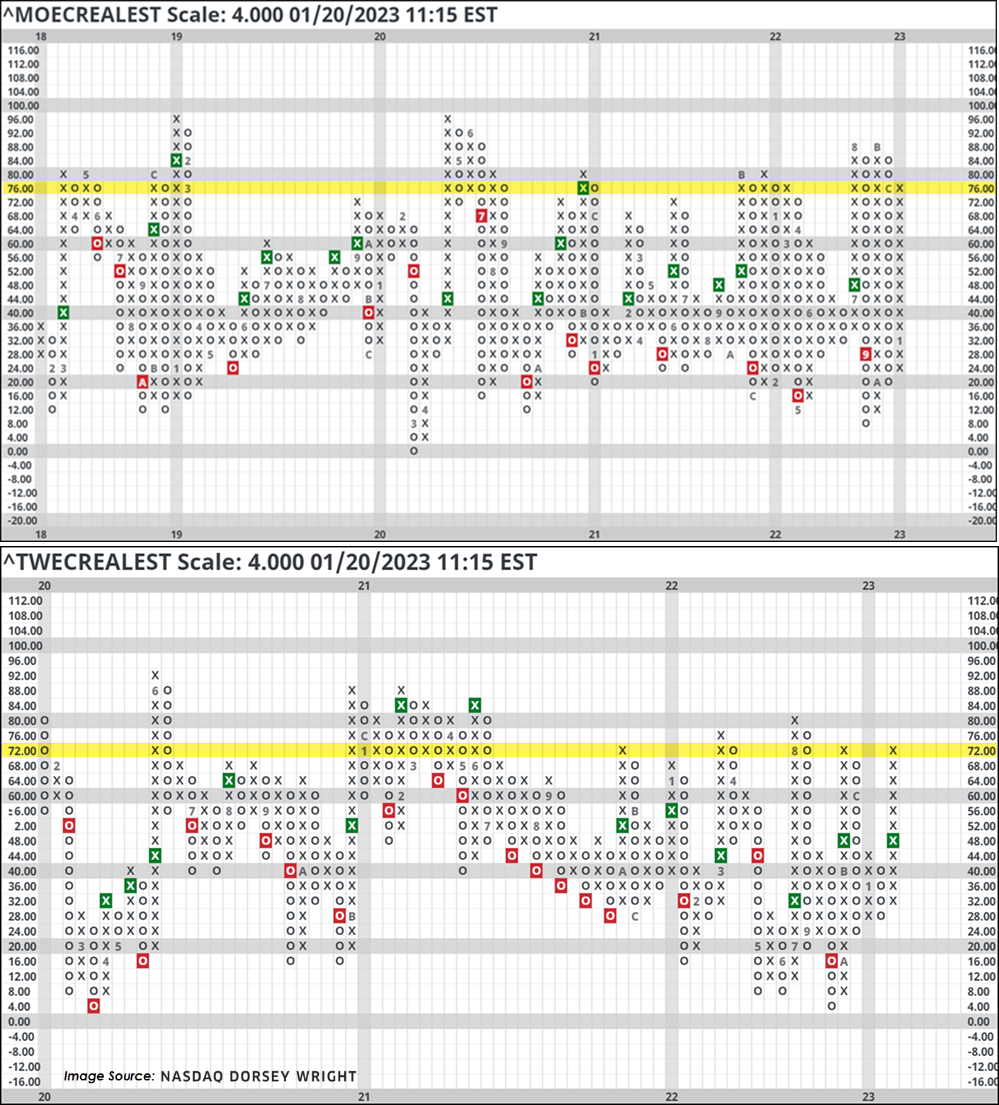
High Participation from a Laggard Sector: The two charts below measure individual stock participation within the Real Estate sector in different ways. The top chart calculates the percent of stocks with positive weekly momentum, a short-term and sensitive reading. As of Thursday (1/19), 78% of Real Estate stocks had positive weekly momentum which tied for third most of all the major 11 sectors. The bottom chart measures the percent of stocks above their ten-week (50-day) moving average. As of Thursday, this read 62%. Note that we used a 4% box size for each of these indicator charts to present a “zoomed-out” view to add a perspective of where this reading has reached in the past several years. In both cases, these readings sit in a high field position.
It is not uncommon to see a high degree of participation from a laggard sector; in fact, most know that during market selloffs it is often the beaten-down stocks that see the sharpest bounces to the upside. Now, distinguishing a laggard rally from a breadth thrust (which is more often associated with a new trend of outperformance) is something less commonly agreed upon. In our case, we look at these participation indicators through the lens of longer-term relative strength rankings like DALI and the Asset Class Group Scores (ACGS) Page, and on each tool, we find Real Estate sitting near the bottom. In fact, the sector ranks second to last on both pages.
Furthermore, the sector not only sits second to last on DALI and the ACGS page, but it has been unable to gain relative strength buy signals or achieve a positive group score direction on the two systems, respectively. So, when pairing the lofty individual stock participation indicators we began our discussion with today against the sustained downtrend/period of relative underperformance for the sector observed in DALI and the ACGS page, it would suggest looking for an exit instead of entry opportunity in the near future.

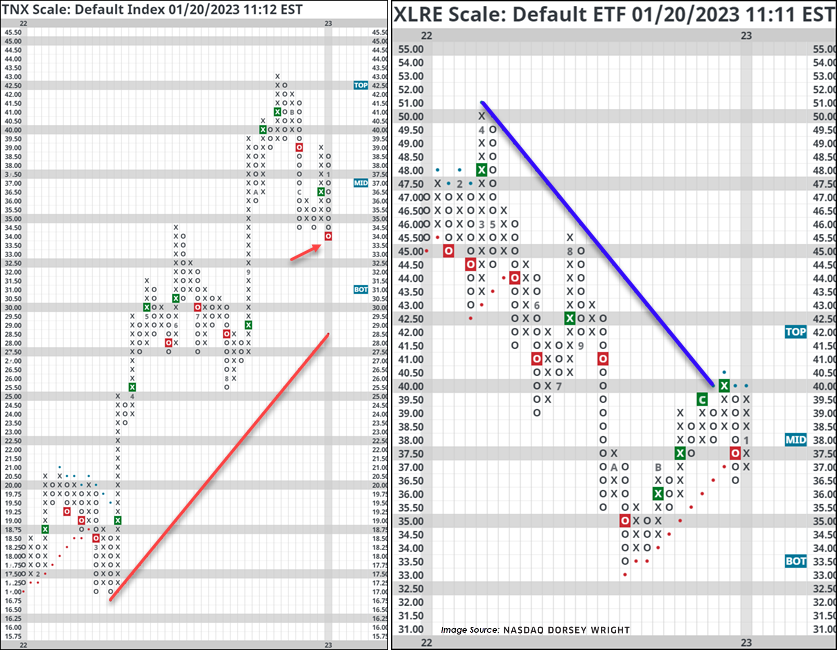
Extended Rate Moves Suggest a Nearing Inflection Point: Admittedly, trend-following strategies (like our own) will struggle at market inflection points – or times when there is a sharp change of leadership on an asset class or sector level. To this point, there are a couple of other things worth considering as it relates to Real Estate that could affect our technical rankings. The first is interest rates; more specifically, the magnitude of the recent decline. In the left-hand chart below, we see the US 10YR Yield Index (TNX) slicing through its last nearby level of support at 3.4%, resulting in a triple bottom sell signal. Following this move, TNX carries a weekly overbought/oversold (OBOS) reading of -55.81% which is the most oversold reading since December 2021. Falling interest rates have typically been a tailwind for the Real Estate sector and quickly rising rates have been a noted headwind. This is summarized well by S&P Global, “All else being equal, higher interest rates tend to decrease the value of properties and increase REIT borrowing costs. In addition, higher interest rates make the relatively high dividend yields generated by REITs less attractive when compared with lower-risk, fixed-income securities, which reduces their appeal to income-seeking investors.”
However, we could see some dislocation from this norm in the near term due to a historically negative correlation between interest rates and Real Estate equities. Not only have Real Estate stocks been historically sensitive to interest rates, but their current sensitivity is at an extreme. The left-hand chart below plots the MSCI US Equity REIT Index’s (RMSG) correlation with the 10YR Treasury Yield. As we can see, the degree of negative correlation is matching the depths of 2013 and 2017 and has rarely gotten more negative in recent history. Mean reversion in this relationship would suggest a more positive correlation with interest rates, or simply less negative; however, that does not necessarily imply a direction. A move towards a more positive correlation could mean that interest rates rise alongside Real Estate stocks, or interest rates fall alongside Real Estate stocks.
In the near term, the oversold condition of rates coupled with the elevated potential for correlation reversion could suggest a sell on rally opportunity on the horizon for Real Estate stocks. Or, as first acknowledged in this section, a change of trend after the initial snapback is realized. However, until the sector can meaningfully gain ground on our DALI tool or Group Score rankings, we will be looking for opportunities to trim positions.

| Symbol | Name | Price | Yield | PnF Trend | RS Signal | RS Col. | Fund Score | 200 Day MA | Weekly Mom |
|---|---|---|---|---|---|---|---|---|---|
| DIA | SPDR Dow Jones Industrial Average ETF Trust | 330.63 | 1.91 | Positive | Sell | O | 2.82 | 323.90 | -6W |
| EEM | iShares MSCI Emerging Markets ETF | 41.10 | 2.49 | Positive | Sell | X | 3.30 | 39.31 | +2W |
| EFA | iShares MSCI EAFE ETF | 70.39 | 2.68 | Positive | Sell | X | 4.38 | 64.54 | +1W |
| FM | iShares MSCI Frontier and Select EM ETF | 26.73 | 2.75 | Positive | Sell | O | 2.13 | 27.16 | +1W |
| IJH | iShares S&P MidCap 400 Index Fund | 250.70 | 1.68 | Negative | Sell | X | 4.30 | 243.61 | +1W |
| IJR | iShares S&P SmallCap 600 Index Fund | 98.61 | 1.41 | Positive | Sell | O | 2.94 | 97.47 | +1W |
| QQQ | Invesco QQQ Trust | 275.15 | 0.80 | Negative | Sell | O | 1.69 | 294.45 | +1W |
| RSP | Invesco S&P 500 Equal Weight ETF | 144.94 | 1.82 | Positive | O | 5.39 | 142.49 | +1W | |
| SPY | SPDR S&P 500 ETF Trust | 388.64 | 1.65 | Positive | Sell | O | 1.81 | 396.28 | +1W |
| XLG | Invesco S&P 500 Top 50 ETF | 280.39 | 1.34 | Positive | Sell | O | 1.70 | 297.04 | +1W |
The SPDR Dow Jones Industrial Average ETF Trust DIA remains unchanged this week, sitting in a column of O’s at a price of $330. The fund has a current score of 2.82 with a positive score direction of .90, and it now scores below the average US score of 2.93. DIA remains in a positive trend at current levels. Support is offered at $290 on the default chart, the September chart low, with overhead resistance at $345.
The iShares MSCI Emerging Markets ETF EEM sits in a column of X’s this week, recently seen at a price of $41.50. EEM has now posted a third consecutive buy signal and moved back into a positive trend to start the year. With this positive action, EEM now outscores the average Non-US Fund score of 3.10 scoring an above-average 3.30 score. Support is now seen at a price of $38.00.
The iShares MSCI EAFE ETF EFA sits in a column of X’s this week at a price of $71.00. The fund remains in a positive trend but is towards the top of its trading band with a weekly OBOS reading of 68%. The fund now showcases a strong 4.38 fund score, outpacing the average non-US score of 3.10. Support is offered at $55 on the default chart.
The iShares MSCI Frontier and Select EM ETF FM remains in a column of X’s this week after bouncing off its bullish support line in the middle of November, seeing no price changes over the last seven days. The fund has a weak score of 2.13 and is paired with a positive .69 score direction. Bouncing off support, FM is now seen at a price of $26.50. Support is seen below at $23.50, lows for 2022.
The iShares S&P MidCap 400 Index Fund IJH reversed back into a column of X’s last week, now sitting at an unchanged price of $255. IJH remains in a negative trend but is now testing the bearish resistance line at current levels. The fund has a current fund score of 4.30 which is above the average US score of 2.93. Support can be found at $240 on the default chart, the December 2022 lows.
The iShares S&P SmallCap 600 Index Fund IJR reversed down into O’s this week and sits at a price of $98. The fund maintains a weak technical posture having recently broken a string of 2 consecutive sell signals and breaking back into a positive trend with recent action. IJR now sits below the acceptable fund score of 3.0 with a score of 2.94 and is paired with a positive 1.22 score direction. Support is offered at $93 on the default trend chart.
The Invesco QQQ Trust QQQ remains in a column of X’s this week, charting at a price of $280. QQQ remains in a negative trend and has an unacceptable fund score of 1.69. This is lower than the average US fund (2.93), and the fund holds a now negative 1.11 score direction. Initial support is offered at $260.
The Invesco S&P 500 Equal Weight ETF RSP remains in a column of X’s this week, charting at a price of $148. The reversal signals the “action point” of a shakeout for the fund, with the completion of the pattern coming above $152. RSP holds a positive 1.56 score direction and has a fund score of 5.39. This beats the average S&P 500 Index fund score of 3.00 and remains the highest score of the funds in this report. Support is seen at $140 on the default chart.
The SPDR S&P 500 ETF Trust SPY remains in a column of X’s this week, sitting at a price of $400. The fund has a 1.81 score posting which is below the average S&P 500 Index fund score of 3.00. SPY remains in a positive trend and would complete a shakeout pattern with a triple top buy signal at $415. Support is seen at $375 on the default chart.
The Invesco S&P 500 Top 50 ETF XLG remains in a column of O’s this week and currently sits at an unchanged price of $275. XLG now has a 1.70 fund score with a now negative score direction of -1.36. XLG still scores below the average US Fund (2.93). Support is seen at $270 on the default chart.

Average Level
21.56
| < - -100 | -100 - -80 | -80 - -60 | -60 - -40 | -40 - -20 | -20 - 0 | 0 - 20 | 20 - 40 | 40 - 60 | 60 - 80 | 80 - 100 | 100 - > |
|---|---|---|---|---|---|---|---|---|---|---|---|
|
Buy signalijr
|
|||||||||||
|
Sell signalRSP
|
|||||||||||
|
Sell signalgsg
|
Buy signalief
|
||||||||||
|
Buy signalVOOV
|
Buy signallqd
|
||||||||||
|
Buy signalxlg
|
Buy signaliwm
|
Buy signalagg
|
|||||||||
|
Sell signalqqq
|
Buy signalijh
|
Buy signalefa
|
|||||||||
|
Sell signalspy
|
Buy signaluso
|
Buy signaleem
|
|||||||||
|
Buy signaldia
|
Sell signaldvy
|
Buy signalgcc
|
Buy signalfxe
|
||||||||
|
Sell signaldx/y
|
Buy signalvoog
|
Sell signaloneq
|
Sell signalicf
|
Buy signalhyg
|
Buy signaltlt
|
Buy signalSHY
|
Buy signalgld
|
||||
| < - -100 | -100 - -80 | -80 - -60 | -60 - -40 | -40 - -20 | -20 - 0 | 0 - 20 | 20 - 40 | 40 - 60 | 60 - 80 | 80 - 100 | 100 - > |
| AGG | iShares US Core Bond ETF |
| USO | United States Oil Fund |
| DIA | SPDR Dow Jones Industrial Average ETF |
| DVY | iShares Dow Jones Select Dividend Index ETF |
| DX/Y | NYCE U.S.Dollar Index Spot |
| EFA | iShares MSCI EAFE ETF |
| FXE | Invesco CurrencyShares Euro Trust |
| GLD | SPDR Gold Trust |
| GSG | iShares S&P GSCI Commodity-Indexed Trust |
| HYG | iShares iBoxx $ High Yield Corporate Bond ETF |
| ICF | iShares Cohen & Steers Realty ETF |
| IEF | iShares Barclays 7-10 Yr. Tres. Bond ETF |
| LQD | iShares iBoxx $ Investment Grade Corp. Bond ETF |
| IJH | iShares S&P 400 MidCap Index Fund |
| ONEQ | Fidelity Nasdaq Composite Index Track |
| QQQ | Invesco QQQ Trust |
| RSP | Invesco S&P 500 Equal Weight ETF |
| IWM | iShares Russell 2000 Index ETF |
| SHY | iShares Barclays 1-3 Year Tres. Bond ETF |
| IJR | iShares S&P 600 SmallCap Index Fund |
| SPY | SPDR S&P 500 Index ETF Trust |
| TLT | iShares Barclays 20+ Year Treasury Bond ETF |
| GCC | WisdomTree Continuous Commodity Index Fund |
| VOOG | Vanguard S&P 500 Growth ETF |
| VOOV | Vanguard S&P 500 Value ETF |
| EEM | iShares MSCI Emerging Markets ETF |
| XLG | Invesco S&P 500 Top 50 ETF |
| Symbol | Company | Sector | Current Price | Action Price | Target | Stop | Notes |
|---|---|---|---|---|---|---|---|
| GPK | Graphic Packaging Intl. | Forest Prods/Paper | $22.15 | 21 - 23 | 26 | 18 | 5 for 5'er, #2 of 15 in favored FORE sector matrix, LT pos mkt RS, triple top, 1.3% yield, Earn. 2/7 |
| RF | Regions Financial Corporation | Banks | $21.69 | low 20s | 32.50 | 17.50 | 4 for 5'er, top half of favored BANK sector matrix, one box from RS buy signal, R-R>3.0, 3.6% yield, Earn. 1/20 |
| AES | The AES Corporation | Utilities/Electricity | $26.64 | lo-mid 20s | 43.50 | 18.50 | 5 TA rating, top quintile EUTI sector, buy-on-pullback, 2.52% yield, R-R > 4.5 |
| BOX | Box Inc. | Software | $30.54 | mid-hi 20s | 48 | 22 | 5 TA rating, top third SOFT sector, cons. buy signals, R-R > 2.5 |
| PGR | The Progressive Corporation | Insurance | $125.92 | low 120s - low 130s | 168 | 106 | 4 for 5'er, top quartile of favored INSU sector matrix, one box from mkt RS buy, spread triple top |
| BDX | Becton, Dickinson and Company | Healthcare | $253.96 | 240s - mid 250s | 308 | 212 | 5 for 5'er, LT pos mkt RS, quad top breakout, pos trend change, 1.5% yield, Earn. 2/2 |
| GFF | Griffon Corp | Building | $38.36 | low-to-mid 30s | 45 | 28 | 5 for 5'er, 8th of 76 in favored BUIL sector matrix, spread quad top, 1.1% yield, Earn. 1/30 |
| EAT | Brinker International Inc | Restaurants | $35.74 | mid 30s | 56 | 27 | 4 TA rating, top quintile REST sector matrix, 4 consec. buy signals, R-R > 2, Earn. 1/31 |
| TECK | Teck Resources Limited | Metals Non Ferrous | $41.63 | mid-to-high $30s | 51 | 31 | 5 for 5'er, top half of favored META sector matrix, triple top, pos trend flip, R-R>2.0 |
| COHU | Cohu, Inc. | Semiconductors | $34.93 | mid 30s | 51 | 29 | 4 for 5'er. top 10% of SEMI sector matrix, big base breakout, R-R>2.5, Earn. 2/8 |
| MODN | Model N Inc. | Software | $41.61 | hi 30s - low 40s | 64 | 34 | 4 for 5'er, one box from mkt RS buy signal, mutliple consec buys, R-R>3.0,Earn. 2/7 |
| WMT | Walmart Inc. | Retailing | $138.83 | hi 130s - lo 150s | 204 | 116 | 4 TA rating, top half of RETA sector matrix, LT mkt RS buy, buy-on-pullback |
| TJX | The TJX Companies, Inc. | Retailing | $79.41 | 77 - 81 | 94 | 62 | 4 for 5'er, top quintile of RETA sector matrix, multiple consec buy signals, 1.5% yield. |
| SYK | Stryker Corporation | Healthcare | $253.31 | low 220s - hi 240s | 356 | 200 | 4 TA rating, top third HEAL sector, buy-on-pullback, LT RS buy, R-R > 3, Earn. 1/31 |
| TRI | Thomson Reuters Corporation | Media | $117.00 | hi 100s - mid 110s | 91 | 4 for 5'er, 5th of 44 in MEDI sector matrix, one box from mkt RS buy signal, bullish triangle, R-R>2.0, 1.6% yield, Earn. 2/9 | |
| ROST | Ross Stores, Inc. | Retailing | $115.75 | 110s | 146 | 94 | 4 for 5'er, top 10% of RETA sector matrix, multiple consec buy signals, 1.1% yield |
| MCK | McKesson Corporation | Drugs | $378.72 | hi 360s - lo 400s | 464 | 324 | 5 TA rating, top third DRUG sector, LT pos. trend, consec. higher bottoms, Earn. 2/1 |
| ASH | Ashland Inc. | Chemicals | $108.39 | mid 100s - low 110s | 135 | 91 | 4 for 5'er, top 20% of CHEM sector matrix, multiple consec buy signals, pos monthly mom flip, 1.2% yield, Earn. 1/30 |
| TSCO | Tractor Supply Company | Retailing | $206.86 | mid 210s - high 230s | 298 | 186 | 5 TA rating, LT market RS buy, recent peer RS buy, top half RETA sector matrix, Earn. 1/26 |
| MSI | Motorola Solutions Inc. | Telephone | $252.53 | hi 240s - lo 270s | 316 | 212 | 5 TA rating, top decile of TELE sector matrix, consec. buy signals, LT mkt RS buy, Earn. 2/7 |
| AON | Aon Corporation | Insurance | $318.96 | mid 290s - low 310s | 324 | 264 | 4 for 5'er, top half of favored INSU sector matrix, one box from mkt RS buy signal, bullish catapult, Earn. 2/3 |
| HOLX | Hologic Incorporated | Healthcare | $78.76 | mid 70s - lo 80s | 107 | 65 | 4 TA rating, top quartile of HEAL sector matrix, LT RS buy signal, bullish catapult, R-R > 2, Earn. 2/1 |
| V | Visa Inc. | Finance | $220.41 | 210s - 220s | 262 | 188 | 5 for 5'er top third of FIN sector matrix, LT pos mkt RS, spread quintuple top, Earn. 1/26 |
| HIG | The Hartford Financial Services Group | Insurance | $74.31 | mid-hi 70s | 103 | 60 | 5 TA rating, top third INSU sector matrix, cons. buy signals, LT RS buy, buy-on-pullback, 2.15% yield, Earn. 2/2 |
| APO | Apollo Global Management Inc. | Wall Street | $65.78 | mid 60s - low 70s | 92 | 56 | 5 TA rating, 5 consec. buy signals, LT RS buy, 2.41% yield, R-R > 2,Earn. 2/9 |
| SHEL | Shell PLC Sponsored ADR | Oil | $59.13 | hi 50s - low 60s | 79 | 49 | 4 for 5'er, top half of OIL sector matrix, triple top, pos wkly & monthly mom flips, 3.4% yield |
| AME | Ametek Inc | Electronics | $139.03 | hi 130s - lo 150s | 186 | 124 | 5 TA rating, top half of ELEC sector matrix, 4 consec. buys, recent pos. wkly mom., LT RS buy, Earn. 2/2 |
| SCHW | The Charles Schwab Corporation | Wall Street | $76.32 | hi 70s - mid 80s | 95 | 65 | 5 for 5'er, favored WALL sector, multiple consec buys, pullback to middle of trading band |
| ACHC | Acadia Healthcare Company Inc | Healthcare | $83.47 | 82 - 89 | 97 | 73 | 5 for 5'er, top half of HEAL sector matrix, LT pos mkt RS, pos trend change, triple top |
| ADC | Agree Realty Corporation | Real Estate | $74.13 | low-to-mid $70s | 88 | 63 | 4 for 5'er, top half of REAL sector matrix. multiple consec buy signals, 3.9% yield, Earn. 2/14 |
| Symbol | Company | Sector | Current Price | Action Price | Target | Stop | Notes |
|---|
| Comment | |||||||
|---|---|---|---|---|---|---|---|
|
|
|||||||
ADC Agree Realty Corporation R ($73.88) - Real Estate - ADC is a 4 for 5'er that ranks in the top half of the real estate sector matrix. On its default chart, ADC has completed four consecutive buy signals and returned to a positive trend in December. Long exposure may be added in the low-to-mid $70s and we will set our initial stop at $63, which would take out ADC's October low. Using a modified vertical price objective based on the most recent buy signal, we will set our target price at $88. ADC also carries a 3.9% yield. Earnings are expected on 2/14.
| 21 | 22 | 23 | |||||||||||||||||||||||||||||||||||||||||||||||||||
| 80.00 | X | • | 80.00 | ||||||||||||||||||||||||||||||||||||||||||||||||||
| 79.00 | X | X | O | • | 79.00 | ||||||||||||||||||||||||||||||||||||||||||||||||
| 78.00 | X | O | X | O | • | Top | 78.00 | ||||||||||||||||||||||||||||||||||||||||||||||
| 77.00 | X | O | X | O | • | 77.00 | |||||||||||||||||||||||||||||||||||||||||||||||
| 76.00 | • | X | 8 | O | • | 76.00 | |||||||||||||||||||||||||||||||||||||||||||||||
| 75.00 | X | • | X | 9 | • | X | 75.00 | ||||||||||||||||||||||||||||||||||||||||||||||
| 74.00 | X | O | • | X | X | O | • | X | 74.00 | ||||||||||||||||||||||||||||||||||||||||||||
| 73.00 | X | X | 7 | O | • | • | • | X | O | X | O | • | X | X | 73.00 | ||||||||||||||||||||||||||||||||||||||
| 72.00 | 5 | O | 6 | O | X | 9 | • | X | • | X | • | X | O | X | O | • | X | O | X | 72.00 | |||||||||||||||||||||||||||||||||
| 71.00 | X | O | X | O | X | O | X | X | • | X | O | X | O | • | X | X | 7 | • | O | X | C | O | X | 71.00 | |||||||||||||||||||||||||||||
| 70.00 | • | X | O | X | O | O | A | O | X | O | X | O | X | O | • | X | O | X | • | O | X | O | X | O | X | Mid | 70.00 | ||||||||||||||||||||||||||
| 69.00 | • | X | X | • | • | • | X | 4 | O | X | O | X | O | X | O | X | 1 | 4 | O | X | X | O | X | • | O | B | X | O | X | 1 | • | 69.00 | |||||||||||||||||||||
| 68.00 | • | X | O | X | O | C | • | X | • | X | O | X | O | • | O | X | B | X | O | X | O | X | O | X | O | X | 6 | X | • | O | A | X | O | X | O | • | • | 68.00 | |||||||||||||||
| 67.00 | X | X | O | X | O | X | O | • | X | O | • | X | O | X | • | O | C | O | X | O | X | 5 | X | O | X | O | • | O | X | O | X | X | O | X | • | 67.00 | |||||||||||||||||
| 66.00 | A | O | X | O | X | O | X | O | X | • | 2 | O | X | • | X | O | • | O | • | O | 3 | O | X | O | X | • | O | X | O | X | O | X | O | • | 66.00 | ||||||||||||||||||
| 65.00 | X | O | B | O | X | O | X | O | X | O | X | O | X | O | X | • | • | O | X | O | O | • | O | O | X | O | X | • | 65.00 | ||||||||||||||||||||||||
| 64.00 | X | O | X | O | • | O | • | O | X | O | X | O | X | O | X | • | O | X | • | • | O | O | • | 64.00 | |||||||||||||||||||||||||||||
| 63.00 | X | O | X | • | • | O | 1 | X | O | • | 3 | X | • | O | X | • | • | Bot | 63.00 | ||||||||||||||||||||||||||||||||||
| 62.00 | O | • | O | • | • | O | • | 2 | • | 62.00 | |||||||||||||||||||||||||||||||||||||||||||
| 21 | 22 | 23 |

| ALGT Allegiant Travel Company ($84.34) - Aerospace Airline - ALGT broke a double top at $84 for a second buy signal and flip the trend back to positive. The stock will improve to a 2 for 5'er and has now matched the December rally high. A move to $85 would bring the chart to levels not seen since October of last year. Resistance from here lies at $99 and $102. Support lies at $79 and $65, the bullish support line. |
| AZO Autozone, Inc. ($2,329.91) - Autos and Parts - AZO broke a double bottom at $2304 for a second sell signal following a bounce of near-term resistance at $2496. The stock remains a 5 for 5'er, but it has fallen to the bottom half of the Autos and Parts sector matrix. Support now lies at $2176 and $2080, the bullish support line. Continue to monitor. |
| HD Home Depot, Inc. ($311.09) - Building - HD broke a spread triple bottom at $308 for a second sell signal and a violation of the bullish support line. This will drop the stock to a 3 for 5'er in a negative trend. The stock resides in the bottom half of the Building sector matrix and support now lies at $304, with additional support at $280. |
| NFLX NetFlix Inc. ($342.50) - Internet - Shares of NFLX jumped over 8% on Friday following a favorable earnings report. The stock remains a 3 for 5'er at this time yet now trades on two consecutive buy signals well above its bullish support line. The next identifiable level of resistance is situated at around $348, yet more meaningful resistance is up around $400, the highs from March and April 2022. |
| Name | Option Symbol | Action | Stop Loss |
|---|---|---|---|
| Walmart Inc. - $140.44 | WMT2321D140 | Buy the April 140.00 calls at 6.75 | 128.00 |
| Name | Option | Action |
|---|---|---|
| Waste Management, Inc. ( WM) | Jan. 165.00 Calls | Stopped at 150.00 (CP: 156.91) |
| Valero Energy Corp ( VLO) | Jun. 130.00 Calls | Raise the option stop loss to 18.80 (CP: 20.80) |
| Home Depot, Inc. ( HD) | May. 330.00 Calls | Stopped at 308.00 (CP: 313.68) |
| Autodesk, Inc. ( ADSK) | Apr. 195.00 Calls | Initiate an option stop loss of 20.30 (CP: 22.30) |
| Name | Option Symbol | Action | Stop Loss |
|---|---|---|---|
| Amazon.com Inc. - $96.93 | AMZN2321D95 | Buy the April 95.00 puts at 9.55 | 106.00 |
| Name | Option | Action |
|---|---|---|
| Dollar General Corp. (DG) | Jan. 240.00 Puts | Stopped out at $9.10 |
| Union Pacific Corporation (UNP) | May. 220.00 Puts | Initiate a stock price stop of 0.00 (CP: 207.65) |
| Paramount Global (PARA) | May. 22.50 Puts | Initiate an option stop loss of 1.45 (CP: 3.45) |
| Name | Option Sym. | Call to Sell | Call Price | Investment for 500 Shares | Annual Called Rtn. | Annual Static Rtn. | Downside Protection |
|---|---|---|---|---|---|---|---|
| American Airlines Group Inc. $16.28 | AAL2319E17 | May. 17.00 | 1.53 | $7,524.65 | 36.42% | 27.53% | 8.24% |
| Name | Action |
|---|---|
| Bath & Body Works Inc. (BBWI) - 44.25 | Sell the May 45.00 Calls. |
| United States Steel Corporation (X) - 27.64 | Sell the April 27.00 Calls. |
| D.R. Horton, Inc. (DHI) - 92.02 | Sell the May 97.50 Calls. |
| Freeport-McMoRan Inc. (FCX) - 44.14 | Sell the May 44.00 Calls. |
| Marathon Oil Corporation (MRO) - 27.39 | Sell the April 28.00 Calls. |
| Apache Corporation (APA) - 45.16 | Sell the April 47.50 Calls. |
| Cleveland-Cliffs Inc. (CLF) - 20.38 | Sell the April 20.00 Calls. |
| Alcoa Inc. (AA) - 49.52 | Sell the April 55.00 Calls. |
| United Airlines Holdings Inc. (UAL) - 48.37 | Sell the June 55.00 Calls. |
| Royal Caribbean Cruises Ltd. (RCL) - 60.78 | Sell the June 75.00 Calls. |
| On Semiconductor Corp. (ON) - 63.49 | Sell the April 70.00 Calls. |
| Name | Covered Write |
|---|---|
| Occidental Petroleum Corporation ( OXY - 65.67 ) | March 65.00 covered write. |
Daily Equity & Market Analysis
Loading, Please Wait...
