
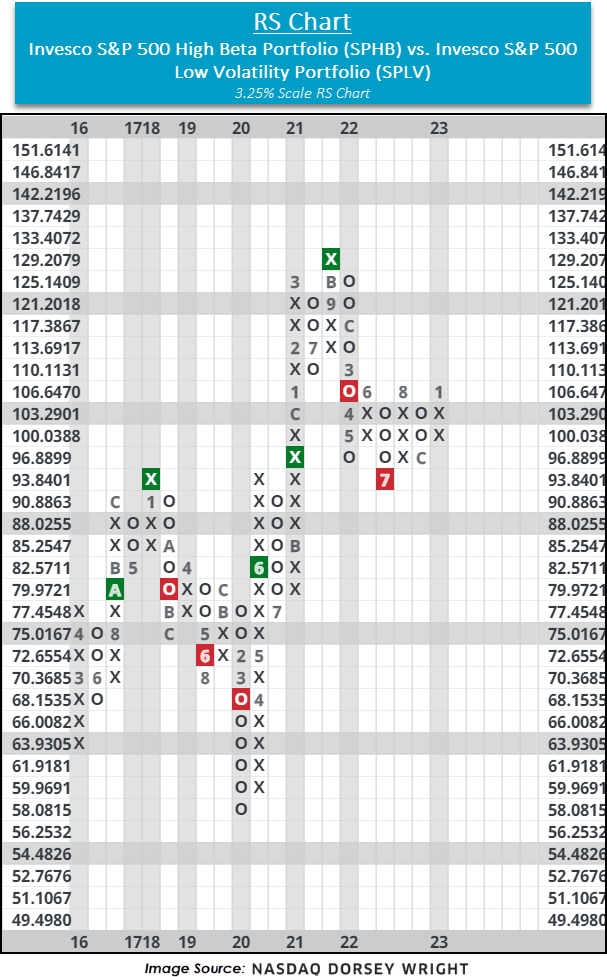
High Beta (SPHB) reversed back into Xs on the RS chart versus Low Volatility (SPLV). There are also a couple of announcements for site changes that will be effective following Friday's close.
Among numerous recent RS chart changes that have occurred over the past week is that comparing the Invesco S&P 500 High Beta Portfolio SPHB vs. the Invesco S&P 500 Low Volatility Portfolio SPLV on a 3.25% scale chart. With the near-term pop in more risk on sectors and areas of US equities, SPHB has rallied over 7% while SPLB has fallen 2.05% year-to-date. This led the fund to reverse back into Xs and return to a buy signal and shift the trend back to positive by breaking a quadruple top at $70. In addition to the fund score of SPHB moving back above 4 and its highest level since February of last year, the RS chart comparing SPHB to SPLV moved back into Xs, favoring SPHB in the near term. The chart has technically been on an RS sell signal (favoring SPLV in the long-term) since March of last year but is within one box of moving back to an RS buy signal favoring SPHB. Prior to the signal flipping to a sell back in March of last year, SPHB had been favored in the RS relationship since June 2020. With weekly momentum also moving back positive, SPHB has had a couple of notable near-term technical developments. A move back to the RS relationship in favor of SPHB would add further positive evidence to risk-on assets in a form that has not been seen in 11 months.
Announcements:
On Friday evening, two changes will occur on the platform.
- For the Invesco S&P 500 Equal Weight ETF RSP the default market relative strength chart will now compare the fund to the S&P 500 Index SPX, rather than the traditional equity index (S&P 500 Equal Weight SPXEWI) used in the market RS comparison. This change will not impact the fund score of RSP. To ensure the change occurs to the RS chart, please log out and log back in upon the first log-in to the platform next week.
- Effective at the close today, the cryptocurrency data provider for the platform will change to Nomics. The new data feed will allow us to better reflect the actual high/low prices for each cryptocurrency and thus we will re-pull all historical prices for the Point & Figure charts. Since the cryptocurrency market trades 24/7, the data pulled will cover the entire trading day and at 00:00 (5:00 am).
