Most Requested Symbols

Ahead of Saturday's scheduled U.S. Senate vote, today we review some of the more prominent themes in the proposed Infrastructure Investment & Jobs Act and provide stock and ETF ideas that could benefit from the passing of the proposed legislation.
The average distribution reading is 25.77% overbought.
Today's featured stock is Ferro Corp (FOE).
AVLR, APPN, BPOP, BLL, FEYE, NAVI, FOXF, FIVE, HCAT, KSS, OUT, PLCE, OMCL, PZZA, AFG, MS, & GS.
Call: Amerisource Bergen Corporation (ABC); Put: JetBlue (JBLU); Covered Write: Costamare Inc (CMRE).
Upcoming Webinar: Join us on Wednesday, August 18th at 1 pm ET for a webinar in partnership with KraneShares on Volatility and Relative Strength in China. In this webinar, we will have the Chinese investment experts at KraneShares review the recent developments in China, and provide perspective on what we can look toward in Chinese equity markets. We will also review the KraneShares Dynamic China Rotation Model available on the NDW research platform, and offer potential implementation ideas for those looking to maintain exposure toward emerging markets while mitigating risk in Chinese equities.
Speakers include:
This webinar is pending 1 hour of CE credit for CFP and CIMA certifications
The S&P 500 Index (SPX) advanced Thursday to mark a new all-time closing high at $4429.10 before continuing higher intraday Friday to break a quadruple top on its default chart and print a new all-time chart high at $4440. Trading on Thursday also led the CBOE SPX Volatility Index VIX to break a double bottom at 17.50, which moved the Index back into an overall negative trend prior to its continued decline Friday to 17. This decline in volatility paired with high levels for the core equity benchmark is consistent with historical averages as the VIX has an average level of about 18 when SPX reaches a new all-time high so far in 2021. If we look at averages from 1950 through trading Thursday, the VIX has an average level of roughly 15 when the SPX hits a new all-time high, so we might expect even more of a decline in volatility if SPX continues to push higher.
This year has seen a total of 43 new all-time closing highs for the S&P 500, which is the tenth highest number of all-time closing highs seen in any year since 1950. This equates to about 27.7% of the trading days so far this year, which is the third-highest percentage of all-time closing high trading days over the same timeframe. Interestingly enough, we have seen this year’s all-time highs come with an average SPX OBOS reading of just 61%. This is below the average OBOS reading at all-time highs since 1950 at 85%, indicating 2021 has seen a much steadier ascent for the core market benchmark as it navigates uncharted waters.
Annual returns for SPX in other years with a significant amount of new all-time highs are generally very positive. If we examine only the years that have seen at least 10% of the trading days hit fresh closing highs, we are left with 25 years since 1950. The average return for SPX in those 25 years sits at over 19%, which is slightly higher than the year-to-date return for the Index in 2021 at 17.92% (through 8/5). This steady improvement for the index has come with positive recent participation readings, as the Bullish Percent for SPX ^BPSPX reversed back up into a column of X's last week, and the Positive Trend for SPX ^PTSPX sits in a high field position at a chart level of 82%. While these intermediate and long-term indicators each demonstrate strength, the more near-term focused Ten Week for SPX ^TWSPX sits at a reading of just 56% through trading Thursday. While this does show that over half of the stocks in the S&P 500 are trading above their ten-week moving average, it also means that 44% of the stocks are still trading below that average, we have seen this indicator sit at much higher levels earlier this year with readings as high as 92% in April. This points toward the potential for further near-term improvement, making the TWSPX indicator an important indicator to monitor for continued advances as we head toward the end of the year.


After failing to reach an agreement on Thursday, the U.S. Senate is scheduled to vote once again on Saturday to finalize and move towards the passage of the Infrastructure Investment and Jobs Act, a bipartisan bill that includes $550 billion in new federal investment in America’s infrastructure (Source: Reuters) While the 2,702-page, $1 trillion proposed bipartisan bill makes mention of investments into the traditional infrastructure realm such as repair of roads and bridges, public transit upgrades, and the replacement of lead water pipes, it also unveils plans to update and improve other vital areas of modern-day society such as providing reliable high-speed internet and broadband access for all Americans and electrifying schools and buses across the country with a focus on clean energy transmission. The legislation includes a comprehensive Buy America provision to ensure that all taxpayer-funded infrastructure and public works projects are built with American iron, steel, manufactured products, and construction materials in an effort to create manufacturing jobs in the USA. (Source: The White House) Click here to read the proposed bill in its entirety.

In Wednesday’s DALI & US Equity Overview feature, we discussed some of the sub-sectors that could be affected the most by the passing of the Infrastructure Investment and Jobs Act, such as heavy construction, transportation services, communication technology, and pollution, and reviewed each area’s relative strength when compared to one another using DWA sub-sector indexes. Today, we will take our analysis one step further and drill down into technically sound individual stock ideas that may benefit from the passing of the Infrastructure and Jobs Act, as well as a few ETF ideas to consider if looking for a way to "play" the proposed legislation. Bear in mind that the infrastructure bill has not been passed and that the potential list of related stocks and sub-sector themes that may be impacted is very broad. The stocks and sector themes discussed today are by no means the final list as by the time the bill is passed, the list could either be more or less than those shown. The degree to what stocks and related sub-sectors may be impacted most also has the potential to change.
Access to Reliable Broadband for All Americans

Other Stock Ideas:
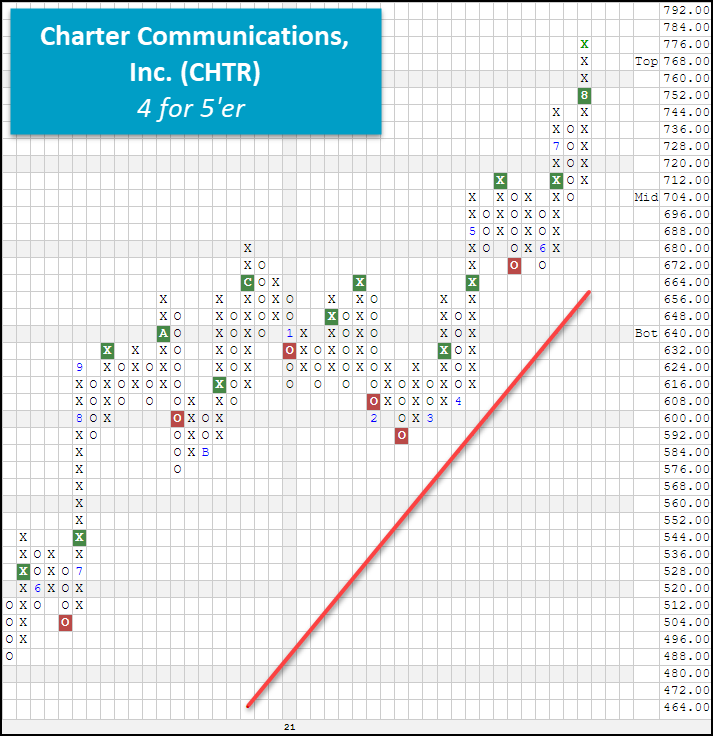
Comcast Corporation - CMCSA - 3 for 5'er
Dish Network Corporation - DISH - 3 for 5'er
AT&T Inc. - T - 1 for 5'er
Road and Bridge Repair, Traditional Infrastructure


Other Stock Ideas:
Caterpillar, Inc. - CAT - 2 for 5'er
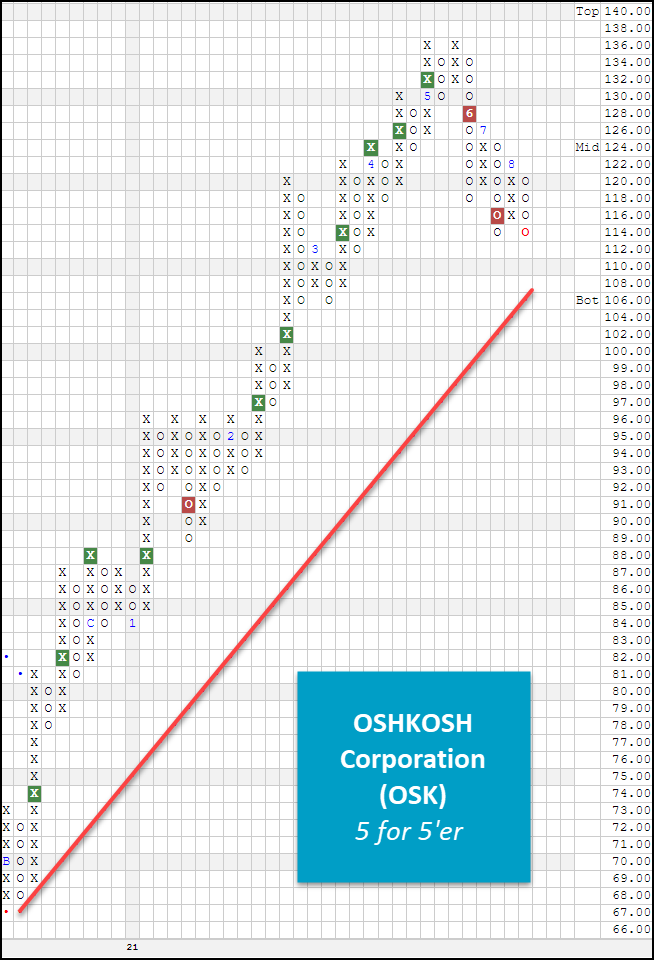
Deere & Company - DE - 4 for 5'er
Clean Energy Transmission, Electric Vehicles (EVs), & Energy Infrastructure

Other Stock Ideas:
Brookfield Infrastructure Corporation Class A - BIPC - 0 for 5'er
Quanta Services Inc. - PWR - 5 for 5'er
Repair and Improvement of Waterworks/Clean Water/Wastewater Infrastructure

Other Stock Ideas:
Middlesex Water Co - MSEX - 5 for 5'er
Watts Industries, Inc. - WTS - 4 for 5'er
Infrastructure Investment and Job Act-related ETFs

In continuation of our FSM models update featured in yesterday’s Fund Score Overview, we will look at how the seasonal update impacted the fixed income and variable annuity models. As a refresher, the FSM seasonal models are evaluated four times a year at the beginning of each seasonal quarter, so at the beginning of February, May, August, and November. At each evaluation, the models will sort their respective inventories by fund score, seeking to only hold those funds that possess the highest scores. The number of securities held is dependent on the model, but will typically be two or five names. For more information on the construction of the FSM models, please visit our FSM model guide.
Fixed Income Models:
Only one of our four fixed income FSM models made a change with the FSM Franklin Fixed Income ADV 2S PR4080 selling out of the Franklin Convertible Securities Fund (FISCX) and buying the Franklin Floating Rate Daily Access (FAFRX). The convertible bonds asset class was arguably the strongest area of fixed income over the last year as its high correlation to equity markets acted as a tailwind, however, that has cooled off over the past couple of months. With floating rate bonds replacing convertibles, a move higher in interest would actually be beneficial for this allocation as floating rate bonds benefit from rising interest rates. The model still maintains its exposure to emerging market debt, so there’s a 50/50 split between US and non-US exposure.

Variable Annuity Models:
Two out of the four variable annuity FSM models made changes this week. As a reminder, the variable annuity models use proxies to represent the subaccounts in the corresponding variable annuity. While we’re unable to find proxies for the entire subaccount suite of the variable annuities, we have a well-rounded lineup of proxies that represent a wide majority of the subaccounts.
The first variable annuity model that made changes was the FSM Jackson Perspective/Elite Access VA 5S PR4050 which moved out of the Oakmark International I (OAKIX) and DFA US Small Cap I (DFSTX) to buy the WCM Focused International Growth Inv (WCMRX) and the USAA NASDAQ-100 Index (USNQX). These trades match the overarching theme established in yesterday's model review, as many models moved out of small caps and value in favor of large caps and growth. The model is now overweight large caps and growth names, with high exposure toward technology.

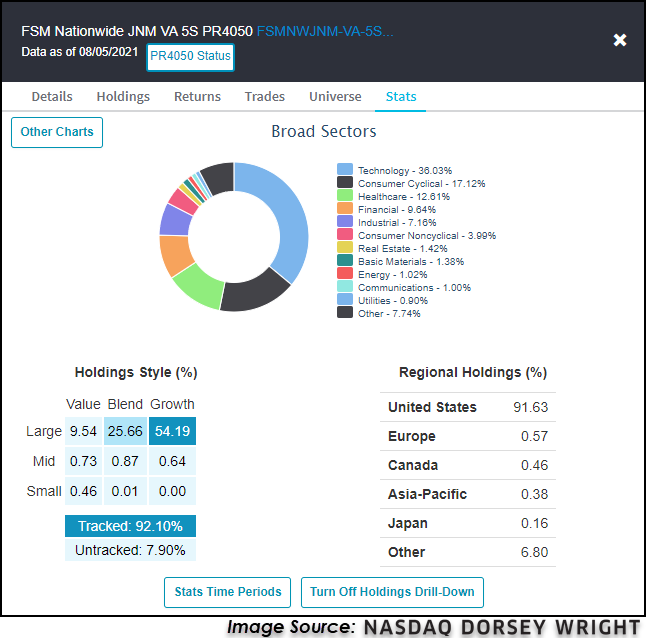
The second variable annuity model that saw changes was the FSM Nationwide JNM VA 5S PR4050 which turned over three funds. The model moved out of two mid-cap funds and one all-cap fund while buying three large-cap funds, leaving over half the exposure to be focused on large-cap growth. The model now overweights technology at 33.03% and consumer cyclicals at 17.12%. Just like the Jackson Perspective model, we see the overarching theme of the broader FSM model update highlighted once again in these changes. Large caps and growth are replacing small caps and value, which we have touched on quite frequently over the last few weeks. Complementary to the benefit of using rule-based models to make decisions and trades, we can also use them to help identify changes in market trends. Using the Asset Class Group Scores page in conjunction with the FSM models, we have a variety of methods to stay on top of market trends and changes.

Average Level
25.77
| AGG | iShares US Core Bond ETF |
| USO | United States Oil Fund |
| DIA | SPDR Dow Jones Industrial Average ETF |
| DVY | iShares Dow Jones Select Dividend Index ETF |
| DX/Y | NYCE U.S.Dollar Index Spot |
| EFA | iShares MSCI EAFE ETF |
| FXE | Invesco CurrencyShares Euro Trust |
| GLD | SPDR Gold Trust |
| GSG | iShares S&P GSCI Commodity-Indexed Trust |
| HYG | iShares iBoxx $ High Yield Corporate Bond ETF |
| ICF | iShares Cohen & Steers Realty ETF |
| IEF | iShares Barclays 7-10 Yr. Tres. Bond ETF |
| LQD | iShares iBoxx $ Investment Grade Corp. Bond ETF |
| IJH | iShares S&P 400 MidCap Index Fund |
| ONEQ | Fidelity Nasdaq Composite Index Track |
| QQQ | Invesco QQQ Trust |
| RSP | Invesco S&P 500 Equal Weight ETF |
| IWM | iShares Russell 2000 Index ETF |
| SHY | iShares Barclays 1-3 Year Tres. Bond ETF |
| IJR | iShares S&P 600 SmallCap Index Fund |
| SPY | SPDR S&P 500 Index ETF Trust |
| TLT | iShares Barclays 20+ Year Treasury Bond ETF |
| GCC | WisdomTree Continuous Commodity Index Fund |
| VOOG | Vanguard S&P 500 Growth ETF |
| VOOV | Vanguard S&P 500 Value ETF |
| EEM | iShares MSCI Emerging Markets ETF |
| XLG | Invesco S&P 500 Top 50 ETF |
| Symbol | Company | Sector | Current Price | Action Price | Target | Stop | Notes |
|---|---|---|---|---|---|---|---|
| GFL | GFL Environmental Inc | Waste Management | $34.98 | low to upper 30s | 38 | 26 | 5 for 5'er, 5 consec buy signals, pullback from ATH |
| AKR | Acadia Realty Trust | Real Estate | $21.41 | 20 - 22 | 28 | 18 | 4 for 5'er, #6 of 154 in REAL sector matrix, one box from RS buy signal, 2.7% yield |
| STOR | Store Capital Corp. | Real Estate | $36.76 | mid-to-upper 30s | 47.50 | 30 | 5 for 5'er, multiple buy signals, one box from 52-week high, 4.1% yield, R-R>2.0 |
| RVNC | Revance Therapeutics, Inc | Biomedics/Genetics | $29.83 | hi 20s - low 30s | 40 | 26 | 5 for 5'er, top 25% of BIOM sector matrix, quad top breakout, positive trend change, pos monthly mom flip |
| NDLS | Noodles & Company | Restaurants | $12.61 | 11.50 - 13.50 | 20 | 10 | 5 for 5'er, #1 of 28 in REST sector matrix, triple top, pullback to mid of trading band, R-R>2.5 |
| SEM | Select Medical Holdings Corporation | Healthcare | $39.00 | hi 30s - low 40s | 58 | 35 | 5 for 5'er, #8 of 116 names in favored HEAL sector matrix, multiple buy signals, good R-R |
| JBL | Jabil Circuit, Inc. | Electronics | $58.99 | low to high 50s | 73 | $47 | 4 for 5'er, multi-year highs, consecutive buy signals, top 10% of DWAELEC Earnings 9/22 |
| OXY | Occidental Petroleum Corporation | Oil | $26.19 | upper 20s - lower 30s | 33.50 | 22 | 3 for 5'er, top half of favored OIL sector matrix, bullish triangle, pullback from 52-week high |
| TW | Tradeweb Markets, Inc. Class A | Business Products | $88.42 | 80s | 100 | 71 | 4 for 5'er, top 20% of BUSI sector matrix, triple top, pullback from ATH |
| UNH | UnitedHealth Group Incorporated | Healthcare | $411.19 | 390-420 | 496 | 340 | 4 for 5'er, top half of favored DWAHEAL matrix, consec buy signals, pullback from ATH, pos weekly mom flip, 1.38% yield |
| MS | Morgan Stanley | Wall Street | $97.83 | 90s | 109 | 83 | 5 for 5'er, top 10% of WALL sector matrix, spread triple top, LT pos mkt RS, 3.1% yield |
| ENTG | Entegris Inc. | Semiconductors | $121.96 | 110s to high 120s | 170 | 95 | 5 for 5'er, pullback from ATH, long-term market RS buy signal, top 25% of DWASEMI |
| GGG | Graco Inc | Machinery and Tools | $78.76 | mid 70s to low 80s | 108 | 64 | 4 for 5'er, consec buy signals, pullback from ATH, 1 box from bullish triangle, pos weekly momentum, long-term market & peer RS buy signals |
| DHI | D.R. Horton, Inc. | Building | $96.34 | 90s | 109 | 79 | 4 for 5'er, top 25% of BUIL sector matrix, LT pos mkt RS, spread quad top breakout, pos. trend change |
| AA | Alcoa Inc. | Metals Non Ferrous | $38.75 | mid to upper 30s to mid 40s | 56 | 30 | 5 for 5'er, bearish signal reversal pattern, pullback from multi-year highs, pos weekly mom flip, long-term market RS buy signal |
| ODFL | Old Dominion Freight Line, Inc. | Transports/Non Air | $272.19 | 250s to 280s | 324 | 216 | 5 for 5'er, pullback from ATH, 5 consec buy signals, LT market RS, pos weekly momentum, top 1/3 DWATRANS |
| ARCH | Arch Resources Inc | Oil | $65.84 | mid-to-upper 60s | 85 | 56 | 5 for 5'er, top 10% of oil sector matrix, bullish catapult, pullback from 52-wk high, R-R~2.0 |
| FB | Facebook Inc. | Internet | $362.97 | 340s - 360s | 460 | 304 | 4 for 5'er, top third of INET sector matrix, triple top breakout, pullback from ATH, R-R>2.0 |
| CMC | Commercial Metals Corporation | Steel/Iron | $31.76 | low to mid 30s | 36 | 26 | 5 for 5er, 2 weeks pos weekly mom, 4 consec buy signals, pullback from multi-year high, 1.46% yield |
| AFG | American Financial Group Inc | Insurance | $131.86 | high 120s - high 130s | 152 | 106 | 5 for 5'er, #5 of 65 names in INSU sector matrix, multiple consec buy signals, triple top breakout |
| LKQ | LKQ Corporation | Autos and Parts | $50.53 | high 40s to mid 50s | 63 | 40 | 4 for 5'er, top 10% of DWAAUTO, 10 consec buy signals & sitting at ATH |
| FOE | Ferro Corp | Chemicals | $20.56 | high teens to low 20s | 35 | 16 | 4 for 5'er, 8 consec buy signals, pullback from recent high, pos trend, top of DWACHEM matrix |
| Symbol | Company | Sector | Current Price | Action Price | Target | Stop | Notes |
|---|---|---|---|---|---|---|---|
| OPEN | Opendoor Technologies Inc. | Wall Street | $14.40 | low to mid 10s | 2 | 19.50 | 0 for 5'er, 4 consecutive sell signals, negative trend, bottom of DWAWALL matrix, negative monthly momentum, Earn. 8/11 |
| RAMP | Liveramp Holdings Inc. | Business Products | $38.83 | high 40s to high 30s | 36 | 51 | 0 for 5'er, 10 consec sell signals, 52 week lows, negative monthly mom flip, negative trend |
| Comment | |||||||
|---|---|---|---|---|---|---|---|
|
|
|||||||
FOE Ferro Corp R ($20.62) - Chemicals - FOE is a solid 4 for 5’er that ranks 3rd out of 55 names in the chemicals sector stock matrix. FOE is trading well above the bullish support line and has given eight consecutive buy signals since April 2020. After reaching a new multi-year high at $22 in May, shares of FOE pulled back to $18.50, where they remained well above support. With today’s action, FOE has reversed back up into Xs to $20. From here, a move to $23 would mark the stock’s 9th consecutive buy signal and a new rally high. Okay to add exposure in the high teens to low 20s. We will set our initial stop at $16, which would violate multiple levels of support. We will use $35, our modified bullish price objective based on the chart’s last buy signal, as our near-term price target.
| 18 | 19 | 20 | 21 | |||||||||||||||||||||||||||||||||||||||||||||||||||
| 25.00 | X | • | • | 25.00 | ||||||||||||||||||||||||||||||||||||||||||||||||||
| 24.00 | B | O | 3 | • | 24.00 | |||||||||||||||||||||||||||||||||||||||||||||||||
| 23.00 | A | O | X | O | • | 23.00 | ||||||||||||||||||||||||||||||||||||||||||||||||
| 22.00 | X | 2 | X | O | • | • | X | Top | 22.00 | |||||||||||||||||||||||||||||||||||||||||||||
| 21.00 | X | O | 5 | • | X | • | X | O | Mid | 21.00 | ||||||||||||||||||||||||||||||||||||||||||||
| 20.00 | X | X | A | • | X | X | O | • | X | O | x | Bot | 20.00 | |||||||||||||||||||||||||||||||||||||||||
| 19.50 | X | O | 9 | O | X | X | O | X | O | • | X | 8 | x | 19.50 | ||||||||||||||||||||||||||||||||||||||||
| 19.00 | X | 7 | O | X | O | X | O | X | O | X | O | • | X | O | x | 19.00 | ||||||||||||||||||||||||||||||||||||||
| 18.50 | X | O | X | 8 | X | O | X | O | X | 3 | O | • | X | X | O | 18.50 | ||||||||||||||||||||||||||||||||||||||
| 18.00 | 6 | O | X | O | O | X | C | X | 4 | • | X | O | 5 | 18.00 | ||||||||||||||||||||||||||||||||||||||||
| 17.50 | O | X | O | O | B | O | X | O | • | X | O | X | 17.50 | |||||||||||||||||||||||||||||||||||||||||
| 17.00 | O | X | O | X | O | X | 2 | 5 | • | X | O | X | 17.00 | |||||||||||||||||||||||||||||||||||||||||
| 16.50 | 5 | O | X | O | 1 | O | X | • | O | • | 3 | O | 16.50 | |||||||||||||||||||||||||||||||||||||||||
| 16.00 | O | • | O | X | O | X | • | O | 7 | • | X | X | 16.00 | |||||||||||||||||||||||||||||||||||||||||
| 15.50 | • | • | O | X | O | • | O | 6 | O | • | X | 1 | O | 2 | • | 15.50 | ||||||||||||||||||||||||||||||||||||||
| 15.00 | • | O | • | • | O | X | O | C | • | X | O | C | X | O | X | • | 15.00 | |||||||||||||||||||||||||||||||||||||
| 14.50 | • | • | O | X | O | X | O | • | X | O | X | O | X | O | X | • | 14.50 | |||||||||||||||||||||||||||||||||||||
| 14.00 | • | O | 8 | X | X | O | • | X | X | B | O | X | O | X | O | • | 14.00 | |||||||||||||||||||||||||||||||||||||
| 13.50 | • | O | X | O | X | 2 | • | 6 | X | O | X | O | X | O | • | O | • | • | 13.50 | |||||||||||||||||||||||||||||||||||
| 13.00 | • | O | X | O | X | O | • | X | O | 8 | O | A | O | X | • | • | 13.00 | |||||||||||||||||||||||||||||||||||||
| 12.50 | • | O | X | B | O | O | • | X | O | 7 | O | X | O | • | 12.50 | |||||||||||||||||||||||||||||||||||||||
| 12.00 | • | O | X | O | X | O | • | X | O | X | 9 | X | • | 12.00 | ||||||||||||||||||||||||||||||||||||||||
| 11.50 | O | 9 | O | X | O | • | X | O | X | O | • | 11.50 | ||||||||||||||||||||||||||||||||||||||||||
| 11.00 | O | X | A | 3 | X | X | O | • | 11.00 | |||||||||||||||||||||||||||||||||||||||||||||
| 10.50 | O | X | O | X | X | O | X | • | 10.50 | |||||||||||||||||||||||||||||||||||||||||||||
| 10.00 | O | O | X | X | X | X | O | X | O | X | • | 10.00 | ||||||||||||||||||||||||||||||||||||||||||
| 9.50 | O | X | O | X | O | X | O | X | O | X | O | • | 9.50 | |||||||||||||||||||||||||||||||||||||||||
| 9.00 | O | X | O | X | O | X | O | X | 5 | • | • | 9.00 | ||||||||||||||||||||||||||||||||||||||||||
| 8.50 | O | O | X | 4 | X | O | • | • | 8.50 | |||||||||||||||||||||||||||||||||||||||||||||
| 8.00 | O | O | • | • | 8.00 | |||||||||||||||||||||||||||||||||||||||||||||||||
| 18 | 19 | 20 | 21 |

| AFG American Financial Group Inc ($132.18) - Insurance - AFG shares moved higher today to break a double top and complete a bullish catapult at $132. This 5 for 5'er has been in a positive trend since January and on an RS buy signal versus the market since June. AFG is actionable at current levels with a weekly overbought/oversold reading of 35%. From here, support is offered at $124. |
| APPN Appian Corp. ($102.01) - Software - APPN moved lower Friday after releasing earnings to break a double bottom at $106 before falling to $100 intraday. This also violated the bullish support line to place the stock back in a negative trend, demoting it to a 0 for 5'er from a technical attribute perspective. Weekly momentum recently flipped negative as well, suggesting the potential for further downside from here. Avoid long exposure. Further support may be seen at $90. Initial overhead resistance may be found at $114. |
| AVLR Avalara Inc ($171.61) - Software - AVLR moved higher Friday after its earnings release to break a double top at $176, marking its third consecutive buy signal before reaching $180 intraday. This 3 for 5'er moved to a positive trend in June and ranks in the top quartile of the software sector RS matrix. The weight of the evidence is positive here, with initial support offered at $164. |
| BLL Ball Corporation ($85.69) - Business Products - BLL returned to a buy signal Friday as the stock gained more than 6% intraday. Despite the positive action Friday, BLL's overall picture remains unfavorable as it is a 0 for 5'er that ranks in the bottom quintile of business products sector matrix. The stock now sits against resistance at $86, while its bearish resistance line sits at $89. |
| BPOP Popular, Inc. ($75.79) - Banks - BPOP broke a double top at $75, returning to a buy signal for the first time since June before the stock rallied up to $76 on the chart. BPOP is a 5 for 5'er that ranks in the top quintile of the Banks sector matrix and is accompanied by a yield of roughly 2.5%. Initial support lies at $71, while additional lies at $69. |
| FEYE FireEye, Inc ($16.78) - Software - FEYE reversed down into O's and fell to break a spread triple bottom at $17.50 before continuing down to $17 on the chart, which violates the bullish support line. This causes the stock to move to a negative trend and to a 2 for 5 in attribute rating. FEYE ranks in the bottom half of the Software sector matrix, and with the violation of material support, we would look to begin to trim or step away depending on cost basis. Support on the default chart now lies at $13.50. |
| FIVE Five Below Inc ($203.19) - Household Goods - FIVE broke a spread quadruple top at $204 on Friday, marking the stock’s second consecutive buy signal. FIVE is a 3 for 5’er within the household goods sector that has experienced three weeks of positive weekly momentum. FIVE is now at its all-time high that has been reached on three previous occasions. From here, a move to $206 would mark a new all-time high. Support sits at $188. |
| FOXF Fox Factory Holding Corp ($158.10) - Autos and Parts - FOXF reversed back into X's and rallied to break a triple top at $168 before making a new high at $172. FOXF is a 5 for 5'er that ranks 7th (out of 57) in the Auto and Parts sector matrix. Okay to consider here on the breakout or on a pullback to $166 on the chart. Initial support lies at $156, while longer-term support lies at $146. |
| GS Goldman Sachs Group, Inc. ($396.75) - Wall Street - GS shares moved higher today to break a double top at $388 and continued higher to $396 to reach a new all-time high. This 3 for 5'er has been in a positive trend since November but on an RS sell signal versus the market since June of 2016. GS is actionable at current levels with a weekly overbought/oversold reading of 25%. From here, support is offered at $372. |
| HCAT Health Catalyst, Inc. ($57.20) - Healthcare - HCAT shares moved higher today to break a double top at $59 to return to a buy signal and form a spread quadruple top. This 5 for 5'er has been in a positive trend since June of 2020 and on an RS buy signal versus the market since January. HCAT is actionable at current levels with a weekly overbought/oversold reading of 9%. From here, support is offered at $55 and $54. |
| KSS Kohl's Corporation ($52.87) - Retailing - KSS broke a triple top at $53 before moving higher to $54 on Friday. This move returned the chart to a buy signal as well as an overall positive trend. As a result, KSS is now a 3 for 5’er within the retailing sector. Support sits at $49 while KSS is testing overhead resistance at current levels. KSS yields 1.95%. |
| MS Morgan Stanley ($99.52) - Wall Street - MS shares moved higher today to break a double top at $99 to mark its third consecutive buy signal and reach a new all-time high. This 5 for 5'er has been in a positive trend since May of 2020 and on an RS buy signal versus the market since June of 2013. MS is actionable at current levels with a weekly overbought/oversold reading of 55%. From here, support is offered at $95. |
| NAVI Navient Corporation ($21.42) - Finance - NAVI shares moved higher today to break a double top at $21 to mark its fourth consecutive buy signal. This 5 for 5'er has been in a positive trend since November and on an RS buy signal versus the market since April. NAVI is actionable at current levels with a weekly overbought/oversold reading of 47%. From here, support is offered at $18.50. |
| OMCL Omnicell, Inc. ($159.48) - Healthcare - OMCL shares moved higher today to break a double top at $156 to mark its second consecutive buy signal and reach a new all-time high. This 5 for 5'er has been in a positive trend since July of 2020 and on an RS buy signal versus the market since November of 2020. OMCL is actionable at current levels with a weekly overbought/oversold reading of 42%. From here, support is offered at $140. |
| OUT Outfront Media Inc. ($24.90) - Media - OUT is a 3 for 5’er within the media sector that broke a double top at $26. Today’s breakout marks the stock’s third consecutive buy signal and a new 52 week high. From here, a move to $32 would mark a new all-time high on the chart. Support sits at $21. |
| PLCE Childrens Place Inc. ($90.51) - Retailing - PLCE returned to a positive trend on Friday when it broke a double top at $88 before moving higher to $90. As a result, PLCE is now a perfect 5 for 5’er within the retailing sector. From here, support sits at $83. PLCE faces overhead resistance at $98. |
| PZZA Papa Johns Intl Inc ($122.26) - Restaurants - PZZA broke a double top at $120 before moving higher to $122 on Friday, marking the stock’s second consecutive buy signal and a new all-time high. PZZA is a 3 for 5’er that ranks #1 in our restaurants sector stock matrix. Monthly momentum has been positive for two months, adding to the bullish weight of the evdience. From here, support sits at $112. |
| Name | Option Symbol | Action | Stop Loss |
|---|---|---|---|
| AmerisourceBergen Corporation - $121.31 | O: 22A120.00D21 | Buy the January 120.00 calls at 8.50 | 110.00 |
| Name | Option | Action |
|---|---|---|
| Amphenol Corporation ( APH) | Oct. 67.50 Calls | Raise the option stop loss to 4.80 (CP: 6.80) |
| American International Group, Inc. ( AIG) | Nov. 47.00 Calls | Initiate an option stop loss of 3.55 (CP: 5.55) |
| Name | Option Symbol | Action | Stop Loss |
|---|---|---|---|
| JetBlue Airways Corporation - $15.14 | O: 21X16.00D17 | Buy the December 16.00 puts at 2.09 | 16.00 |
| Name | Option | Action |
|---|---|---|
| The Progressive Corporation (PGR) | Nov. 100.00 Puts | Stopped at 5.40 (CP: 5.40) |
| Activision Blizzard, Inc. (ATVI) | Nov. 95.00 Puts | Stopped at 14.45 (CP: 13.85) |
| Name | Option Sym. | Call to Sell | Call Price | Investment for 500 Shares | Annual Called Rtn. | Annual Static Rtn. | Downside Protection |
|---|---|---|---|---|---|---|---|
| Costamare Inc. $11.17 | O: 21L12.00D17 | Dec. 12.00 | 0.85 | $5,210.00 | 38.68% | 19.23% | 6.55% |
| Name | Action |
|---|---|
| Cleveland-Cliffs Inc. (CLF) - 23.32 | Sell the October 22.00 Calls. |
| Antero Resources Corp (AR) - 13.24 | Sell the November 15.00 Calls. |
| United States Steel Corporation (X) - 25.31 | Sell the October 25.00 Calls. |
| Cloudflare Inc Class A (NET) - 121.46 | Sell the November 115.00 Calls. |
| Mosaic Company (MOS) - 30.70 | Sell the December 32.00 Calls. |
| Dick's Sporting Goods, Inc. (DKS) - 107.78 | Sell the December 110.00 Calls. |
| Halliburton Company (HAL) - 19.48 | Sell the October 21.00 Calls. |
| The Trade Desk Inc (TTD) - 83.38 | Sell the November 90.00 Calls. |
| Green Plains Inc. (GPRE) - 33.44 | Sell the December 36.00 Calls. |
| Alcoa Inc. (AA) - 38.75 | Sell the November 42.00 Calls. |
| Nucor Corporation (NUE) - 101.51 | Sell the October 105.00 Calls. |
| Biocryst Pharmaceuticals Inc (BCRX) - 17.65 | Sell the December 18.00 Calls. |
| Ford Motor Company (F) - 13.71 | Sell the November 14.00 Calls. |
| United States Steel Corporation (X) - 25.31 | Sell the October 26.00 Calls. |
| Name | Covered Write |
|---|---|
|
|
|
Daily Equity & Market Analysis
LISTEN TO PODCAST
Apr 02, 2026
Loading, Please Wait...
