
We examine the historical tendencies for the monthly returns of the S&P 500 Index as we enter August.
Market action Friday saw the last trading day for the month of July, which resulted in the S&P 500 Index SPX ending the week slightly lower but finishing the month at a gain of more than 2%. As we head into August, the S&P 500 sits less than 1% off its all-time chart high of 4420 that was reached for the second time this month in trading Thursday. The index has also seen a positive return in each of the last six months, with five out of those six months seeing a gain of at least 2%. The consistent improvement from the core market benchmark has certainly been welcomed by investors, but also raises the question of just how long this improvement can continue. The US equity market has proven repeatedly to look past eye-catching negative headlines while moving higher. However, the three-month span ahead of August through October has certainly seen some intense market movement throughout history.
To examine these moves further, we have taken the average, minimum, and maximum returns for the S&P 500 monthly from April 1987 through June 2021. This data reveals that the upcoming month of August has shown the second-lowest minimum decline of any month in our testing history, at a loss of 14.58% in August 1998, with October having the lowest minimum at a -21.76% return in 1987. August is also one of only two months to show a negative average return, with the other being September. Furthermore, August showed one of the lowest maximum returns of any month.

The percent of positive returns for each month in our testing timeframe saw August as the second-lowest percentage at 56% of the years since 1987. September showed the lowest percentage at just 50% of the years. Even though the months of October through November have shown some intense drawdowns, the percentage of those months with positive returns increases as you move closer toward the end of the year.

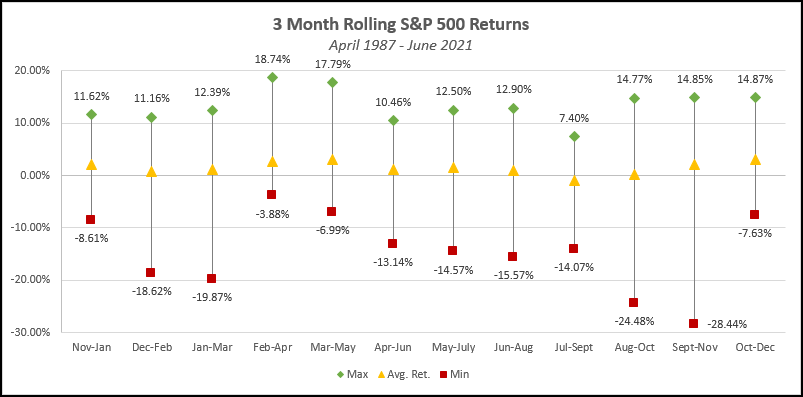
We also examined the average, minimum, and maximum return for SPX over three-month rolling time periods beginning with November through January and ending with October through December. This data showed that the July through September timeframe had the lowest average return and was the only average in the red at -0.88%. The second-lowest average was the three-month span from August through October, which also saw the second-worst minimum return at -24.48%.
This data does not necessarily mean that the upcoming month is due for sharply negative returns, as there have been many instances of positive returns in August historically. Domestic equity markets also continue to rank highly in our relative strength comparisons and have shown a recent uptick in participation through indicators such as the Bullish Percent for NYSE ^BPNYSE, which reversed back up into a column of X's following trading Thursday. With that said, the historical tendencies for more muted returns in the months of August through October should certainly be considered when making asset allocation decisions, as it is especially important to maintain exposure toward those sectors with increased relative strength or individual equities that possess favorable technical attributes.
