Most Requested Symbols

We examine the historical tendencies for the monthly returns of the S&P 500 Index as we enter August.
The average distribution reading is 33.70% overbought.
Today's featured stock is Arch Resources Inc (ARCH).
ABG, AMCX, AMRC, CPRI, CROX, EAT, EQT, KLAC, MITK
Call: Twitter (TWTR); Put: NIO Inc. (NIO); Covered Write: Alcoa Inc (AA).
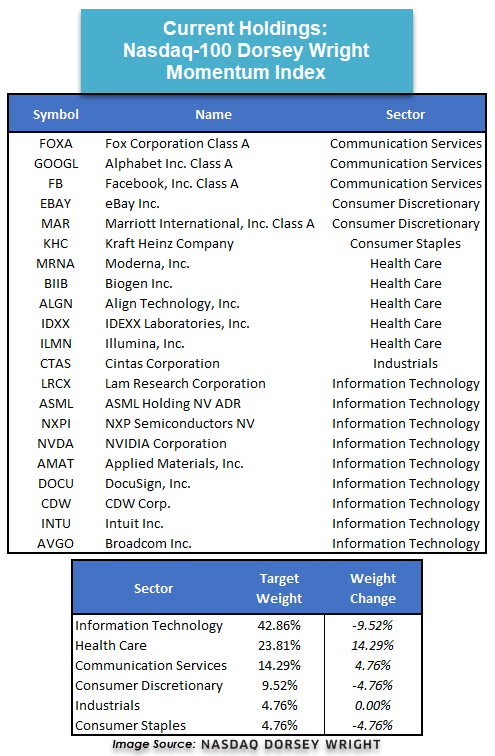
In May, we announced the launch of the Nasdaq-100 Dorsey Wright Momentum Index. As a brief refresher, the Nasdaq-100 Dorsey Wright Momentum Index is composed of 21 equal-weighted stocks within the Nasdaq-100 universe with superior Relative Strength/momentum characteristics. The index is evaluated and reconstituted/rebalanced quarterly on a Jan/Apr/Jul/Oct cycle. To construct the index, we utilize the Nasdaq-100 Total Return RS Matrix located under the “Premade Matrices” section of the NDW Research Platform. Like many of our matrix-based strategies, we start by buying the top 21 ranked names in the Nasdaq-100 RS Matrix and only sell them once they fall significantly out of favor to reduce turnover. Once a position moves low enough in the matrix to warrant its removal, we sell it and then buy the highest-ranked security that we do not already own to replace it. In this way, we consistently rotate the portfolio out of relative underperformers and into relative outperformers over time. To read more about the approach behind the index, click here to read our whitepaper titled, “Applying Momentum to the Nasdaq-100 Index.”
The Index saw its first evaluation earlier in the month of July, which resulted in eight names being sold and eight new names being added. These new additions saw the exposure toward technology lose the most of any sector, however, the sector remains overweight within the portfolio at over 42% of the index. Healthcare saw the largest gain of any sector, increasing over 14% to an allocation of 23.81% following the latest evaluation. Each of the current index holdings can be found below, along with the breakdown of sector weights within the index.

Market action Friday saw the last trading day for the month of July, which resulted in the S&P 500 Index SPX ending the week slightly lower but finishing the month at a gain of more than 2%. As we head into August, the S&P 500 sits less than 1% off its all-time chart high of 4420 that was reached for the second time this month in trading Thursday. The index has also seen a positive return in each of the last six months, with five out of those six months seeing a gain of at least 2%. The consistent improvement from the core market benchmark has certainly been welcomed by investors, but also raises the question of just how long this improvement can continue. The US equity market has proven repeatedly to look past eye-catching negative headlines while moving higher. However, the three-month span ahead of August through October has certainly seen some intense market movement throughout history.
To examine these moves further, we have taken the average, minimum, and maximum returns for the S&P 500 monthly from April 1987 through June 2021. This data reveals that the upcoming month of August has shown the second-lowest minimum decline of any month in our testing history, at a loss of 14.58% in August 1998, with October having the lowest minimum at a -21.76% return in 1987. August is also one of only two months to show a negative average return, with the other being September. Furthermore, August showed one of the lowest maximum returns of any month.

The percent of positive returns for each month in our testing timeframe saw August as the second-lowest percentage at 56% of the years since 1987. September showed the lowest percentage at just 50% of the years. Even though the months of October through November have shown some intense drawdowns, the percentage of those months with positive returns increases as you move closer toward the end of the year.

We also examined the average, minimum, and maximum return for SPX over three-month rolling time periods beginning with November through January and ending with October through December. This data showed that the July through September timeframe had the lowest average return and was the only average in the red at -0.88%. The second-lowest average was the three-month span from August through October, which also saw the second-worst minimum return at -24.48%.
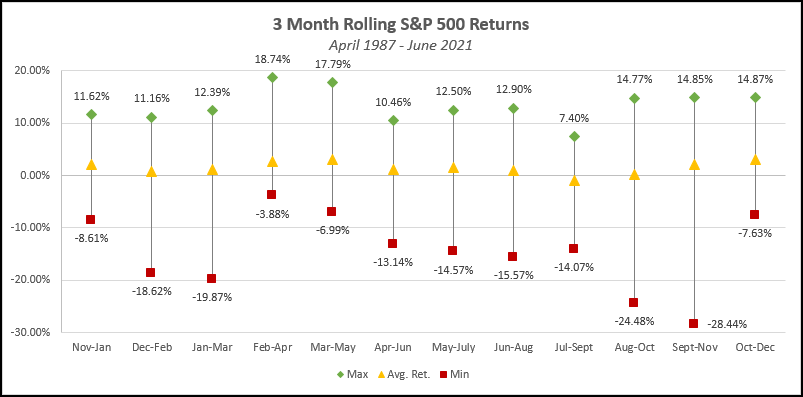
This data does not necessarily mean that the upcoming month is due for sharply negative returns, as there have been many instances of positive returns in August historically. Domestic equity markets also continue to rank highly in our relative strength comparisons and have shown a recent uptick in participation through indicators such as the Bullish Percent for NYSE ^BPNYSE, which reversed back up into a column of X's following trading Thursday. With that said, the historical tendencies for more muted returns in the months of August through October should certainly be considered when making asset allocation decisions, as it is especially important to maintain exposure toward those sectors with increased relative strength or individual equities that possess favorable technical attributes.
The historic strength of the broad S&P 500 Index funds group can hide the shift in strength of other asset classes. On the domestic equity front, the sectors that were leaders for much of the year have shown significant deterioration in their scores. Most notably are the two financials groups which were not only ranked high on the sector view, but also on the entire asset class group scores system. Consumer cyclicals, transportation, and industrials are following the same path. On the other hand, real estate, technology, and utilities have improved the most over the last six months. This is a bit unusual. Two of these three sectors are typically associated with defensive asset allocations while the third, technology, has a much more risk-on nature.

One thing to keep in mind is that many of the mega-cap names that drive the S&P 500 are within the technology sector and mega-cap names can be viewed as defensive when compared to small and mid-caps which are more risk-on groups. This is also what we’re seeing in terms of score directions of US styles, small caps have substantial negative score directions while the large-cap groups are either positive or essentially flat. Large-cap growth leads all other US styles groups in terms of score direction and is close to passing micro caps in terms of average group score which would put it in a position to pass the S&P 500 Index Funds group next.

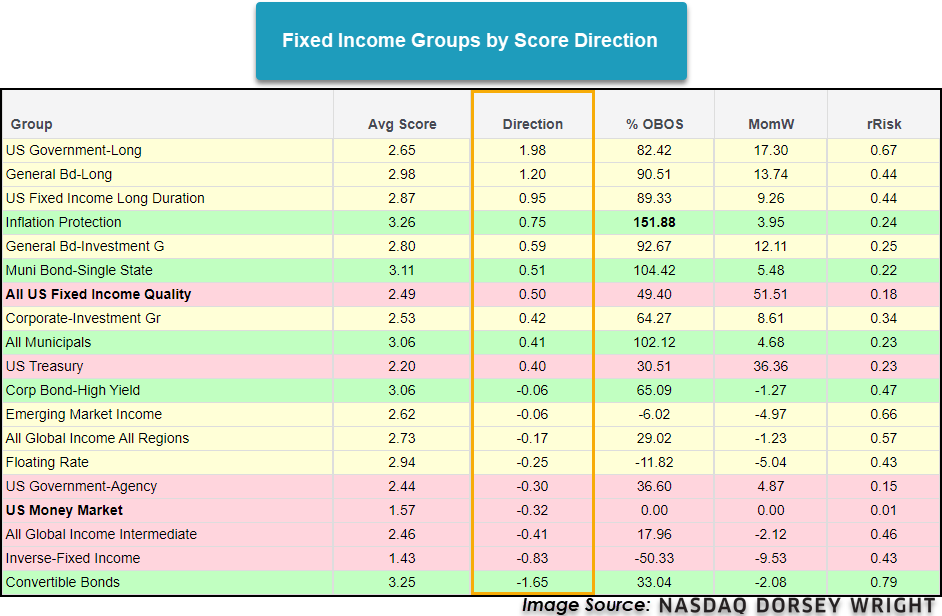
Outside of the equity space, the movement in fixed income groups has also been noticeable when looking through a risk-on versus risk-off lens. The most improved fixed income groups are long-duration bonds, inflation protection, investment grade, and US quality fixed income. The fixed income group with the worst score direction is convertible bonds, which is on the surface surprising given the broad equity markets seem strong, but this can also be viewed as risk-off behavior. International fixed income groups are also showing signs of deterioration.
While much of the changes in strength can be viewed as risk-off behavior, further confirmation is needed before any major changes to asset allocations need to be made. However, keeping a close eye on these relationships will be important moving forward. This is a very good time to go through client’s portfolios and see if there are places that may need to be trimmed back on, specifically in groups that have shown signs of weakness. For example, small caps may still be lingering in many of your clients’ portfolios after their strength at the beginning of the year. As always, remember to visit the Asset Class Group Scores page to stay on top of any market trends and changes.

Average Level
33.70
| AGG | iShares US Core Bond ETF |
| USO | United States Oil Fund |
| DIA | SPDR Dow Jones Industrial Average ETF |
| DVY | iShares Dow Jones Select Dividend Index ETF |
| DX/Y | NYCE U.S.Dollar Index Spot |
| EFA | iShares MSCI EAFE ETF |
| FXE | Invesco CurrencyShares Euro Trust |
| GLD | SPDR Gold Trust |
| GSG | iShares S&P GSCI Commodity-Indexed Trust |
| HYG | iShares iBoxx $ High Yield Corporate Bond ETF |
| ICF | iShares Cohen & Steers Realty ETF |
| IEF | iShares Barclays 7-10 Yr. Tres. Bond ETF |
| LQD | iShares iBoxx $ Investment Grade Corp. Bond ETF |
| IJH | iShares S&P 400 MidCap Index Fund |
| ONEQ | Fidelity Nasdaq Composite Index Track |
| QQQ | Invesco QQQ Trust |
| RSP | Invesco S&P 500 Equal Weight ETF |
| IWM | iShares Russell 2000 Index ETF |
| SHY | iShares Barclays 1-3 Year Tres. Bond ETF |
| IJR | iShares S&P 600 SmallCap Index Fund |
| SPY | SPDR S&P 500 Index ETF Trust |
| TLT | iShares Barclays 20+ Year Treasury Bond ETF |
| GCC | WisdomTree Continuous Commodity Index Fund |
| VOOG | Vanguard S&P 500 Growth ETF |
| VOOV | Vanguard S&P 500 Value ETF |
| EEM | iShares MSCI Emerging Markets ETF |
| XLG | Invesco S&P 500 Top 50 ETF |
| Symbol | Company | Sector | Current Price | Action Price | Target | Stop | Notes |
|---|---|---|---|---|---|---|---|
| GFL | GFL Environmental Inc | Waste Management | $33.53 | low to upper 30s | 38 | 26 | 5 for 5'er, 5 consec buy signals, pullback from ATH |
| AKR | Acadia Realty Trust | Real Estate | $21.23 | 20 - 22 | 28 | 18 | 4 for 5'er, #6 of 154 in REAL sector matrix, one box from RS buy signal, 2.7% yield |
| STOR | Store Capital Corp. | Real Estate | $36.52 | mid-to-upper 30s | 47.50 | 30 | 5 for 5'er, multiple buy signals, one box from 52-week high, 4.1% yield, R-R>2.0 Earn. 8/5 |
| RVNC | Revance Therapeutics, Inc | Biomedics/Genetics | $29.24 | hi 20s - low 30s | 40 | 26 | 5 for 5'er, top 25% of BIOM sector matrix, quad top breakout, positive trend change, pos monthly mom flip Earnings 8/4 |
| NDLS | Noodles & Company | Restaurants | $12.04 | 11.50 - 13.50 | 20 | 10 | 5 for 5'er, #1 of 28 in REST sector matrix, triple top, pullback to mid of trading band, R-R>2.5 Earnings 8/3 |
| SEM | Select Medical Holdings Corporation | Healthcare | $39.16 | hi 30s - low 40s | 58 | 35 | 5 for 5'er, #8 of 116 names in favored HEAL sector matrix, multiple buy signals, good R-R, Earn. 8/5 |
| UE | Urban Edge Properties | Real Estate | $19.06 | 18 - 19.50 | 29.50 | 16 | 5 for 5'er, top 10% of REAL sector matrix, pullback from 52-week high, 3.1% yield, R-R>3.0 Earn. 8/4 |
| JBL | Jabil Circuit, Inc. | Electronics | $58.94 | low to high 50s | 73 | $47 | 4 for 5'er, multi-year highs, consecutive buy signals, top 10% of DWAELEC Earnings 9/22 |
| OXY | Occidental Petroleum Corporation | Oil | $26.78 | upper 20s - lower 30s | 33.50 | 22 | 3 for 5'er, top half of favored OIL sector matrix, bullish triangle, pullback from 52-week high, Earn 8/3 |
| TW | Tradeweb Markets, Inc. Class A | Business Products | $86.95 | 80s | 100 | 71 | 4 for 5'er, top 20% of BUSI sector matrix, triple top, pullback from ATH Earnings 7/29 |
| UNH | UnitedHealth Group Incorporated | Healthcare | $412.08 | 390-420 | 496 | 340 | 4 for 5'er, top half of favored DWAHEAL matrix, consec buy signals, pullback from ATH, pos weekly mom flip, 1.38% yield |
| MS | Morgan Stanley | Wall Street | $96.28 | 90s | 109 | 83 | 5 for 5'er, top 10% of WALL sector matrix, spread triple top, LT pos mkt RS, 3.1% yield |
| ENTG | Entegris Inc. | Semiconductors | $120.15 | 110s to high 120s | 170 | 95 | 5 for 5'er, pullback from ATH, long-term market RS buy signal, top 25% of DWASEMI Earnings 7/27 |
| GGG | Graco Inc | Machinery and Tools | $76.38 | mid 70s to low 80s | 108 | 64 | 4 for 5'er, consec buy signals, pullback from ATH, 1 box from bullish triangle, pos weekly momentum, long-term market & peer RS buy signals |
| DHI | D.R. Horton, Inc. | Building | $95.51 | 90s | 109 | 79 | 4 for 5'er, top 25% of BUIL sector matrix, LT pos mkt RS, spread quad top breakout, pos. trend change |
| AA | Alcoa Inc. | Metals Non Ferrous | $39.37 | mid to upper 30s to mid 40s | 56 | 30 | 4 for 5'er, bearish signal reversal pattern, pullback from multi-year highs, pos weekly mom flip, long-term market RS buy signal |
| VEEV | Veeva Systems Inc. | Software | $332.61 | 302s - 330s | 416 | 276 | 4 for 5'er, top 25% of SOFT sector matrix, LT pos mkt RS, multiple buy signals, Earn. 8/25 |
| ODFL | Old Dominion Freight Line, Inc. | Transports/Non Air | $267.99 | 250s to 280s | 324 | 216 | 5 for 5'er, pullback from ATH, 5 consec buy signals, LT market RS, pos weekly momentum, top 1/3 DWATRANS |
| ARCH | Arch Resources Inc | Oil | $68.45 | mid-to-upper 60s | 85 | 56 | 5 for 5'er, top 10% of oil sector matrix, bullish catapult, pullback from 52-wk high, R-R~2.0 |
| Symbol | Company | Sector | Current Price | Action Price | Target | Stop | Notes |
|---|---|---|---|---|---|---|---|
| OPEN | Opendoor Technologies Inc. | Wall Street | $14.97 | low to mid 10s | 2 | 19.50 | 0 for 5'er, 4 consecutive sell signals, negative trend, bottom of DWAWALL matrix, negative monthly momentum, Earn. 8/11 |
| RAMP | Liveramp Holdings Inc. | Business Products | $40.32 | high 40s to high 30s | 36 | 51 | 0 for 5'er, 10 consec sell signals, 52 week lows, negative monthly mom flip, negative trend Earnings 8/5 |
| Comment | |||||||
|---|---|---|---|---|---|---|---|
|
|
|||||||
ARCH Arch Resources Inc R $65.72) - Oil - ARCH is a 5 for 5'er that ranks in the top decile of the oil sector matrix. In trading earlier this week, ARCH completed a bullish catapult and reached a new 52-week high, before pulling back in Friday's trading. Long exposure may be added in the mid-to-upper $60s and we will set our initial stop at $56, the potential trend line violation on ARCH's default chart. We will use the bullish price objective, $85, as our target price, giving us a reward-to-risk ratio just north of 2.0
| 69.00 | X | 69.00 | ||||||||||||||||||||||||||||||||||||||||||||||||||||
| 68.00 | X | o | 68.00 | |||||||||||||||||||||||||||||||||||||||||||||||||||
| 67.00 | X | o | 67.00 | |||||||||||||||||||||||||||||||||||||||||||||||||||
| 66.00 | X | o | 66.00 | |||||||||||||||||||||||||||||||||||||||||||||||||||
| 65.00 | X | o | 65.00 | |||||||||||||||||||||||||||||||||||||||||||||||||||
| 64.00 | X | X | 64.00 | |||||||||||||||||||||||||||||||||||||||||||||||||||
| 63.00 | • | X | O | X | 63.00 | |||||||||||||||||||||||||||||||||||||||||||||||||
| 62.00 | • | X | X | X | • | X | O | X | 62.00 | |||||||||||||||||||||||||||||||||||||||||||||
| 61.00 | X | X | • | X | X | O | X | O | X | O | X | O | 61.00 | |||||||||||||||||||||||||||||||||||||||||
| 60.00 | X | O | X | O | • | X | O | X | O | X | O | X | O | X | 60.00 | |||||||||||||||||||||||||||||||||||||||
| 59.00 | • | X | 6 | O | X | O | X | • | X | O | 7 | X | O | X | O | X | O | X | 59.00 | |||||||||||||||||||||||||||||||||||
| 58.00 | X | • | X | O | X | O | O | X | O | X | O | X | O | X | O | X | O | • | O | X | Mid | 58.00 | ||||||||||||||||||||||||||||||||
| 57.00 | X | O | • | X | O | X | O | X | O | X | O | X | O | X | O | X | • | O | X | 57.00 | ||||||||||||||||||||||||||||||||||
| 56.00 | X | O | • | X | X | O | O | X | O | X | O | O | X | O | • | O | X | • | 56.00 | |||||||||||||||||||||||||||||||||||
| 55.00 | X | O | • | X | O | X | X | X | • | O | X | O | X | O | • | • | O | X | • | 55.00 | ||||||||||||||||||||||||||||||||||
| 54.00 | X | X | O | • | X | O | X | O | X | O | X | • | O | X | O | • | • | O | • | 54.00 | ||||||||||||||||||||||||||||||||||
| 53.00 | X | O | X | O | • | X | O | X | O | X | O | X | • | O | X | • | • | 53.00 | ||||||||||||||||||||||||||||||||||||
| 52.00 | X | O | X | X | X | O | • | X | O | X | O | O | • | O | X | • | 52.00 | |||||||||||||||||||||||||||||||||||||
| 51.00 | X | O | X | O | X | X | O | X | O | X | • | X | O | • | O | X | • | 51.00 | ||||||||||||||||||||||||||||||||||||
| 50.00 | X | O | X | O | X | O | X | O | X | O | X | X | O | • | X | X | • | O | • | 50.00 | ||||||||||||||||||||||||||||||||||
| 49.00 | X | O | X | 2 | X | O | X | O | X | O | X | O | X | O | X | • | X | X | O | X | • | • | 49.00 | |||||||||||||||||||||||||||||||
| 48.00 | X | O | X | O | X | O | O | X | O | X | O | X | O | X | O | • | X | O | X | O | 5 | • | 48.00 | |||||||||||||||||||||||||||||||
| 47.00 | O | X | O | O | X | 3 | O | O | X | O | X | O | X | O | X | • | 47.00 | |||||||||||||||||||||||||||||||||||||
| 46.00 | O | X | O | • | O | X | O | X | O | O | X | • | 46.00 | |||||||||||||||||||||||||||||||||||||||||
| 45.00 | O | X | • | O | O | X | X | O | • | 45.00 | ||||||||||||||||||||||||||||||||||||||||||||
| 44.00 | O | • | O | X | O | X | • | • | 44.00 | |||||||||||||||||||||||||||||||||||||||||||||
| 43.00 | • | O | X | 4 | O | X | • | 43.00 | ||||||||||||||||||||||||||||||||||||||||||||||
| 42.00 | • | O | X | O | X | O | • | 42.00 | ||||||||||||||||||||||||||||||||||||||||||||||
| 41.00 | • | O | X | O | X | • | Bot | 41.00 | ||||||||||||||||||||||||||||||||||||||||||||||
| 40.00 | • | O | O | • | 40.00 |

| ABG Asbury Automotive Group Inc. ($204.96) - Retailing - ABG broke a double top at $204 on Friday, marking the stock’s fourth consecutive buy signal. ABG is a 3 for 5’er within the retailing sector that has experienced three weeks of positive weekly momentum. From here, support sits at $192. |
| AMCX AMC Networks Inc ($51.02) - Media - AMCX broke a double bottom at $51 on Friday, marking the stock’s fourth consecutive sell signal. This move violated the bullish support line, demoting AMCX to an unacceptable 0 for 5’er. Monthly momentum just flipped negative and AMCX ranks near the bottom of the unfavored media sector stock matrix. Avoid. Earnings are expected on 8/6. |
| AMRC Ameresco Inc. ($68.53) - Machinery and Tools - Shares of AMRC broke a double top at $69 on Friday, resulting in a sixth consecutive buy signal. The 5 for 5'er ranks second out of 72 names in the machinery and tools stock sector matrix and is approaching its all-time chart high from February of this year. Demand is in control and those looking to build long exposure may consider dollar-cost averaging at current levels. Initial support is offered at around $63. |
| CPRI Capri Holdings Ltd ($56.38) - Retailing - CPRI broke a double top at $53 before moving higher to $58 on Friday as a reaction to earnings. The stock broke through its bearish resistance line, flipping the trend back to positive. As a result, CPRI is a 4 for 5’er within the retailing sector. Demand is in control. From here, support sits at $48 while CPRI is testing overhead resistance at current levels. |
| CROX Crocs, Inc. ($135.57) - Textiles/Apparel - CROX broke a double top at $138 on Friday, marking the stock’s sixth consecutive buy signal and a new all-time high. CROX is a 5 for 5’er that ranks #1 in the textiles/apparel sector stock matrix. Additionally, weekly momentum has been positive for two weeks, suggesting the potential for higher prices. From here, support sits at $126. |
| EAT Brinker International Inc ($54.52) - Restaurants - EAT is a 2 for 5’er that ranks 28th out of 29 names in the unfavored restaurants sector matrix. With today’s action, EAT broke a double bottom at $55, marking the stock’s second consecutive sell signal. From here, additional support sits at $54 while EAT faces resistance at $60. Avoid. Earnings are expected on 8/18. |
| EQT EQT Corporation ($18.40) - Gas Utilities - EQT broke a double bottom at $18 on Friday, marking the stock’s second consecutive sell signal. With yesterday’s action, EQT was demoted to a 2 for 5’er as its market RS chart reversed down into Os. Weekly momentum has been negative for seven weeks while monthly momentum just flipped negative. Avoid. |
| KLAC KLA Corp ($348.16) - Semiconductors - KLAC moved sharply higher Friday following its earnings report to break a spread quadruple top at $328 before matching its all-time high at $356 intraday. This 5 for 5'er moved to a positive trend last week and ranks in the top half of the semiconductors sector RS matrix. The weight of the evidence is positive here, however, the stock is nearing overbought territory. Initial support can be found at $304. |
| MITK Mitek Systems, Inc. ($22.11) - Software - MITK moved higher Friday after their earnings release to break a double top at $21 before reaching $22 intraday, marking a new all-time high and a gain of more than 13%. This 5 for 5'er moved to a positive trend in July 2020 and ranks in the top quintile of the software sector RS matrix. The weight of the evidence is positive here, however, the stock has entered overbought territory. Those looking to add exposure may look to ease in at current levels or wait for a potential pullback/normalization of the trading band. Initial support can be found at $18.50 with further support offered at $18. |
| Name | Option Symbol | Action | Stop Loss |
|---|---|---|---|
| Twitter, Inc - $69.75 | O: 21L65.00D17 | Buy the December 65.00 calls at 9.95 | 64.00 |
| Name | Option | Action |
|---|---|---|
| Cleveland-Cliffs Inc. ( CLF) | Oct. 21.00 Calls | Initiate an option stop loss of 3.15 (CP: 5.15) |
| Amphenol Corporation ( APH) | Oct. 67.50 Calls | Initiate an option stop loss of 3.90 (CP: 5.90) |
| eBay Inc. ( EBAY) | Oct. 65.00 Calls | Stopped at 7.75 (CP: 5.70) |
| L Brands Inc. ( LB) | Nov. 75.00 Calls | Initiate an option stop loss of 8.15 (CP: 8.60) |
| Name | Option Symbol | Action | Stop Loss |
|---|---|---|---|
| NIO Inc. Sponsored ADR Class A - $44.68 | O: 21S50.00D16 | Buy the July 50.00 puts at 10.65 | 48.00 |
| Name | Option | Action |
|---|---|---|
| Uber Technologies, Inc. (UBER) | Sep. 55.00 Puts | Raise the option stop loss to 9.75 (CP: 11.75) |
| Fastly, Inc. Class A (FSLY) | Dec. 55.00 Puts | Initiate an option stop loss of 9.65 (CP: 11.65) |
| Name | Option Sym. | Call to Sell | Call Price | Investment for 500 Shares | Annual Called Rtn. | Annual Static Rtn. | Downside Protection |
|---|---|---|---|---|---|---|---|
| Alcoa Inc. $39.37 | O: 21K42.00D19 | Nov. 42.00 | 3.85 | $18,370.00 | 43.10% | 30.25% | 8.49% |
| Name | Action |
|---|---|
| Cleveland-Cliffs Inc. (CLF) - 24.86 | Sell the October 22.00 Calls. |
| Antero Resources Corp (AR) - 13.61 | Sell the November 15.00 Calls. |
| United States Steel Corporation (X) - 25.47 | Sell the October 25.00 Calls. |
| CommScope Holding Company, Inc. (COMM) - 21.21 | Sell the November 21.00 Calls. |
| Cloudflare Inc Class A (NET) - 120.39 | Sell the November 115.00 Calls. |
| NVIDIA Corporation (NVDA) - 196.62 | Sell the November 195.00 Calls. |
| Mosaic Company (MOS) - 31.13 | Sell the December 32.00 Calls. |
| Dick's Sporting Goods, Inc. (DKS) - 105.11 | Sell the December 110.00 Calls. |
| Halliburton Company (HAL) - 21.25 | Sell the October 21.00 Calls. |
| The Trade Desk Inc (TTD) - 84.10 | Sell the November 90.00 Calls. |
| Applied Materials, Inc. (AMAT) - 137.50 | Sell the October 140.00 Calls. |
| Green Plains Inc. (GPRE) - 34.55 | Sell the December 36.00 Calls. |
| Name | Covered Write |
|---|---|
|
|
|
Daily Equity & Market Analysis
LISTEN TO PODCAST
Apr 02, 2026
Loading, Please Wait...
