The historic strength of the broad S&P 500 Index funds group can hide the shift in strength of other asset classes.
The historic strength of the broad S&P 500 Index funds group can hide the shift in strength of other asset classes. On the domestic equity front, the sectors that were leaders for much of the year have shown significant deterioration in their scores. Most notably are the two financials groups which were not only ranked high on the sector view, but also on the entire asset class group scores system. Consumer cyclicals, transportation, and industrials are following the same path. On the other hand, real estate, technology, and utilities have improved the most over the last six months. This is a bit unusual. Two of these three sectors are typically associated with defensive asset allocations while the third, technology, has a much more risk-on nature.

One thing to keep in mind is that many of the mega-cap names that drive the S&P 500 are within the technology sector and mega-cap names can be viewed as defensive when compared to small and mid-caps which are more risk-on groups. This is also what we’re seeing in terms of score directions of US styles, small caps have substantial negative score directions while the large-cap groups are either positive or essentially flat. Large-cap growth leads all other US styles groups in terms of score direction and is close to passing micro caps in terms of average group score which would put it in a position to pass the S&P 500 Index Funds group next.

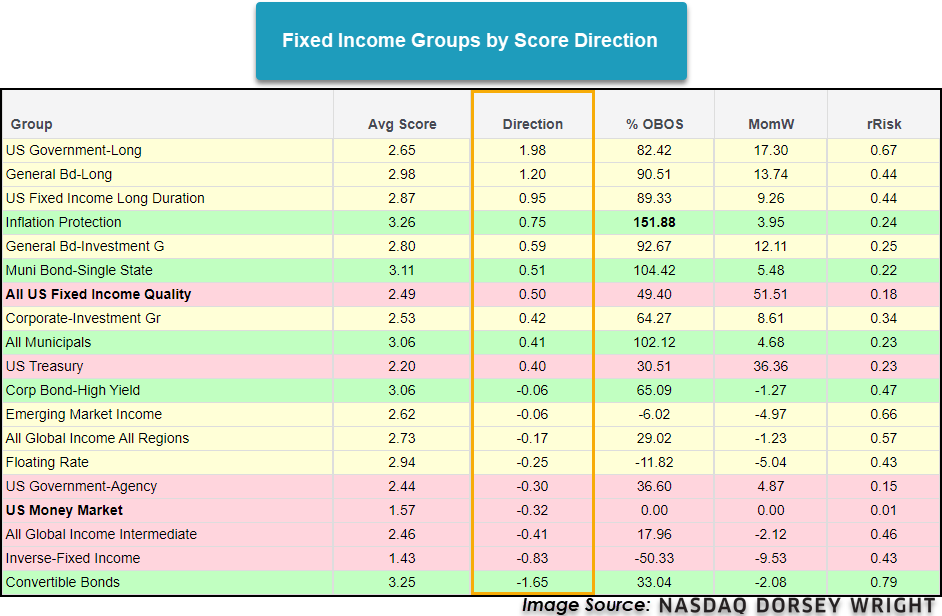
Outside of the equity space, the movement in fixed income groups has also been noticeable when looking through a risk-on versus risk-off lens. The most improved fixed income groups are long-duration bonds, inflation protection, investment grade, and US quality fixed income. The fixed income group with the worst score direction is convertible bonds, which is on the surface surprising given the broad equity markets seem strong, but this can also be viewed as risk-off behavior. International fixed income groups are also showing signs of deterioration.
While much of the changes in strength can be viewed as risk-off behavior, further confirmation is needed before any major changes to asset allocations need to be made. However, keeping a close eye on these relationships will be important moving forward. This is a very good time to go through client’s portfolios and see if there are places that may need to be trimmed back on, specifically in groups that have shown signs of weakness. For example, small caps may still be lingering in many of your clients’ portfolios after their strength at the beginning of the year. As always, remember to visit the Asset Class Group Scores page to stay on top of any market trends and changes.