Most Requested Symbols

Although the recent weakness in energy is undoubtedly negative for the sector, there are some individual energy names that are continuing to hold up on a technical basis. That said, today we present a “buy, hold, and sell” analysis of the broader energy sector.
The average distribution reading is 25.04% overbought.
Today's featured stock is Graco Inc (GGG)
ABC, ALLY, CLFD, DDS, DHI, DKS, FB, ITT, KKR, LOW, MGA, ROKU, SKX & TECH
Call: Spirit Realty Capital (SRC); Put: LyondellBasell (LYB); Covered Write: Dick's Sporting Goods (DKS)
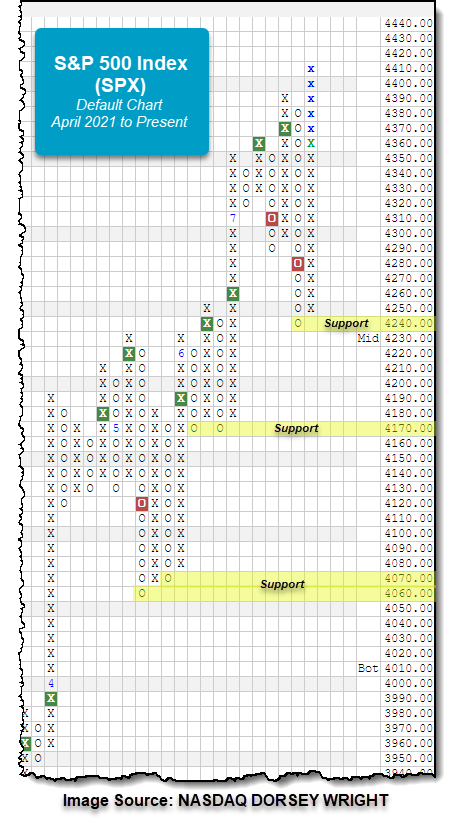
Market action on Friday led the S&P 500 Index SPX to break a double top at 4400 on its default chart before reaching a new all-time high at 4410. The market benchmark had seen a decline of -1.59% on Monday, its largest single-day drop since mid-May. However, the index has improved by over 3.5% over the past four trading days during its ascent to current levels. The sharp rally has led the SPX into slightly overbought territory at an intraday weekly overbought/oversold reading of about 77% at the time of this writing. Initial support can be found on the default chart at 4240, with the middle of the ten-week trailing trading band is currently positioned at 4230. Further support is offered at 4170 from June and the 4070-4060 threshold from May.

From a technical standpoint, the energy sector had been a relative leader since mid-January when it moved up into the top half of the DALI US sector rankings and since June, the sector maintained a solid ranking of 3 or higher. However, with this past week’s worth of market action, the energy sector fell drastically from #2 to #6 overnight, giving up its position of longer-term leadership. Additionally, the energy sector has lost a total of 31 tally signals in DALI since the start of the third quarter, the most of any other sector, and, using the SPDR sector fund lineup as proxies, energy has underperformed all other broad sectors over that same period with a loss of -9.60% (through 7/22). Surprisingly, the energy sector remains the year-to-date leader in terms of performance with a gain of 28.50%, followed by the real estate sector, up 25.44%. Although this recent weakness is undoubtedly negative for the sector, there are some individual energy names that are continuing to hold up on a technical basis, while some have broken down. That said, today we present a buy, hold, and sell analysis of the broader energy sector.

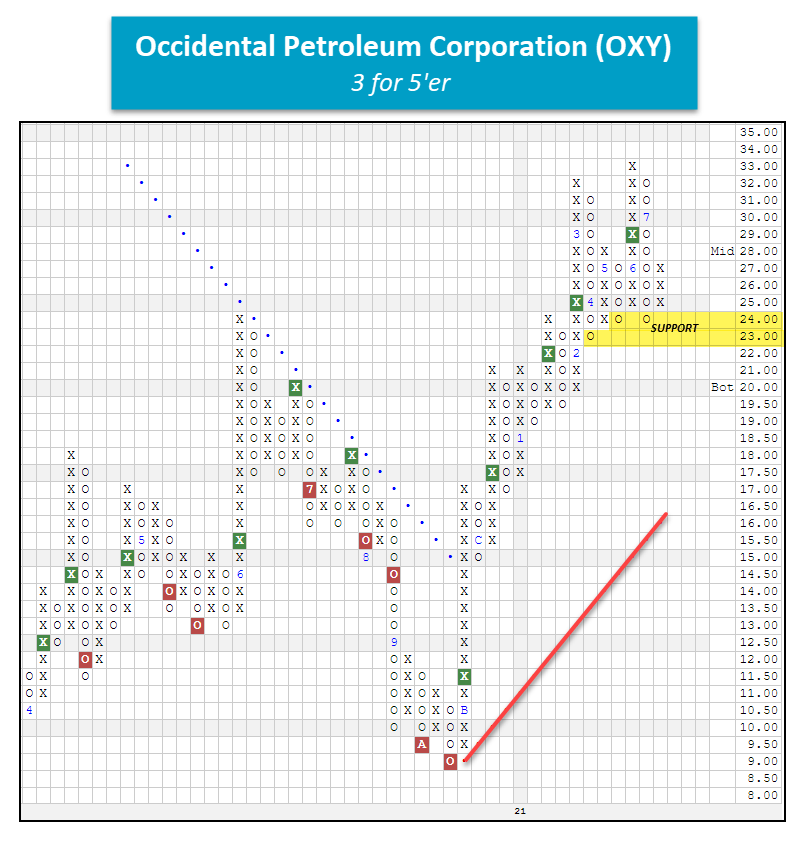
Buy - Occidental Petroleum Corporation OXY
OXY is a solid 3 for 5’er that currently sits in the top half of the oil sector stock matrix. The stock has been trading above its bullish support line since November 2020 and maintains a market RS buy signal, confirming its superior long-term strength versus the broader market. OXY has given five consecutive buy signals since November, telling us that demand remains firmly in control here. In June, OXY reached a new multi-year high with a move to $33 before pulling back to support at $24 in July along with the broader energy sector. With recent market action, however, the chart of OXY has reversed back up into X's to $27. From here, a move to $34 would mark the sixth consecutive buy signal and a new multi-year high. With an OBOS% reading of -23% oversold, new positions are welcome at current levels as demand is in control. Note that OXY expects to release earnings on August 3. Initial support is offered here at $24 with further support at $23. Note the long-term trend line lies at $16.
Additional "Buy" Energy Stocks
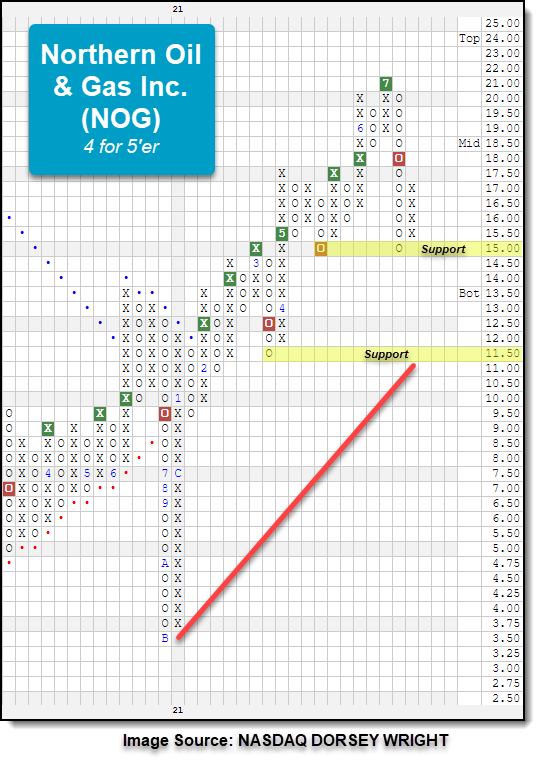
Hold – Northern Gas & Oil Inc. NOG
Prior to July 16, NOG had been a 5 for 5’er but fell to a 4 for 5’er following a reversal into a column of O’s on its market RS with the conclusion of trading last week. NOG still maintains an RS buy signal, exhibiting long-term strength, versus the market and its peer group. Additionally, the stock maintains near-term positive RS versus its peer group and ranks in the top quintile of the Oil sector matrix. On the chart below, NOG broke a double bottom at $18 on July 14 to complete a bearish signal reversal pattern. Following action on Monday, NOG fell to $15, matching the May low on the chart. NOG, fortunately, held this support level and reversed back into a column of X’s at $17 following action on Wednesday. While the stock is currently on a sell signal, the fact that it is still a 4 for 5’er and it held support at $15 leads us to believe that holding the position is still viable. If the chart were to reverse back down into O’s and fall to $14.50 it would be a potential spread triple bottom break, which would change our tune in terms of considering the stock a hold. On the flip side of the coin, if NOG rallies to return to a buy signal with a potential double top at $22 it would confirm follow-through and that near-term demand is back in play. Note resistance currently lies at $21, the July 2021 chart high, and at $24, the December 2020 high mark on the chart.
Additional "Hold" Energy Stocks
Sell – Phillips 66 PSX
While we did witness some energy stocks better their June rallies earlier this month, PSX was not among those. Since hitting its near-term peak at $94 in June, we have seen a series of lower tops and bottoms. With the recent double bottom break at $79 on July 14, PSX completed a bearish catapult pattern and violated the bullish support line. The chart fell down to $70 with Tuesday’s action, and the rebounded the following day as it reversed back into X’s at $74. From a technical attribute perspective, PSX had been a 3 for 5’er as recently as April. Around that time though, PSX reversed down into a column of O’s on its market RS chart, indicating near-term underperformance by the stock relative to the market and causing PSX to fall to a 2 for 5’er. As noted above, PSX violated the bullish support line last week, and with action this week has given a peer RS sell signal. Both of these negative moves caused PSX to lose the remaining two attributes and fall to a 0 for 5’er. Some may hold the position as a yield play – its current yield of 4.88% - but with the trend reversal, we are seeing lower prices, and we must assess whether the yield received from the stock is greater than the deterioration in price. Bearing all this in mind, we would look to step away from PSX at this time as the weight of the evidence is negative.

Additional "Sell" Energy Stocks
Municipal bond funds attracted roughly $56.9 billion in flows during the first six months of 2021, which is the most of any first half of a year going back to 1992 (Source: wsj.com). The surge is mainly attributed to wealthy investors seeking tax-sheltered interest, prompted by a fear of income-tax hikes. Given that most municipal bonds pay interest free from federal income tax, and sometimes state taxes, wealthy investors see this as an opportunity to protect themselves. However, because the safety of a municipal bond depends on the financial stability of the issuer, as well as what type of bond it is, not all debts are equal in risk. Additionally, due to the amount of funds allocated from the America Rescue Plan to help state and local governments, some further question the ability of municipalities to meet revenue hurdles when federal funding wanes (Source: Bloomberg).
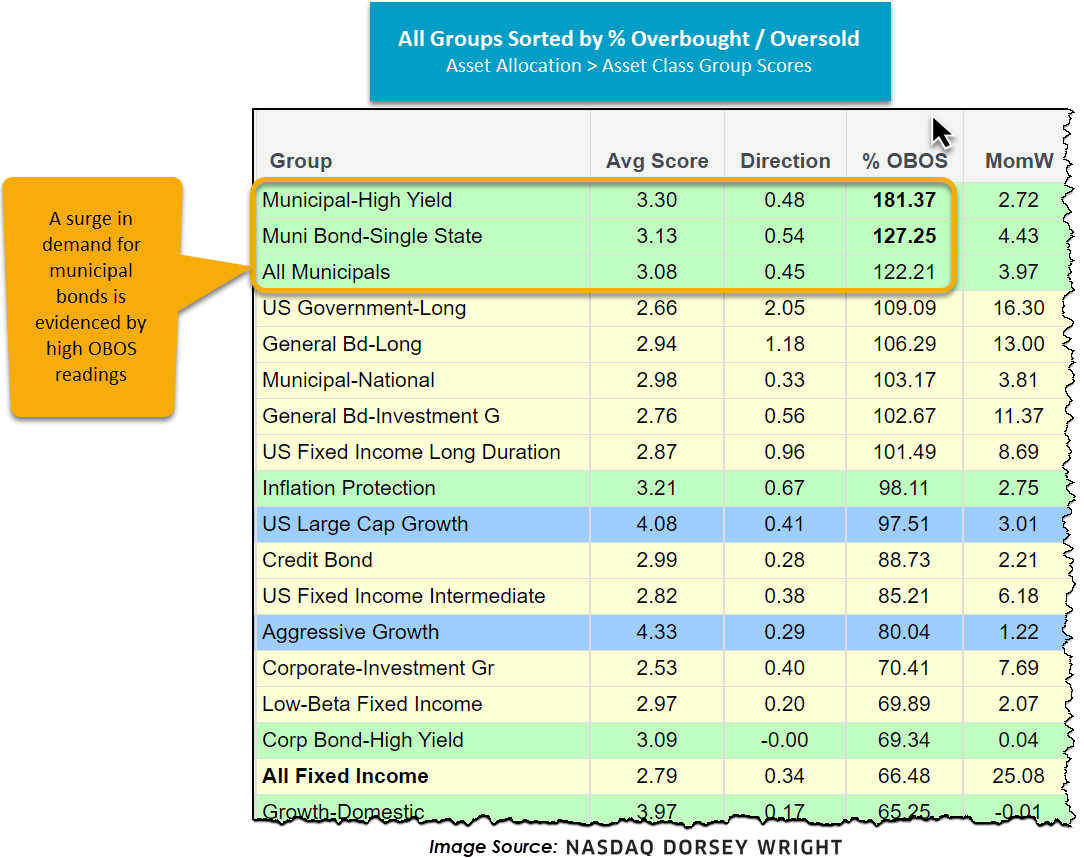
Nonetheless, investors seem to view a potential tax hike as a greater risk given the demand for municipal bonds remains elevated - particularly municipal high yield debt. If looking at the Asset Class Group Scores page and sorting all groups by their respective % Overbought/Oversold (OBOS) reading, displayed above, we can see a conglomeration of municipals at the top – evidencing the continued surge. Furthermore, it is interesting to see the tight tracking in average group score between the municipal debt and inflation protection group, shown below, especially since early November of 2020, perhaps illustrating the dual expectation/risk of rising rates and income taxes.

Note that the municipal bond and inflation protection groups each carry an average score north of 3.0, making them acceptable places to park money in a fixed income sleeve; however, with lofty prices in the municipal markets and special tax considerations, keep in mind that these will not be sufficient for all clients and account types at present. Per usual, to stay updated on market movements and trends within asset classes, make sure to visit the Asset Class Group Scores page.

Average Level
25.04
| AGG | iShares US Core Bond ETF |
| USO | United States Oil Fund |
| DIA | SPDR Dow Jones Industrial Average ETF |
| DVY | iShares Dow Jones Select Dividend Index ETF |
| DX/Y | NYCE U.S.Dollar Index Spot |
| EFA | iShares MSCI EAFE ETF |
| FXE | Invesco CurrencyShares Euro Trust |
| GLD | SPDR Gold Trust |
| GSG | iShares S&P GSCI Commodity-Indexed Trust |
| HYG | iShares iBoxx $ High Yield Corporate Bond ETF |
| ICF | iShares Cohen & Steers Realty ETF |
| IEF | iShares Barclays 7-10 Yr. Tres. Bond ETF |
| LQD | iShares iBoxx $ Investment Grade Corp. Bond ETF |
| IJH | iShares S&P 400 MidCap Index Fund |
| ONEQ | Fidelity Nasdaq Composite Index Track |
| QQQ | Invesco QQQ Trust |
| RSP | Invesco S&P 500 Equal Weight ETF |
| IWM | iShares Russell 2000 Index ETF |
| SHY | iShares Barclays 1-3 Year Tres. Bond ETF |
| IJR | iShares S&P 600 SmallCap Index Fund |
| SPY | SPDR S&P 500 Index ETF Trust |
| TLT | iShares Barclays 20+ Year Treasury Bond ETF |
| GCC | WisdomTree Continuous Commodity Index Fund |
| VOOG | Vanguard S&P 500 Growth ETF |
| VOOV | Vanguard S&P 500 Value ETF |
| EEM | iShares MSCI Emerging Markets ETF |
| XLG | Invesco S&P 500 Top 50 ETF |
| Symbol | Company | Sector | Current Price | Action Price | Target | Stop | Notes |
|---|---|---|---|---|---|---|---|
| GTES | Gates Industrial Corporation plc | Business Products | $17.90 | high 10s | 22 | 14 | 4 for 5'er, top 1/3 of business products sector RS matrix, bullish triangle, multi-year highs, consec buys Earnings 8/2 |
| GFL | GFL Environmental Inc | Waste Management | $31.94 | low to upper 30s | 38 | 26 | 5 for 5'er, 5 consec buy signals, pullback from ATH Earnings 7/28 |
| AKR | Acadia Realty Trust | Real Estate | $20.90 | 20 - 22 | 28 | 18 | 4 for 5'er, #6 of 154 in REAL sector matrix, one box from RS buy signal, 2.7% yield Earnings 7/28 |
| STOR | Store Capital Corp. | Real Estate | $36.07 | mid-to-upper 30s | 47.50 | 30 | 5 for 5'er, multiple buy signals, one box from 52-week high, 4.1% yield, R-R>2.0 Earn. 8/5 |
| RVNC | Revance Therapeutics, Inc | Biomedics/Genetics | $30.27 | hi 20s - low 30s | 40 | 26 | 5 for 5'er, top 25% of BIOM sector matrix, quad top breakout, positive trend change, pos monthly mom flip Earnings 8/4 |
| NDLS | Noodles & Company | Restaurants | $12.15 | 11.50 - 13.50 | 20 | 10 | 5 for 5'er, #1 of 28 in REST sector matrix, triple top, pullback to mid of trading band, R-R>2.5 Earnings 8/4 |
| SEM | Select Medical Holdings Corporation | Healthcare | $38.77 | hi 30s - low 40s | 58 | 35 | 5 for 5'er, #8 of 116 names in favored HEAL sector matrix, multiple buy signals, good R-R, Earn. 7/28 |
| HOME** | AT Home Group Inc | Retailing | $36.99 | mid to upper 30s | 41 | 29 | 5 for 5'er, top 10% of favored DWARETA, 4 consec buy signals, multi-year high |
| UE | Urban Edge Properties | Real Estate | $18.73 | 18 - 19.50 | 29.50 | 16 | 5 for 5'er, top 10% of REAL sector matrix, pullback from 52-week high, 3.1% yield, R-R>3.0 Earn. 8/4 |
| JBL | Jabil Circuit, Inc. | Electronics | $55.62 | low to high 50s | 73 | $47 | 4 for 5'er, multi-year highs, consecutive buy signals, top 10% of DWAELEC |
| OXY | Occidental Petroleum Corporation | Oil | $27.01 | upper 20s - lower 30s | 33.50 | 22 | 3 for 5'er, top half of favored OIL sector matrix, bullish triangle, pullback from 52-week high, Earn 8/3 |
| TW | Tradeweb Markets, Inc. Class A | Business Products | $87.76 | 80s | 100 | 71 | 4 for 5'er, top 20% of BUSI sector matrix, triple top, pullback from ATH Earnings 7/29 |
| UNH | UnitedHealth Group Incorporated | Healthcare | $415.77 | 390-420 | 496 | 340 | 4 for 5'er, top half of favored DWAHEAL matrix, consec buy signals, pullback from ATH, pos weekly mom flip, 1.38% yield |
| MS | Morgan Stanley | Wall Street | $95.57 | 90s | 109 | 83 | 5 for 5'er, top 10% of WALL sector matrix, spread triple top, LT pos mkt RS, 3.1% yield |
| ENTG | Entegris Inc. | Semiconductors | $118.41 | 110s to high 120s | 170 | 95 | 5 for 5'er, pullback from ATH, long-term market RS buy signal, top 25% of DWASEMI Earnings 7/27 |
| GGG | Graco Inc | Machinery and Tools | $76.10 | mid 70s to low 80s | 108 | 64 | 4 for 5'er, consec buy signals, pullback from ATH, 1 box from bullish triangle, pos weekly momentum, long-term market & peer RS buy signals |
| Symbol | Company | Sector | Current Price | Action Price | Target | Stop | Notes |
|---|---|---|---|---|---|---|---|
| OPEN | Opendoor Technologies Inc. | Wall Street | $14.52 | low to mid 10s | 2 | 19.50 | 0 for 5'er, 4 consecutive sell signals, negative trend, bottom of DWAWALL matrix, negative monthly momentum, Earn. 8/11 |
| RAMP | Liveramp Holdings Inc. | Business Products | $40.92 | high 40s to high 30s | 36 | 51 | 0 for 5'er, 10 consec sell signals, 52 week lows, negative monthly mom flip, negative trend Earnings 8/9 |
| Symbol | Company | Sector | Current Price | Action Price | Target | Stop | Notes |
|---|---|---|---|---|---|---|---|
| ASML | Asm Lithograpghy HLDG NV (Netherlands) ADR | Semiconductors | $729.92 | mid-to-upper 600s | 856 | 592 | See follow comment below. |
| Comment |
|---|
| ASML Asm Lithograpghy HLDG NV R (Netherlands) ADR ($748.71) - Semiconductors - ASML has moved outside of our actionable range with today’s move and a new all-time high at $744. We will maintain our $592 stop. |
GGG Graco Inc R ($76.42) - Machinery and Tools - GGG is a strong buy as it is a 4 for 5’er within the machinery and tools sector stock matrix. This stock trades on a buy signal and sits one box from giving a second at $79, which would also complete a bullish triangle pattern. GGG has maintained long-term strength versus the market since giving a market RS buy signal in April 2017 and has maintained a peer RS buy signal since December 2015. Furthermore, weekly momentum has been positive for three weeks, adding to the positive technical picture. Okay to add new exposure in the mid-70s to low 80s. We will set our initial stop at $64, which would take out multiple levels of support on the chart, and will use GGG’s bullish price objective of $108 as our near-term price target.
| 19 | 20 | 21 | |||||||||||||||||||||||||||||||||||||||||||||||||||
| 79.00 | 5 | 79.00 | |||||||||||||||||||||||||||||||||||||||||||||||||||
| 78.00 | X | O | X | X | 78.00 | ||||||||||||||||||||||||||||||||||||||||||||||||
| 77.00 | X | O | 7 | O | X | 77.00 | |||||||||||||||||||||||||||||||||||||||||||||||
| 76.00 | X | X | X | O | X | O | X | 76.00 | |||||||||||||||||||||||||||||||||||||||||||||
| 75.00 | X | O | X | O | X | O | X | O | Mid | 75.00 | |||||||||||||||||||||||||||||||||||||||||||
| 74.00 | X | O | X | O | 4 | 6 | X | 74.00 | |||||||||||||||||||||||||||||||||||||||||||||
| 73.00 | X | X | O | O | X | X | O | X | 73.00 | ||||||||||||||||||||||||||||||||||||||||||||
| 72.00 | X | O | X | O | 2 | O | X | O | X | 72.00 | |||||||||||||||||||||||||||||||||||||||||||
| 71.00 | X | O | X | O | X | O | X | O | 71.00 | ||||||||||||||||||||||||||||||||||||||||||||
| 70.00 | X | 1 | O | X | O | X | 70.00 | ||||||||||||||||||||||||||||||||||||||||||||||
| 69.00 | X | X | O | O | X | 69.00 | |||||||||||||||||||||||||||||||||||||||||||||||
| 68.00 | X | O | X | 3 | X | Bot | 68.00 | ||||||||||||||||||||||||||||||||||||||||||||||
| 67.00 | X | X | O | X | O | X | 67.00 | ||||||||||||||||||||||||||||||||||||||||||||||
| 66.00 | X | O | X | C | O | X | 66.00 | ||||||||||||||||||||||||||||||||||||||||||||||
| 65.00 | X | O | X | O | 65.00 | ||||||||||||||||||||||||||||||||||||||||||||||||
| 64.00 | X | O | B | 64.00 | |||||||||||||||||||||||||||||||||||||||||||||||||
| 63.00 | A | O | X | 63.00 | |||||||||||||||||||||||||||||||||||||||||||||||||
| 62.00 | X | O | X | 62.00 | |||||||||||||||||||||||||||||||||||||||||||||||||
| 61.00 | X | O | 61.00 | ||||||||||||||||||||||||||||||||||||||||||||||||||
| 60.00 | X | • | 60.00 | ||||||||||||||||||||||||||||||||||||||||||||||||||
| 59.00 | 9 | • | 59.00 | ||||||||||||||||||||||||||||||||||||||||||||||||||
| 58.00 | X | • | 58.00 | ||||||||||||||||||||||||||||||||||||||||||||||||||
| 57.00 | • | X | • | 57.00 | |||||||||||||||||||||||||||||||||||||||||||||||||
| 56.00 | 2 | • | 8 | • | 56.00 | ||||||||||||||||||||||||||||||||||||||||||||||||
| 55.00 | X | O | • | X | • | 55.00 | |||||||||||||||||||||||||||||||||||||||||||||||
| 54.00 | X | O | • | X | • | 54.00 | |||||||||||||||||||||||||||||||||||||||||||||||
| 53.00 | X | 1 | O | • | X | X | • | 53.00 | |||||||||||||||||||||||||||||||||||||||||||||
| 52.00 | X | O | X | O | 3 | • | X | O | X | • | 52.00 | ||||||||||||||||||||||||||||||||||||||||||
| 51.00 | X | O | X | X | O | X | O | X | • | X | O | X | • | 51.00 | |||||||||||||||||||||||||||||||||||||||
| 50.00 | 4 | O | 6 | O | C | O | X | O | X | O | • | • | 6 | O | X | • | 50.00 | ||||||||||||||||||||||||||||||||||||
| 49.00 | X | 5 | X | O | X | O | O | X | O | • | X | X | • | X | O | 7 | • | 49.00 | |||||||||||||||||||||||||||||||||||
| 48.00 | 7 | 9 | 3 | O | X | 7 | B | O | X | O | • | X | O | X | O | • | • | X | O | X | • | 48.00 | |||||||||||||||||||||||||||||||
| 47.00 | X | O | X | O | X | O | 8 | 9 | X | O | O | • | X | O | X | O | X | • | X | • | X | O | X | • | 47.00 | ||||||||||||||||||||||||||||
| 46.00 | X | O | X | O | X | O | X | O | X | O | X | • | X | 4 | X | O | X | O | X | O | X | O | • | 46.00 | |||||||||||||||||||||||||||||
| 45.00 | O | X | A | C | 2 | O | X | O | X | O | X | O | X | X | O | O | X | O | X | O | X | • | 45.00 | ||||||||||||||||||||||||||||||
| 44.00 | O | O | X | O | X | O | A | O | X | O | X | O | X | X | O | 5 | • | O | X | • | 44.00 | ||||||||||||||||||||||||||||||||
| 43.00 | O | X | O | X | • | O | O | X | O | X | O | X | • | • | O | X | • | 43.00 | |||||||||||||||||||||||||||||||||||
| 42.00 | O | B | O | 1 | • | O | O | X | O | X | • | O | • | 42.00 | |||||||||||||||||||||||||||||||||||||||
| 41.00 | O | X | O | X | • | O | X | O | X | • | • | 41.00 | |||||||||||||||||||||||||||||||||||||||||
| 40.00 | O | X | O | X | • | O | O | X | • | 40.00 | |||||||||||||||||||||||||||||||||||||||||||
| 39.00 | O | X | O | • | O | • | 39.00 | ||||||||||||||||||||||||||||||||||||||||||||||
| 38.00 | O | • | • | 38.00 | |||||||||||||||||||||||||||||||||||||||||||||||||
| 19 | 20 | 21 |

| ABC AmerisourceBergen Corporation ($121.35) - Drugs - ABC broke a double top at $122 which also flipped the trend back to positive. As a result, the stock is now a 4 for 5’er within the drugs sector. Weekly momentum just flipped positive, adding to the weight of the evidence. From here, support sits at $112. Earnings are expected on 8/4. |
| ALLY Ally Financial Inc. ($51.77) - Finance - ALLY broke a double top at $53 to return to a buy signal. The stock is a 5 for 5'er that ranks in the top quartile of the Finance sector matrix. Okay to consider here on the breakout. Note resistance lies at $56, the June high, while initial support lies at $47. Additional support can be found at $43, the March low. |
| CLFD Clearfield, Inc. ($42.76) - Telephone - CLFD broke a double top at $39 before moving higher to $42 on Friday. This stock is a 4 for 5’er within the telephone sector that has support available at $33. |
| DDS Dillard's, Inc. ($182.26) - Retailing - DDS returned to a buy signal with a double top breakout at $190 where the stock is now up against overhead resistance. From here, a move to $192 would match DDS’s all-time high while a move to $194 would mark a new all-time high. DDS is a 5 for 5’er within the retailing sector that is trading well above the bullish support line. Support sits at $162. Earnings are expected on 8/11. |
| DHI D.R. Horton, Inc. ($93.55) - Building - DHI broke a double top at $92 before moving higher to $94 on Friday, which flipped the trend back to positive. As a result, DHI is a 4 for 5’er within the retailing sector. From here, support sits at $87. |
| DKS Dick's Sporting Goods, Inc. ($104.41) - Retailing - DKS broke a quintuple top at $104, returning the chart to a buy signal as well as notching a new all-time high. DKS is a strong 5 for 5’er within the retailing sector that has support available at $92. |
| FB Facebook Inc. ($369.66) - Internet - FB broke a triple top at $360, completing a shakeout pattern, before continuing to rally up to a new high at $372. FB is a 3 for 5'er that ranks in the top quartile of the Internet sector matrix. With the chart now in overbought territory, we would look for a pullback to $360, a three box reversal, before taking or adding exposure. Initial support on the default chart lies at $336, while longer-term support lies at the bullish support line at $304 at this time. |
| ITT ITT Corporation ($96.58) - Machinery and Tools - Shares of ITT broke a double top at $97 on Friday, resulting in a second consecutive buy signal. The 4 for 5'er ranks in the top third of the machinery and tools stock sector matrix and has remained on an RS buy signal versus the market since 2013. Those who previously thinned positions following the consecutive sell signals may consider rebuilding such now on this breakout. Further resistance comes around $100, the all-time chart high. Initial support is offered at around $92, which is also the location of the bullish support line. Note earnings are expected on 8/5. |
| KKR KKR & Co. L.P ($61.60) - Finance - KKR broke a triple top at $62, completing a shakeout pattern and a new high on the chart. The stock is a 5 for 5'er that ranks in the top quintile of the Finance sector matrix. Okay to consider here on the breakout, as the stock is not too overbought at current levels, or on a pullback, which would occur with a three-box reversal at $59. Initial support lies at $57, while additional can be found at $54. |
| LOW Lowe's Companies, Inc. ($200.84) - Building - LOW broke a double top at $200, marking the second consecutive buy signal on the chart. LOW is a 3 for 5’er within the building sector that has maintained a long-term market RS buy signal since November 2012. From here, support sits at $192. Earnings are slated for 8/18. |
| MGA Magna Intl Inc CL A ($80.98) - Autos and Parts - MGA broke a spread quadruple bottom at $81, violating support at $82 that dates back to March of this year. The stock feel to a low of $79 for the day, which violates the bullish support line. At a minimum, the stock will fall to a 2 for 5'er with the trendline violation and the reversal into a column of O's on the stock's market RS chart. Holders may seek to step away on a potential rebound and three-box reversal at $82. Avoid for now. |
| ROKU Roku, Inc. Class A ($473.82) - Media - ROKU is a perfect 5 for 5’er within the media sector that returned to a buy signal today with a double top buy signal at $448 before moving higher to $472. From here, support sits at $392. Earnings are expected on 8/4. |
| SKX Skechers U.S.A, Inc. ($54.22) - Textiles/Apparel - SKX broke a double top at $52 on Friday before moving higher to $55, marking a new all-time high for the stock for the first time since August 2015. SKX is a 3 for 5’er within the textiles/apparel sector that just experienced a flip to positive weekly momentum. From here, support sits at $46. |
| TECH Bio-Techne Corporation ($473.12) - Biomedics/Genetics - TECH broke a double top at $472 for a second consecutive buy signal and a new high on the chart. TECH is a 5 for 5'er that ranks in the top quintile of the Biomedic/Genetics sector matrix. Okay to consider here on the breakout or on a pullback to $448 on the chart. Initial support lies at $440, while long-term support lies at the bullish support line at $392. |
| Name | Option Symbol | Action | Stop Loss |
|---|---|---|---|
| Spirit Realty Capital Inc - $50.03 | SRC2115J50 | Buy the October 50.00 calls at 2.40 | 44.00 |
| Name | Option | Action |
|---|---|---|
| eBay Inc. ( EBAY) | Oct. 65.00 Calls | Raise the option stop loss to 7.75 (CP: 9.75) |
| Name | Option Symbol | Action | Stop Loss |
|---|---|---|---|
| LyondellBasell Industries NV - $96.67 | LYB2117X105 | Buy the December 105.00 puts at 14.10 | 106.00 |
| Name | Option | Action |
|---|---|---|
| Tencent Music Entertainment Group ADR Class A (TME) | Oct. 16.00 Puts | Raise the option stop loss to 3.20 (CP: 5.20) |
| Name | Option Sym. | Call to Sell | Call Price | Investment for 500 Shares | Annual Called Rtn. | Annual Static Rtn. | Downside Protection |
|---|---|---|---|---|---|---|---|
| Dick's Sporting Goods, Inc. $101.28 | DKS2117L110 | Dec. 110.00 | 8.10 | $48,697.35 | 29.48% | 17.78% | 6.68% |
| Name | Action |
|---|---|
| Cleveland-Cliffs Inc. (CLF) - 21.07 | Sell the October 22.00 Calls. |
| Antero Resources Corp (AR) - 13.66 | Sell the November 15.00 Calls. |
| Amkor Technology, Inc. (AMKR) - 22.88 | Sell the December 23.00 Calls. |
| United States Steel Corporation (X) - 23.04 | Sell the October 25.00 Calls. |
| CommScope Holding Company, Inc. (COMM) - 19.97 | Sell the November 21.00 Calls. |
| Cloudflare Inc Class A (NET) - 113.77 | Sell the November 115.00 Calls. |
| NVIDIA Corporation (NVDA) - 195.94 | Sell the November 195.00 Calls. |
| Mosaic Company (MOS) - 30.15 | Sell the December 32.00 Calls. |
| Name | Covered Write |
|---|---|
|
|
|
Daily Equity & Market Analysis
LISTEN TO PODCAST
Apr 02, 2026
Loading, Please Wait...
