
Investors are shoveling money into municipal bond funds, making them the most overbought area on our Asset Class Group Scores page
Municipal bond funds attracted roughly $56.9 billion in flows during the first six months of 2021, which is the most of any first half of a year going back to 1992 (Source: wsj.com). The surge is mainly attributed to wealthy investors seeking tax-sheltered interest, prompted by a fear of income-tax hikes. Given that most municipal bonds pay interest free from federal income tax, and sometimes state taxes, wealthy investors see this as an opportunity to protect themselves. However, because the safety of a municipal bond depends on the financial stability of the issuer, as well as what type of bond it is, not all debts are equal in risk. Additionally, due to the amount of funds allocated from the America Rescue Plan to help state and local governments, some further question the ability of municipalities to meet revenue hurdles when federal funding wanes (Source: Bloomberg).
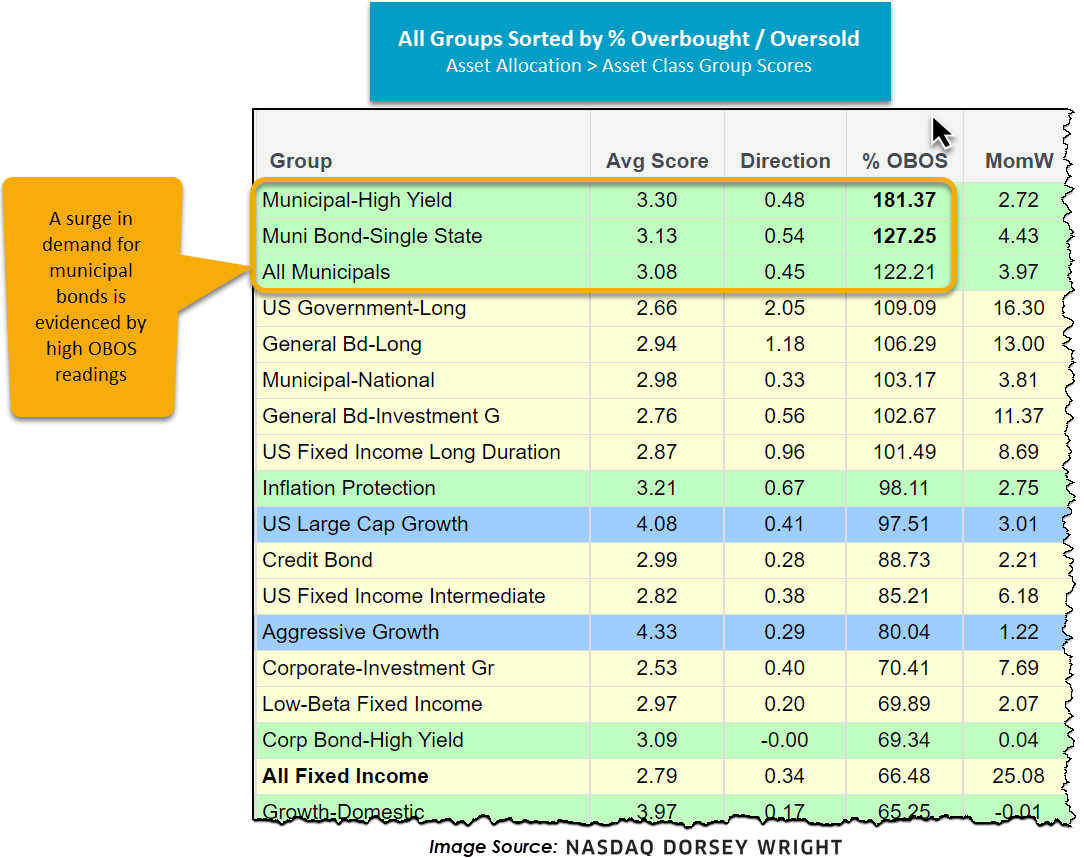
Nonetheless, investors seem to view a potential tax hike as a greater risk given the demand for municipal bonds remains elevated - particularly municipal high yield debt. If looking at the Asset Class Group Scores page and sorting all groups by their respective % Overbought/Oversold (OBOS) reading, displayed above, we can see a conglomeration of municipals at the top – evidencing the continued surge. Furthermore, it is interesting to see the tight tracking in average group score between the municipal debt and inflation protection group, shown below, especially since early November of 2020, perhaps illustrating the dual expectation/risk of rising rates and income taxes.

Note that the municipal bond and inflation protection groups each carry an average score north of 3.0, making them acceptable places to park money in a fixed income sleeve; however, with lofty prices in the municipal markets and special tax considerations, keep in mind that these will not be sufficient for all clients and account types at present. Per usual, to stay updated on market movements and trends within asset classes, make sure to visit the Asset Class Group Scores page.
