
Most Requested Symbols

As of the close on Thursday, there are just four trading days left in the first half of the year. Year-to-date (through 6/23) the S&P 500 [SPX] has gained 12.93%. It seems that anytime the market has substantial gains during the first half of the year, questions like “How much does it have left in the tank?” or “How much higher can it go?” inevitably arise.
Today's featured stock is Cactus, Inc. Class A (WHD).
CLDX, LLY, ACN, ALTR, AXP, ENSG, MGM, SHAK, & ZIM.
Call: Citizens Financial Group (CFG); Put: NRG Energy (NRG); Covered Write: Cleveland-Cliffs (CLF)
Inflation and Relative Strength Investing: May CPI numbers increased the most they have on a month-over-month basis since the 2008 timeframe. The Fed has also recently provided guidance moving up their timeline of interest rate hikes because of inflation picking up quicker than expected. While the impacts to consumers are pretty clear, what does an increase in inflation mean for investors? In this webinar on Tuesday, June 29th, we will explore some key areas of the market that have shown strong growth potential, and which areas of the market may be poised to participate in an inflationary environment. Click here to register.
Speakers:
Beginners Series Webinar: Join us on Friday, June 25th, at 2 PM (ET) for our NDW Beginners Series Webinar. This week's topic is Using the Dashboard & Account Preferences. Register Here.
If only paying attention to the media you may think the market has been on a roller coaster ride in the first half of 2021, and while parts of that may be true, it probably does not look as expected. Yes, there was/is a rotation from growth to value (and perhaps in reverse at times), and yes, we have seen material sector rotation. The Nasdaq corrected, as well as Small Caps. We experienced volatility in fixed income given changing expectations for monetary policy, also within commodities because of shortages; however, year-to-date (12/31/2020 - 6/23/2021) the S&P 500 (SPX) has seen a maximum drawdown of just 4%. Drawdown, by our calculation, is simply measuring the maximum distance (percent) from the market’s peak to trough on a forward rolling basis. We only used closing values for our study, which means the notable intraday swings we’ve seen this year are not accounted for, but nonetheless, this remains an interesting data point. In fact, should this hold, it would be the smallest drawdown since 2017 which saw a max of just 2.8%. Prior to 2017, you would have to go all the way back to 1995 to see a maximum calendar year drawdown beneath 5%. The table below shows max calendar year drawdowns for the S&P 500 since 1990.
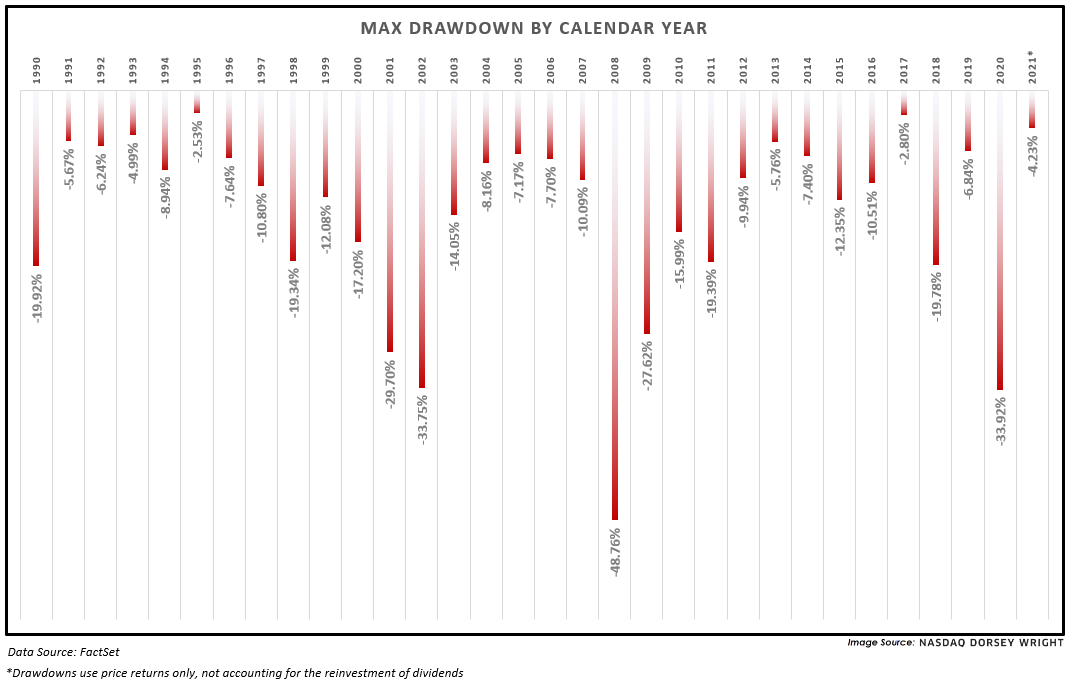
Given we are only halfway through 2021, we looked to see if small first half drawdowns tended to “mean revert” with a larger drawdown in the second half of the year. In short, we did not find empirical evidence to support this, meaning that one should not expect a rocky second half just because of a “quiet” first six months. The table below shows the first and second half maximum drawdowns for the S&P 500, labeled accordingly on the right-hand side. Note that second half drawdowns (shaded yellow) are shown on an absolute basis, meaning they were negative figures.


As of the close on Thursday, there are just four trading days left in the first half of the year. Year-to-date (through 6/23) the S&P 500 SPX has gained 12.93%. It seems that anytime the market has substantial gains during the first half of the year, questions like “How much does it have left in the tank?” or “How much higher can it go?” inevitably arise. Such questions are natural – we’re conditioned to expect a pullback following any significant run up and you can usually rely on the financial media add fuel to the fire. As it turns out, however, historically when there’s been a strong start the year, that trend has continued in the second half of the year more often that it has reversed.
The image below is an excerpt from the Informed Investor. It found that since 1928, when the S&P returned 10% or more during the first half of the year, during the second half of the year its has posted average and median gains of 6.9% and 9.1% respectively.

In order to get a more granular perspective, we have broken out the first half, second half, and calendar years returns for every year in which the S&P 500 returned 10% or more during the first half of the year (displayed in the table below).

We found that since 1928, the S&P has generated a gain of 10% or more during the first half of the year 27 times. Of those 27 years, there have only been seven occasions, slightly more than 25% of the time, when the S&P has followed up a 10%+ gain in the first half of the year with a negative return in the second half of the year. The most recent occurrence was in 1987, when the S&P gained 25.53% during the first half of the year and then went on to lose -18.72% in the second half, which of course included the Black Monday crash in October. 1987 was actually the second year in a row that the S&P gained more than 10% in the first half of the year and then lost ground down the stretch. In 1986 the index posted a gain of 18.72% through the first six months and was then down -3.46% during the second half, finishing the year with a respectable gain of 14.62%.
Only once has the S&P 500 gained more than 10% during the first half of the year and then had a second half that was bad enough to push it into negative territory for the year. As you may have already guessed, that year was 1929. The S&P was up 12.57% in the first half of ’29. But then lost -21.74% in the second half of the year, which included Black Tuesday and the start of the Great Depression.
In fact, with the exception of 1987 and 1929, which each had historic market meltdowns during October, every year in which the S&P has gained more than 10% during the first half of the year, it has finished the year with a double gain of 10% or more. Outside of '29 and '87, the lowest calendar year return for a year that started with a 10%+ gain in the first half was in 1988 when the S&P gained 10.69% to start the year and added 1.54% in the last six months bringing its total gain for the year to 12.40%.
On the other end of the spectrum, there have been 12 times when the S&P gained 10%+ in the first half and followed that up with a double-digit gain in the second half of the year. The S&P just narrowly missed accomplishing this in 2019, when it gained 17.35% in the first half and 9.82% in the second half, just shy of the 10% mark. However, we don’t have to go back much further to find the last time this occurred – in 2013 the index gained 12.63% from January through June and then gained steam, posting a gain of 15.07% in the second half of the year, to finish the year up 29.6%. The best second half finish, following a 10%+ start came in 1954, when the market gained 17.73% during the first six months and then gained momentum, adding another 23.18% in the second half, bringing the calendar year return to 45.02%, which is also the best single-year return for the S&P since 1928.
So, while it may provoke worries about a potential second-half hangover, the data shows that historically, a strong performance in the first half of the year has more often continued into the second half.
The resurgence in technology on the Asset Class Group Scores (ACGS) page has continued over the past week as the technology group advanced north of the 4.00 score threshold for the first time since April. Prior to this year, the group had largely remained in a high field position since mid-2016, with the exception of the broader market declines that occurred in late-2018 and March 2020. The recent fall from grace for technology began in late February as the group declined from a score above 5.00 to hover near the 4.00 score line by April. After a few weeks of stagnation, the group score moved south again to near the 3.00 score line by mid-May. Since that time, the score for technology has improved by more than a full score point to its most recent reading of 4.12. Advancements of a full point or more in group score have not occurred all that frequently for the technology group and certainly adds to the positive weight of the evidence for further sector improvement. The current level is in line with levels from the April stagnation, making it an important threshold to monitor for a sustained move higher.
The more focused internet group was hit harder in the most recent technology decline, as the group fell from a score north of 5.00 in late February to a low reading of 2.44 in May. The group has shown significant improvement over the past six weeks to reach a recent score posting of 3.46, gaining over a full score point in a similar fashion to the broader technology group. While the focused nature of the internet group generally leads to more volatility in score, the two technology groups are more distant from one another than we saw throughout most of the pandemic recovery trade. When looking at historical score movement between technology and internet, we can see that the internet group has a tendency to show further deterioration while the groups are falling in score, but often shows a rapid score increase once the two groups start to rise from near-term lows, ultimately catching if not surpassing the broad sector group.
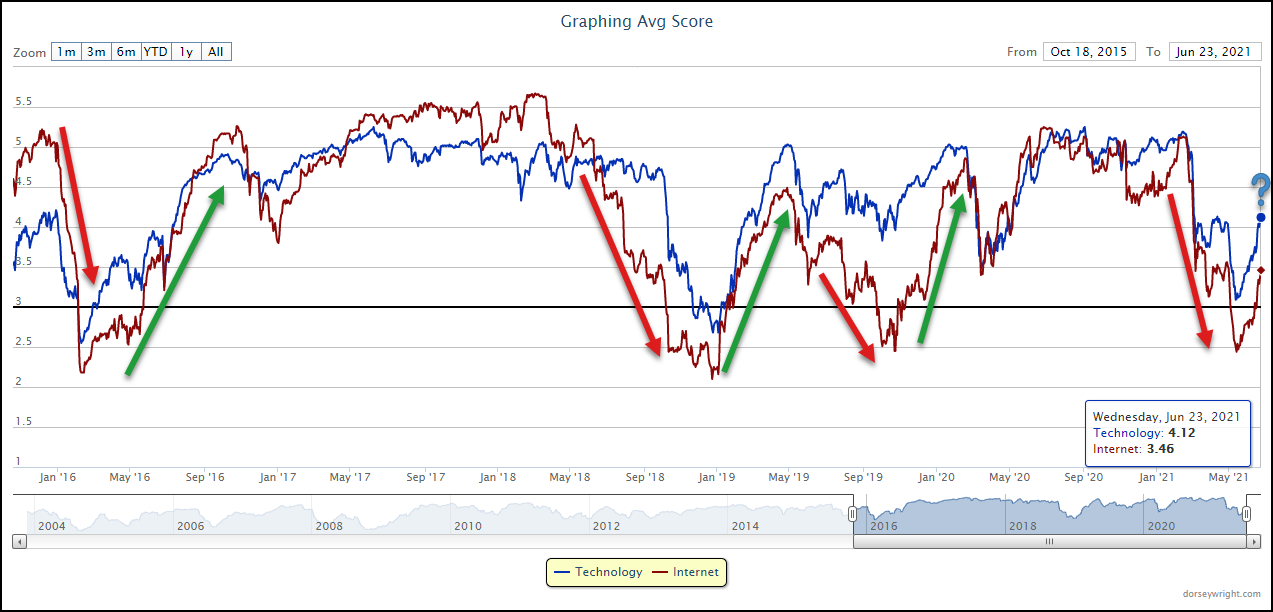
As previously mentioned, the internet group does not include all that many funds, with 19 ideas currently depicted on the ACGS page. Most of the ETF representatives focused on domestic equities are actually scoring in high field position with scores north of 4.00, while the lower scoring funds are those with global or international equity exposure. One domestic fund that has shown significant recent improvement is the Invesco Nasdaq Internet ETF PNQI, which advanced Thursday to break a double top at $255. This fund reached an all-time high at $260 in February before moving lower with the broader technology decline but has since rebounded to sit one box shy of its all-time high. This price appreciation has led to a recent score posting of 5.40, which bests the average internet fund (3.46) as well as the average US large cap growth fund at 3.87, and is paired with a strongly positive 2.34 score direction. It is important to note that the fund is nearing overbought territory and on a rather significant stem following movement Thursday. As such, those looking to add exposure may look toward easing in at current levels or waiting for a potential pullback/normalization of the trading band. Initial support can be found at $220, which has held on two previous occasions in February and May of this year.


Average Level
13.86
| AGG | iShares US Core Bond ETF |
| USO | United States Oil Fund |
| DIA | SPDR Dow Jones Industrial Average ETF |
| DVY | iShares Dow Jones Select Dividend Index ETF |
| DX/Y | NYCE U.S.Dollar Index Spot |
| EFA | iShares MSCI EAFE ETF |
| FXE | Invesco CurrencyShares Euro Trust |
| GLD | SPDR Gold Trust |
| GSG | iShares S&P GSCI Commodity-Indexed Trust |
| HYG | iShares iBoxx $ High Yield Corporate Bond ETF |
| ICF | iShares Cohen & Steers Realty ETF |
| IEF | iShares Barclays 7-10 Yr. Tres. Bond ETF |
| LQD | iShares iBoxx $ Investment Grade Corp. Bond ETF |
| IJH | iShares S&P 400 MidCap Index Fund |
| ONEQ | Fidelity Nasdaq Composite Index Track |
| QQQ | Invesco QQQ Trust |
| RSP | Invesco S&P 500 Equal Weight ETF |
| IWM | iShares Russell 2000 Index ETF |
| SHY | iShares Barclays 1-3 Year Tres. Bond ETF |
| IJR | iShares S&P 600 SmallCap Index Fund |
| SPY | SPDR S&P 500 Index ETF Trust |
| TLT | iShares Barclays 20+ Year Treasury Bond ETF |
| GCC | WisdomTree Continuous Commodity Index Fund |
| VOOG | Vanguard S&P 500 Growth ETF |
| VOOV | Vanguard S&P 500 Value ETF |
| EEM | iShares MSCI Emerging Markets ETF |
| XLG | Invesco S&P 500 Top 50 ETF |
| Symbol | Company | Sector | Current Price | Action Price | Target | Stop | Notes |
|---|---|---|---|---|---|---|---|
| GTES | Gates Industrial Corporation plc | Business Products | $17.60 | high 10s | 22 | 14 | 4 for 5'er, top 1/3 of business products sector RS matrix, bullish triangle, multi-year highs, consec buys |
| GRMN | Garmin Ltd. | Electronics | $141.87 | high 130s to high 140s | 177 | 116 | 5 for 5'er, 5 consec buy signals, double top at ATH,LT market RS buy signal |
| ASML | Asm Lithograpghy HLDG NV (Netherlands) ADR | Semiconductors | $681.65 | mid-to-upper 600s | 856 | 592 | 5 for 5'er, top 10% of SEMI sector matrix, LT pos mkt RS, R-R>2.0 |
| GFL | GFL Environmental Inc | Waste Management | $31.73 | low to upper 30s | 38 | 26 | 5 for 5'er, 5 consec buy signals, pullback from ATH |
| AKR | Acadia Realty Trust | Real Estate | $21.55 | 20 - 22 | 28 | 18 | 4 for 5'er, #6 of 154 in REAL sector matrix, one box from RS buy signal, 2.7% yield |
| CAL | Caleres Inc. | Textiles/Apparel | $28.28 | mid to upper 20s | 32 | 23 | 5 for 5'er, 6 consec buy signals, multi-year high, top 10% of DWATEXT |
| SPR | Spirit Aerosystems Holdings Inc. | Aerospace Airline | $49.03 | high 40s - low 50s | 78 | 40 | 4 for 5'er, top third of AERO sector matrix, bearish signal reversal, R-R>2.5 |
| FHN | First Horizon Corp. | Banks | $17.28 | high 10s | 25.5 | 15.5 | 4 for 5'er, 4 consec buy signals, at multi-year highs, top 15% of DWABANK matrix, 3.28% yield |
| MGM | MGM Resorts International | Gaming | $43.12 | low-to-mid 40s | 59 | 34 | 4 for 5'er, top half of GAME sector matrix, quad top breakout, R-R>2.0 |
| MSFT | Microsoft Corporation | Software | $265.27 | 250s - mid 260s | 288 | 208 | 4 for 5'er, top half of SOFT sector matrix, multiple buy signals, LT pos trend and mkt RS, 0.9% yield |
| STOR | Store Capital Corp. | Real Estate | $34.40 | mid-to-upper 30s | 47.50 | 30 | 5 for 5'er, multiple buy signals, one box from 52-week high, 4.1% yield, R-R>2.0 |
| OLN | Olin Corp | Chemicals | $46.64 | hi 40s - low 50s | 66 | 38 | 5 for 5'er, #2 of 55 names in chemicals sector matrix, triple top breakout, pullback from ATH, 1.75% yield. |
| WHD | Cactus, Inc. Class A | Oil Service | $38.67 | hi 30s - low 40s | 51.50 | 32 | 5 for 5'er, #2 of 29 in favored OILS sector matrix, bullish triangle, pullback from ATH |
| Symbol | Company | Sector | Current Price | Action Price | Target | Stop | Notes |
|---|---|---|---|---|---|---|---|
| AVNS | Avanos Medical, Inc. | Healthcare | $38.30 | low 40s - upper 30s | 35 | 47 | 0 for 5'er, negative trend, 3 consecutive sell signals, bottom 25% of DWAHEAL, negative monthly momentum |
| OPEN | Opendoor Technologies Inc. | Wall Street | $17.21 | low to mid 10s | 2 | 19.50 | 0 for 5'er, 4 consecutive sell signals, negative trend, bottom of DWAWALL matrix, negative monthly momentum |
| Comment | |||||||
|---|---|---|---|---|---|---|---|
|
|
|||||||
WHD Cactus, Inc. Class A R ($38.49) - Oil Service - WHD is a 5 for 5'er that ranks second out of 29 names in the favored oil service sector matrix. On its default chart, the stock has given four consecutive buy signals, most recently completing a bullish triangle earlier this month. The stock reached a new all-time high in last week's trading, before pulling back toward the middle of its trading band, offering an entry point for long exposure. Exposure may be added in the upper $30s to lower $40s and we will set our initial stop at $32, the first potential sell signal on WHD's default chart. We will use the bullish price objective of $51.50 as our target price. WHD also carries a 0.93% yield.
| 19 | 20 | 21 | |||||||||||||||||||||||||||||||||||||||||||||||||||
| 44.00 | X | 44.00 | |||||||||||||||||||||||||||||||||||||||||||||||||||
| 43.00 | X | O | Top | 43.00 | |||||||||||||||||||||||||||||||||||||||||||||||||
| 42.00 | X | O | 42.00 | ||||||||||||||||||||||||||||||||||||||||||||||||||
| 41.00 | • | X | O | 41.00 | |||||||||||||||||||||||||||||||||||||||||||||||||
| 40.00 | X | • | X | O | 40.00 | ||||||||||||||||||||||||||||||||||||||||||||||||
| 39.00 | X | O | • | X | X | O | 39.00 | ||||||||||||||||||||||||||||||||||||||||||||||
| 38.00 | X | 4 | O | • | X | O | X | o | 38.00 | ||||||||||||||||||||||||||||||||||||||||||||
| 37.00 | X | X | O | X | O | • | X | O | X | X | 37.00 | ||||||||||||||||||||||||||||||||||||||||||
| 36.00 | • | • | X | O | X | O | X | O | • | • | X | O | X | O | 6 | 36.00 | |||||||||||||||||||||||||||||||||||||
| 35.00 | X | • | X | O | X | O | 5 | • | X | • | 3 | O | X | O | X | 35.00 | |||||||||||||||||||||||||||||||||||||
| 34.00 | 2 | O | X | 3 | X | O | • | X | O | • | X | O | X | O | X | Mid | 34.00 | ||||||||||||||||||||||||||||||||||||
| 33.00 | X | O | X | O | O | X | X | O | • | X | O | X | O | 33.00 | |||||||||||||||||||||||||||||||||||||||
| 32.00 | X | O | O | X | O | C | 1 | • | X | O | 5 | 32.00 | |||||||||||||||||||||||||||||||||||||||||
| 31.00 | X | • | 6 | X | O | 8 | X | B | O | • | X | X | O | X | 31.00 | ||||||||||||||||||||||||||||||||||||||
| 30.00 | O | X | • | O | 7 | X | O | X | O | X | O | • | X | O | X | O | X | 30.00 | |||||||||||||||||||||||||||||||||||
| 29.00 | O | X | • | O | X | O | X | O | X | O | • | X | O | X | 4 | X | 29.00 | ||||||||||||||||||||||||||||||||||||
| 28.00 | O | 1 | • | O | O | 9 | O | X | 2 | 3 | • | X | 1 | O | 2 | O | 28.00 | ||||||||||||||||||||||||||||||||||||
| 27.00 | O | X | • | O | X | A | • | O | X | O | • | C | O | X | O | X | 27.00 | ||||||||||||||||||||||||||||||||||||
| 26.00 | O | X | • | O | X | • | O | X | O | • | • | X | O | X | O | X | Bot | 26.00 | |||||||||||||||||||||||||||||||||||
| 25.00 | O | • | O | • | O | O | • | X | • | X | O | O | 25.00 | ||||||||||||||||||||||||||||||||||||||||
| 24.00 | • | • | O | • | X | 8 | O | • | X | 24.00 | |||||||||||||||||||||||||||||||||||||||||||
| 23.00 | O | • | X | O | X | O | • | X | 23.00 | ||||||||||||||||||||||||||||||||||||||||||||
| 22.00 | O | • | X | O | X | 7 | 9 | X | • | 22.00 | |||||||||||||||||||||||||||||||||||||||||||
| 21.00 | O | • | 6 | O | X | O | X | O | X | • | 21.00 | ||||||||||||||||||||||||||||||||||||||||||
| 20.00 | O | • | X | O | X | O | X | O | A | X | • | 20.00 | |||||||||||||||||||||||||||||||||||||||||
| 19.50 | O | • | X | O | X | O | O | X | O | X | • | 19.50 | |||||||||||||||||||||||||||||||||||||||||
| 19.00 | O | X | X | O | O | X | O | X | • | 19.00 | |||||||||||||||||||||||||||||||||||||||||||
| 18.50 | O | X | O | X | O | X | O | X | • | 18.50 | |||||||||||||||||||||||||||||||||||||||||||
| 18.00 | O | X | O | X | O | X | O | B | • | 18.00 | |||||||||||||||||||||||||||||||||||||||||||
| 17.50 | O | X | 5 | X | X | X | O | • | O | X | • | 17.50 | |||||||||||||||||||||||||||||||||||||||||
| 17.00 | O | X | X | O | X | O | X | O | X | • | O | X | • | 17.00 | |||||||||||||||||||||||||||||||||||||||
| 16.50 | O | X | O | X | O | X | O | X | O | X | • | O | • | 16.50 | |||||||||||||||||||||||||||||||||||||||
| 16.00 | O | X | O | X | O | X | O | X | O | X | • | • | 16.00 | ||||||||||||||||||||||||||||||||||||||||
| 15.50 | O | X | O | X | O | O | O | X | • | 15.50 | |||||||||||||||||||||||||||||||||||||||||||
| 15.00 | O | X | O | X | O | • | 15.00 | ||||||||||||||||||||||||||||||||||||||||||||||
| 14.50 | O | X | O | X | • | 14.50 | |||||||||||||||||||||||||||||||||||||||||||||||
| 14.00 | O | X | O | X | • | 14.00 | |||||||||||||||||||||||||||||||||||||||||||||||
| 13.50 | O | X | X | X | O | X | X | • | 13.50 | ||||||||||||||||||||||||||||||||||||||||||||
| 13.00 | O | X | O | X | O | X | O | X | O | X | • | 13.00 | |||||||||||||||||||||||||||||||||||||||||
| 12.50 | O | X | O | X | O | 4 | O | X | O | X | • | 12.50 | |||||||||||||||||||||||||||||||||||||||||
| 12.00 | O | X | O | X | O | X | O | O | • | 12.00 | |||||||||||||||||||||||||||||||||||||||||||
| 11.50 | O | O | X | O | X | • | 11.50 | ||||||||||||||||||||||||||||||||||||||||||||||
| 11.00 | O | X | O | X | • | 11.00 | |||||||||||||||||||||||||||||||||||||||||||||||
| 10.50 | O | X | O | X | • | 10.50 | |||||||||||||||||||||||||||||||||||||||||||||||
| 10.00 | O | X | O | • | 10.00 | ||||||||||||||||||||||||||||||||||||||||||||||||
| 9.50 | O | X | • | 9.50 | |||||||||||||||||||||||||||||||||||||||||||||||||
| 9.00 | O | X | • | 9.00 | |||||||||||||||||||||||||||||||||||||||||||||||||
| 8.50 | O | • | 8.50 | ||||||||||||||||||||||||||||||||||||||||||||||||||
| 19 | 20 | 21 |

| ACN Accenture PLC ($291.14) - Business Products - ACN pushed higher Thursday after their earnings release to break a triple top at $296, marking a fourth consecutive buy signal and a new all-time high. This 4 for 5'er moved to a positive trend in April of last year and has been on an RS buy signal against the market since 2002. Monthly momentum also just flipped positive, suggesting the potential for further upside from here. The overall weight of the evidence is positive here and continues to improve. Exposure may be considered on this breakout, with initial support offered at $280. |
| ALTR Altair Engineering Inc. Class A ($69.55) - Software - ALTR rose Thursday to break a double top at $69 before reaching a new all-time high at $70 intraday. This 4 for 5'er moved to a positive trend in May of 2020 and ranks in the top third of the software sector RS matrix. The technical picture is strong and improving. Initial support can be found at $63, with further support offered at $62, the current location of the bullish support line, and $61. |
| AXP American Express Company ($168.31) - Finance - AXP shares moved higher today to break a double top at $168 to mark its fifth consecutive buy signal and reach a new all-time high. This 2 for 5'er has been in a positive trend since November and in a column of X's on its RS chart versus the market since March. AXP is nearing overbought levels, so those wishing to initiate a long position may be best served to scale in at current levels. From here, support is offered at $158. |
| CLDX Celldex Therapeutics Inc. ($31.84) - Biomedics/Genetics - CLDX shares moved higher today to complete a bullish triangle to mark its second consecutive buy signal. This 5 for 5'er has been in a positive trend since April and on an RS buy signal versus the market since February of 2020. CLDX is actionable at current levels with a weekly overbought/oversold reading of 18%. From here, support is offered at $27. |
| ENSG Ensign Group, Inc. ($87.00) - Healthcare - ENSG shares moved higher today to break a double top at $87 to mark its second consecutive buy signal. This 4 for 5'er moved to a positive earlier this month and has been on an RS buy signal versus the market since May of 2018. ENSG is actionable at current levels with a weekly overbought/oversold reading of -2%. From here, support is offered at $83. |
| LLY Eli Lilly and Company ($232.65) - Drugs - LLY shares moved higher today to break a triple top at $236 to mark its second consecutive buy signal and reach a new all-time high. This 4 for 5'er has been in a positive trend since December and on an RS buy signal versus its peer group since January of 2016. LLY Is near heavily overbought territory, so those wishing to initiate a long position may be best served to scale in at current levels. From here, support is offered at $220. |
| MGM MGM Resorts International ($44.06) - Gaming - MGM reversed back into a column of X's and rallied to break a double top at $45, completing a bullish catapult pattern and giving a second consecutive buy signal. The stock is a 4 for 5'er that ranks in the top half of the Gaming sector matrix. Okay to consider here on the breakout. or on a pullback to $42. Inital support liesat $41. Additional support can be found in the $35 to $37 range. |
| SHAK Shake Shack Inc ($108.06) - Restaurants - SHAK completed a triple top at $104, completing a shakeout pattern, before rallying up to $110. SHAK is a 3 for 5'er that maintains long-term positive RS versus the market and near-term positive RS versus its peers. Okay to consider here on the breakout or on a pullback to $104. Note overhead resistance exists up to $138, the January high. Support lies at $93. |
| ZIM ZIM Integrated Shipping Services Ltd. ($47.19) - Transports/Non Air - ZIM reversed back into X's at $45 before rallying to break a spread quadruple top at $48 for a new high. The stock is a 3 for 5'er that maintains near-term positive RS versus the market and its peers. Okay to consider on a pullback to $45. Initial support lies at $42, while additional can be found at $40. |
| Name | Option Symbol | Action | Stop Loss |
|---|---|---|---|
| Citizens Financial Group Inc - $46.64 | CFG2115J45 | Buy the October 45.00 calls at 3.90 | 41.00 |
| Name | Option | Action |
|---|---|---|
| Microsoft Corporation ( MSFT) | Sep. 250.00 Calls | Raise the option stop loss to 18.80 (CP: 20.80) |
| Abercrombie & Fitch Co. ( ANF) | Nov. 40.00 Calls | Raise the option stop loss to 6.20 (CP: 8.20) |
| Name | Option Symbol | Action | Stop Loss |
|---|---|---|---|
| NRG Energy, Inc. - $37.54 | NRG2117U38 | Buy the September 38.00 puts at 2.75 | 42.00 |
| Name | Option | Action |
|---|---|---|
| Las Vegas Sands Corp. (LVS) | Sep. 60.00 Puts | Raise the option stop loss to 6.85 (CP: 8.85) |
| Advanced Micro Devices, Inc. (AMD) | Sep. 82.50 Puts | Stopped at 87.00 (CP: 86.44) |
| Digital Turbine Inc. (APPS) | Sep. 75.00 Puts | Stopped at 76.00 (CP: 79.02) |
| Name | Option Sym. | Call to Sell | Call Price | Investment for 500 Shares | Annual Called Rtn. | Annual Static Rtn. | Downside Protection |
|---|---|---|---|---|---|---|---|
| Cleveland-Cliffs Inc. $21.14 | CLF2115J22 | Oct. 22.00 | 3.30 | $9,325.00 | 54.26% | 52.82% | 14.06% |
| Name | Action |
|---|---|
| The Gap, Inc. (GPS) - 32.94 | Sell the September 38.00 Calls. |
| International Game Technology (IGT) - 23.89 | Sell the October 25.00 Calls. |
| Timkensteel Corp. (TMST) - 14.22 | Sell the August 15.00 Calls. |
| The Gap, Inc. (GPS) - 32.94 | Sell the September 33.00 Calls. |
| Caesars Entertainment Inc. (CZR) - 103.22 | Sell the September 110.00 Calls. |
| Tanger Factory Outlet Centers (SKT) - 18.86 | Sell the September 20.00 Calls. |
| Himax Technologies, Inc. ADR (Taiwan) (HIMX) - 14.12 | Sell the September 16.00 Calls. |
| Devon Energy Corporation (DVN) - 29.10 | Sell the October 30.00 Calls. |
| Hawaiian Holdings, Inc. (HA) - 27.65 | Sell the October 28.00 Calls. |
| Tempur Sealy International Inc. (TPX) - 37.44 | Sell the August 37.50 Calls. |
| Norwegian Cruise Line Holdings Ltd. (NCLH) - 31.00 | Sell the August 32.50 Calls. |
| Allegheny Technologies, Inc. (ATI) - 21.33 | Sell the October 22.50 Calls. |
| The Chemours Company (CC) - 34.36 | Sell the October 35.00 Calls. |
| Name | Covered Write |
|---|---|
| Murphy Oil Corp ( MUR - 24.94 ) | October 22.50 covered write. |
| Carnival Corporation ( CCL - 28.15 ) | October 32.50 covered write. |
Daily Equity & Market Analysis
LISTEN TO PODCAST
Apr 02, 2026
Loading, Please Wait...
