
The resurgence in technology on the Asset Class Group Scores (ACGS) page has continued over the past week as the technology group advanced north of the 4.00 score threshold for the first time since April. While the more focused internet group continues to trail the broad sector, we should be aware that internet has a history of quick movement on the ACGS page.
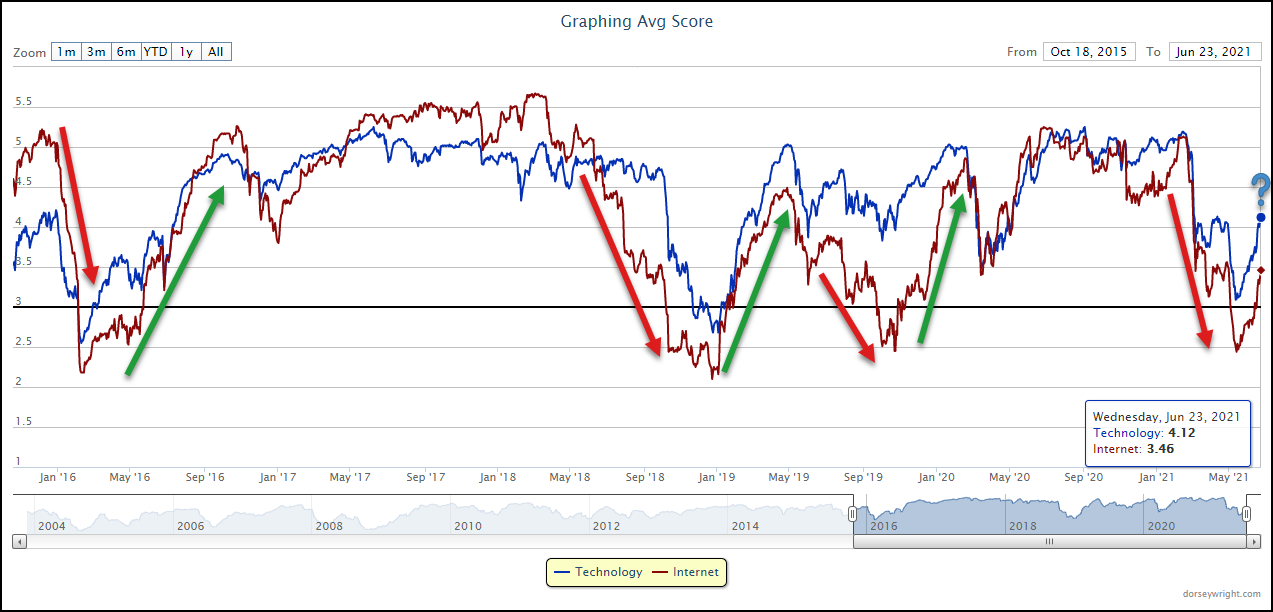
The resurgence in technology on the Asset Class Group Scores (ACGS) page has continued over the past week as the technology group advanced north of the 4.00 score threshold for the first time since April. Prior to this year, the group had largely remained in a high field position since mid-2016, with the exception of the broader market declines that occurred in late-2018 and March 2020. The recent fall from grace for technology began in late February as the group declined from a score above 5.00 to hover near the 4.00 score line by April. After a few weeks of stagnation, the group score moved south again to near the 3.00 score line by mid-May. Since that time, the score for technology has improved by more than a full score point to its most recent reading of 4.12. Advancements of a full point or more in group score have not occurred all that frequently for the technology group and certainly adds to the positive weight of the evidence for further sector improvement. The current level is in line with levels from the April stagnation, making it an important threshold to monitor for a sustained move higher.
The more focused internet group was hit harder in the most recent technology decline, as the group fell from a score north of 5.00 in late February to a low reading of 2.44 in May. The group has shown significant improvement over the past six weeks to reach a recent score posting of 3.46, gaining over a full score point in a similar fashion to the broader technology group. While the focused nature of the internet group generally leads to more volatility in score, the two technology groups are more distant from one another than we saw throughout most of the pandemic recovery trade. When looking at historical score movement between technology and internet, we can see that the internet group has a tendency to show further deterioration while the groups are falling in score, but often shows a rapid score increase once the two groups start to rise from near-term lows, ultimately catching if not surpassing the broad sector group.
As previously mentioned, the internet group does not include all that many funds, with 19 ideas currently depicted on the ACGS page. Most of the ETF representatives focused on domestic equities are actually scoring in high field position with scores north of 4.00, while the lower scoring funds are those with global or international equity exposure. One domestic fund that has shown significant recent improvement is the Invesco Nasdaq Internet ETF PNQI, which advanced Thursday to break a double top at $255. This fund reached an all-time high at $260 in February before moving lower with the broader technology decline but has since rebounded to sit one box shy of its all-time high. This price appreciation has led to a recent score posting of 5.40, which bests the average internet fund (3.46) as well as the average US large cap growth fund at 3.87, and is paired with a strongly positive 2.34 score direction. It is important to note that the fund is nearing overbought territory and on a rather significant stem following movement Thursday. As such, those looking to add exposure may look toward easing in at current levels or waiting for a potential pullback/normalization of the trading band. Initial support can be found at $220, which has held on two previous occasions in February and May of this year.

