
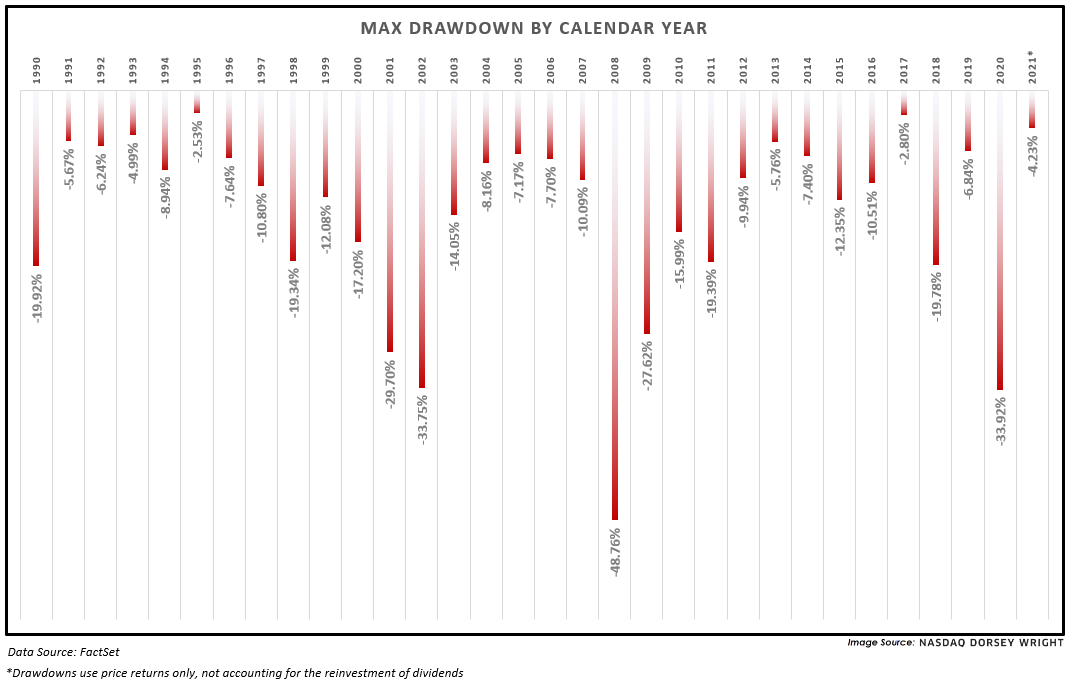
Contrary to what the media makes it seem like at times, the S&P 500 has only experienced a maximum drawdown of about 4% so far in 2021.
Inflation and Relative Strength Investing: May CPI numbers increased the most they have on a month-over-month basis since the 2008 timeframe. The Fed has also recently provided guidance moving up their timeline of interest rate hikes because of inflation picking up quicker than expected. While the impacts to consumers are pretty clear, what does an increase in inflation mean for investors? In this webinar on Tuesday, June 29th, we will explore some key areas of the market that have shown strong growth potential, and which areas of the market may be poised to participate in an inflationary environment. Click here to register.
Speakers:
- James West, CFA - Manager of Asset Management Research
- Jay Gragnani - AVP Asset Management Research
Beginners Series Webinar: Join us on Friday, June 25th, at 2 PM (ET) for our NDW Beginners Series Webinar. This week's topic is Using the Dashboard & Account Preferences. Register Here.
If only paying attention to the media you may think the market has been on a roller coaster ride in the first half of 2021, and while parts of that may be true, it probably does not look as expected. Yes, there was/is a rotation from growth to value (and perhaps in reverse at times), and yes, we have seen material sector rotation. The Nasdaq corrected, as well as Small Caps. We experienced volatility in fixed income given changing expectations for monetary policy, also within commodities because of shortages; however, year-to-date (12/31/2020 - 6/23/2021) the S&P 500 (SPX) has seen a maximum drawdown of just 4%. Drawdown, by our calculation, is simply measuring the maximum distance (percent) from the market’s peak to trough on a forward rolling basis. We only used closing values for our study, which means the notable intraday swings we’ve seen this year are not accounted for, but nonetheless, this remains an interesting data point. In fact, should this hold, it would be the smallest drawdown since 2017 which saw a max of just 2.8%. Prior to 2017, you would have to go all the way back to 1995 to see a maximum calendar year drawdown beneath 5%. The table below shows max calendar year drawdowns for the S&P 500 since 1990.
Given we are only halfway through 2021, we looked to see if small first half drawdowns tended to “mean revert” with a larger drawdown in the second half of the year. In short, we did not find empirical evidence to support this, meaning that one should not expect a rocky second half just because of a “quiet” first six months. The table below shows the first and second half maximum drawdowns for the S&P 500, labeled accordingly on the right-hand side. Note that second half drawdowns (shaded yellow) are shown on an absolute basis, meaning they were negative figures.

